Download as PDF, PPTX


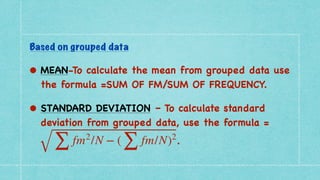
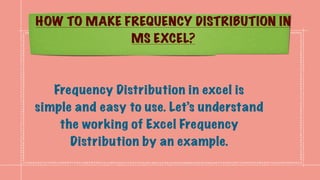
![• STANDARD DEVIATION- Standard deviation measures
how much variance there is in a set of numbers
compared to the average (mean) of the numbers.
Syntax
=STDEV.P(number1, [number2], ...
)
Arguments
• number1 - First number or reference in the sample
.
• number2 - [optional] Second number or reference.](https://image.slidesharecdn.com/caib-210511215152/85/Computer-Applications-in-Business-15-320.jpg)
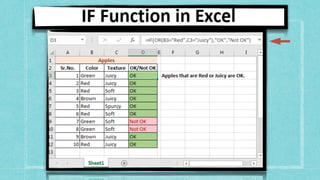
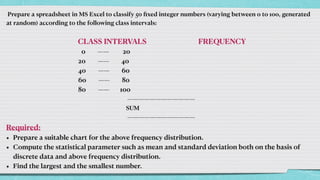
![6. IF FUNCTION
The IF function runs a logical test and returns one value for a TRUE result, and
another for a FALSE result
.
Syntax
=IF (logical_test, [value_if_true], [value_if_false]
)
Arguments
• logical_test - A value or logical expression that can be evaluated as TRUE or FALSE
.
• value_if_true - [optional] The value to return when logical_test evaluates to TRUE
.
• value_if_false - [optional] The value to return when logical_test evaluates to
FALSE.](https://image.slidesharecdn.com/caib-210511215152/85/Computer-Applications-in-Business-18-320.jpg)
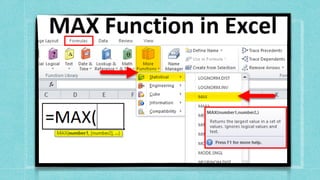
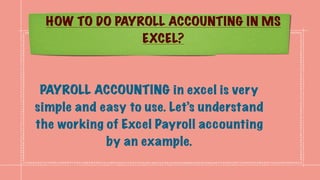
![2. MAX FUNCTION
The Excel MAX function returns the largest numeric value in a range of
values. The MAX function ignores empty cells, the logical values TRUE and
FALSE, and text values
.
Syntax
=MAX (number1, [number2], ...
)
Arguments
• number1 - Number, reference to numeric value, or range that contains
numeric values
.
• number2 - [optional] Number, reference to numeric value, or range that
contains numeric values.](https://image.slidesharecdn.com/caib-210511215152/85/Computer-Applications-in-Business-20-320.jpg)
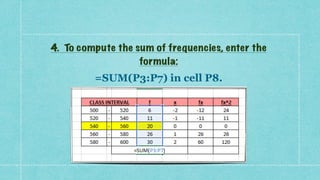
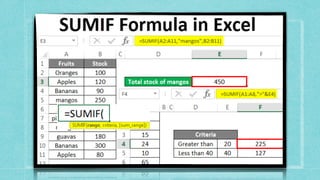
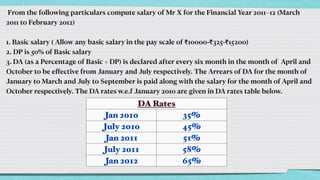
![1. SUMIF FUNCTION
You use the SUMIF function to sum the values in a range that meet criteria that you
specify
.
Syntax
The syntax for the SUMIF function in Microsoft Excel is
:
SUMIF( range, criteria, [sum_range]
)
Arguments
range: The range of cells that you want to apply the criteria against
.
criteria: The criteria used to determine which cells to add
.
sum_range: Optional. It is the range of cells to sum together. If this parameter is omitted, it uses
range as the sum_range.](https://image.slidesharecdn.com/caib-210511215152/85/Computer-Applications-in-Business-22-320.jpg)


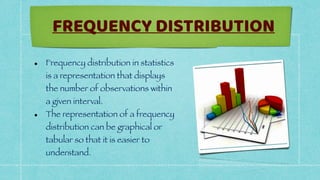
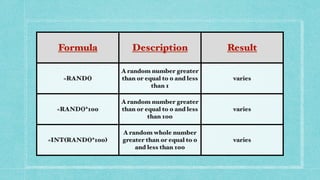
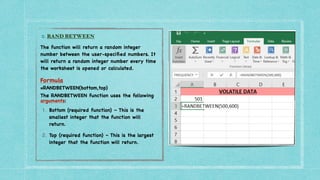
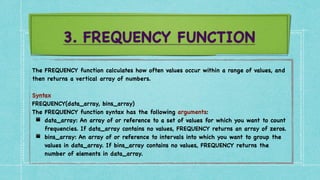
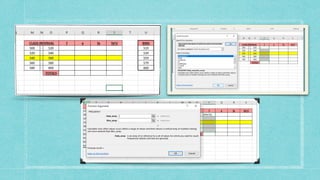
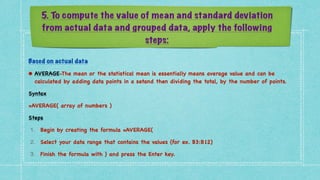
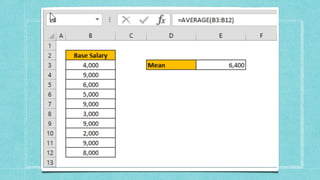
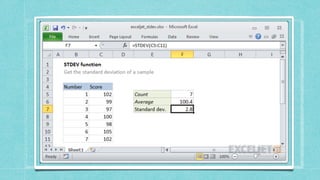
This document discusses frequency distribution and payroll accounting in Microsoft Excel. It provides examples of how to create a frequency distribution table and chart in Excel based on a data set of random numbers between 0-100 sorted into classes. It also demonstrates how to perform payroll accounting calculations in Excel, including computing salary, allowances, deductions and net salary over a financial year based on input parameters like basic salary, DA rates, HRA eligibility etc. Formulas and functions discussed include RAND, RANDBETWEEN, FREQUENCY, SUM, AVERAGE, STANDARD DEVIATION, IF, MAX and SUMIF.


![谷歌留痕技术教程[ 𝙩𝙤𝙥 𝟮𝟯𝟯. 𝙘 𝙤𝙢 ]](https://cdn.slidesharecdn.com/ss_thumbnails/top233-260130173900-2eb784f9-thumbnail.jpg?width=640&height=640&fit=bounds)


