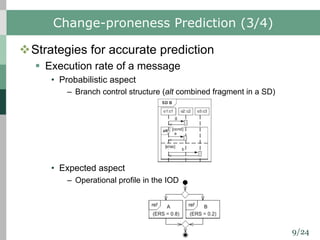
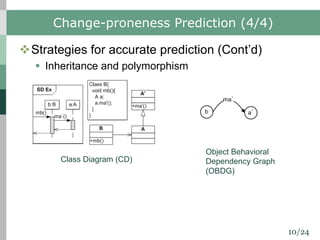
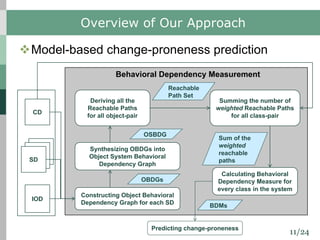
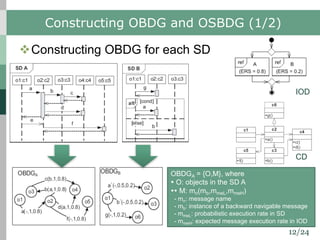
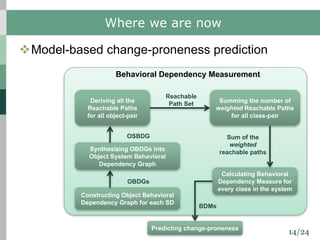
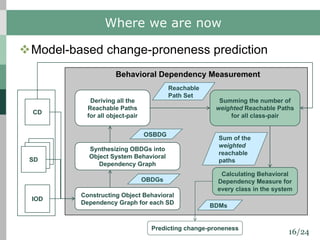
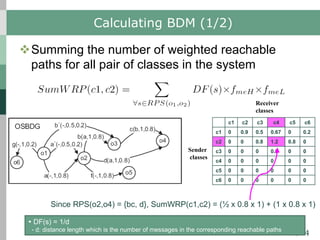
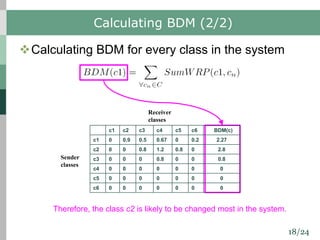
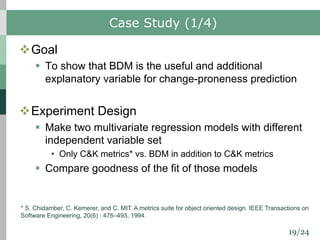
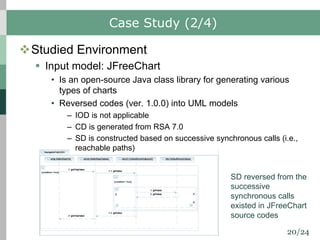
Behavioral Dependency Measurement
for Change-proneness Prediction
in UML 2.0 Design Models
Ah-Rim Han
ⓒ KAIST SE LAB 2008
Department of Computer Science,
Korea Advanced Institute of Science and Technology
COMPSAC 2008, Turku, Finland
July 29, 2008
2/24
Contents
vIntroduction
vGoal of Our Research
vChange-proneness Prediction
vOverview of Our Approach
vBehavioral Dependency Measurement
vCase Study
vRelated Work
vConclusion and Future Work
3/24
Introduction
vSoftware changes either to enhance the
functionality or to fix bugs
vSome part of the software may be more prone to
be changed than others
vIdentifying the parts which are more prone to be
changed, change-proneness, can be helpful
§ Ex) Re-design the classes which are sensitive to
change in OO
4/24
Requirement
Analysis
Design Implementation
Testing &
Integration
Planning
Release EvaluationMaintenance
Change-
proneness
Prediction
feedback
Motivation (1/2)
vSeveral research efforts for predicting change-
prone classes have been made on source codes
vWhat if change-prone classes can be predicted
earlier phase in the SDLC…?
Change-proneness prediction in Software Development Life Cycle (SDLC)
Change-
proneness
Prediction
feedback
feedback
5/24
Motivation (2/2)
vBenefit of model-based change-proneness
prediction
§ Constructing a flexible and stable software would be
much easier
• By modifying the current design before implementing to codes
• By making a decision among candidate design models
§ Development cost would be reduced
• Largest percentage of software development effort is spent on
rework and maintenance
6/24
Goal of Our Research
vProvide the Behavioral Dependency Measure
(BDM) for change-proneness prediction
§ Based on UML 2.0 design models
• Sequence diagram (SD), Class diagram (CD) and Interaction
overview diagram (IOD)
§ Based on behavioral dependencies of pairs of objects
7/24
Change-proneness Prediction (1/4)
vAssumption
§ Changes occur by change propagation
§ Changes can be predicted by examining dependencies
of pairs of objects
§ When an object sends a message to the other object,
modifying the object receiving the message may affect
the object sending the message
§ High intensity of a dependency represents high
possibility of changes to be occurred
8/24
Change-proneness Prediction (2/4)
vDefinition
§ An object sending a message has a behavioral
dependency to the object receiving the message
• Direct behavioral dependency
• Indirect behavioral dependency
Sequence Diagrams (SDs)
9/24
Change-proneness Prediction (3/4)
vStrategies for accurate prediction
§ Execution rate of a message
• Probabilistic aspect
– Branch control structure (alt combined fragment in a SD)
• Expected aspect
– Operational profile in the IOD
10/24
Change-proneness Prediction (4/4)
vStrategies for accurate prediction (Cont’d)
§ Inheritance and polymorphism
Class Diagram (CD)
Object Behavioral
Dependency Graph
(OBDG)
11/24
Overview of Our Approach
vModel-based change-proneness prediction
CD
SD
IOD
Deriving all the
Reachable Paths
for all object-pair
Synthesizing OBDGs into
Object System Behavioral
Dependency Graph
Constructing Object Behavioral
Dependency Graph for each SD
Predicting change-proneness
Calculating Behavioral
Dependency Measure for
every class in the system
Summing the number of
weighted Reachable Paths
for all class-pair
Behavioral Dependency Measurement
OBDGs
OSBDG
Reachable
Path Set
BDMs
Sum of the
weighted
reachable
paths
12/24
Constructing OBDG and OSBDG (1/2)
vConstructing OBDG for each SD
OBDGA = {O,M}, where
Ÿ O: objects in the SD A
ŸŸ M: mn(mb,mmeL,mmeH)
- mn: message name
- mb: instance of a backward navigable message
- mmeL: probabilistic execution rate in SD
- mmeH: expected message execution rate in IOD
CD
IOD
13/24
Constructing OBDG and OSBDG (2/2)
vSynthesizing OBDGs into OSBDG
14/24
Where we are now
vModel-based change-proneness prediction
Deriving all the
Reachable Paths
for all object-pair
Synthesizing OBDGs into
Object System Behavioral
Dependency Graph
Constructing Object Behavioral
Dependency Graph for each SD
Predicting change-proneness
Calculating Behavioral
Dependency Measure for
every class in the system
Summing the number of
weighted Reachable Paths
for all class-pair
Behavioral Dependency Measurement
OBDGs
OSBDG
Reachable
Path Set
BDMs
Sum of the
weighted
reachable paths
15/24
Deriving Reachable Paths
vDeriving all reachable paths for all pair of objects
in the system using OSBDG
An example of reachable path set from o1 and o3 : {ab, b’}
16/24
Where we are now
vModel-based change-proneness prediction
CD
SD
IOD
Deriving all the
Reachable Paths
for all object-pair
Synthesizing OBDGs into
Object System Behavioral
Dependency Graph
Constructing Object Behavioral
Dependency Graph for each SD
Predicting change-proneness
Calculating Behavioral
Dependency Measure for
every class in the system
Summing the number of
weighted Reachable Paths
for all class-pair
Behavioral Dependency Measurement
OBDGs
OSBDG
Reachable
Path Set
BDMs
Sum of the
weighted
reachable
paths
17/24
Calculating BDM (1/2)
vSumming the number of weighted reachable
paths for all pair of classes in the system
Ÿ DF(s) = 1/d
- d: distance length which is the number of messages in the corresponding reachable paths
Sender
classes
Receiver
classes
c1 c2 c3 c4 c5 c6
c1 0 0.9 0.5 0.67 0 0.2
c2 0 0 0.8 1.2 0.8 0
c3 0 0 0 0.8 0 0
c4 0 0 0 0 0 0
c5 0 0 0 0 0 0
c6 0 0 0 0 0 0
Since RPS(o2,o4) = {bc, d}, SumWRP(c1,c2) = (½ x 0.8 x 1) + (1 x 0.8 x 1)
18/24
Calculating BDM (2/2)
vCalculating BDM for every class in the system
Sender
classes
Receiver
classes
c1 c2 c3 c4 c5 c6 BDM(c)
c1 0 0.9 0.5 0.67 0 0.2 2.27
c2 0 0 0.8 1.2 0.8 0 2.8
c3 0 0 0 0.8 0 0 0.8
c4 0 0 0 0 0 0 0
c5 0 0 0 0 0 0 0
c6 0 0 0 0 0 0 0
Therefore, the class c2 is likely to be changed most in the system.
19/24
Case Study (1/4)
vGoal
§ To show that BDM is the useful and additional
explanatory variable for change-proneness prediction
vExperiment Design
§ Make two multivariate regression models with different
independent variable set
• Only C&K metrics* vs. BDM in addition to C&K metrics
§ Compare goodness of the fit of those models
* S. Chidamber, C. Kemerer, and C. MIT. A metrics suite for object oriented design. IEEE Transactions on
Software Engineering, 20(6) : 476–493, 1994.
20/24
Case Study (2/4)
vStudied Environment
§ Input model: JFreeChart
• Is an open-source Java class library for generating various
types of charts
• Reversed codes (ver. 1.0.0) into UML models
– IOD is not applicable
– CD is generated from RSA 7.0
– SD is constructed based on successive synchronous calls (i.e.,
reachable paths)
SD reversed from the
successive
synchronous calls
existed in JFreeChart
source codes
21/24
Case Study (3/4)
vStudied Environment (Cont’d)
§ Tool: BADAMO (BehAvioral Dependency Analyzer of
UML MOdels)
• Calculates the BDM
• Is implemented based on EMF (Eclipse Modeling Framework)
• Imports UML 2.0 models in the format of XMI generated from
RSA (Rational Software Architect) 7.0
§ Method for building prediction model: stepwise multiple
regression
• Dependent variable: change-proneness
– Total amount of changes (source lines of code added and deleted)
across the six releases (v.1.0.1 ~ 1.0.6)
• Independent variables
– C&K metrics (NOC, DIT, WMC, RFC, CBO, LCOM) and BDM
22/24
Case Study (4/4)
vResults
§ Models with only C&K
metrics
• Explains around 56%
(adjusted R2 of 0.55)
• Selected variables
– WMC (1st), CBO (2nd),
and LCOM (3rd)
§ Model with BDM in addition
to C&K metrics
• Explains around 64% (adjusted
R2 of 0.64)
• Selected variables
– WMC (1st), BDM (2nd), CBO
(3rd), LCOM (4th), and NOC (5th)
R2 is increased by 9 percent or 20 percent of the unexplained variance using BDM.
23/24
Conclusion
vModel-based change-proneness prediction using
BDM
§ Help to redesign the change-prone classes easily
• Make a stable software
• Reduce the development cost of software
§ Can be used to visualize the problematic spots
• Improve understandability of software
24/24
Future Work
vExtend BDM to take into account other
dependencies
§ Time, etc.
vInvestigate other applications of BDM
§ Fault-proneness prediction, object allocation in a
distributed system, etc.
vVisualize change-prone classes on the modeling
tools
§ Rational Rose, ArgoUML, RSA (Rational Software
Architect), etc.
ⓒ KAIST SE LAB 2008

COMPSAC 2008 Presentation

  • 1.
    Behavioral Dependency Measurement forChange-proneness Prediction in UML 2.0 Design Models Ah-Rim Han ⓒ KAIST SE LAB 2008 Department of Computer Science, Korea Advanced Institute of Science and Technology COMPSAC 2008, Turku, Finland July 29, 2008
  • 2.
    2/24 Contents vIntroduction vGoal of OurResearch vChange-proneness Prediction vOverview of Our Approach vBehavioral Dependency Measurement vCase Study vRelated Work vConclusion and Future Work
  • 3.
    3/24 Introduction vSoftware changes eitherto enhance the functionality or to fix bugs vSome part of the software may be more prone to be changed than others vIdentifying the parts which are more prone to be changed, change-proneness, can be helpful § Ex) Re-design the classes which are sensitive to change in OO
  • 4.
    4/24 Requirement Analysis Design Implementation Testing & Integration Planning ReleaseEvaluationMaintenance Change- proneness Prediction feedback Motivation (1/2) vSeveral research efforts for predicting change- prone classes have been made on source codes vWhat if change-prone classes can be predicted earlier phase in the SDLC…? Change-proneness prediction in Software Development Life Cycle (SDLC) Change- proneness Prediction feedback feedback
  • 5.
    5/24 Motivation (2/2) vBenefit ofmodel-based change-proneness prediction § Constructing a flexible and stable software would be much easier • By modifying the current design before implementing to codes • By making a decision among candidate design models § Development cost would be reduced • Largest percentage of software development effort is spent on rework and maintenance
  • 6.
    6/24 Goal of OurResearch vProvide the Behavioral Dependency Measure (BDM) for change-proneness prediction § Based on UML 2.0 design models • Sequence diagram (SD), Class diagram (CD) and Interaction overview diagram (IOD) § Based on behavioral dependencies of pairs of objects
  • 7.
    7/24 Change-proneness Prediction (1/4) vAssumption §Changes occur by change propagation § Changes can be predicted by examining dependencies of pairs of objects § When an object sends a message to the other object, modifying the object receiving the message may affect the object sending the message § High intensity of a dependency represents high possibility of changes to be occurred
  • 8.
    8/24 Change-proneness Prediction (2/4) vDefinition §An object sending a message has a behavioral dependency to the object receiving the message • Direct behavioral dependency • Indirect behavioral dependency Sequence Diagrams (SDs)
  • 9.
    9/24 Change-proneness Prediction (3/4) vStrategiesfor accurate prediction § Execution rate of a message • Probabilistic aspect – Branch control structure (alt combined fragment in a SD) • Expected aspect – Operational profile in the IOD
  • 10.
    10/24 Change-proneness Prediction (4/4) vStrategiesfor accurate prediction (Cont’d) § Inheritance and polymorphism Class Diagram (CD) Object Behavioral Dependency Graph (OBDG)
  • 11.
    11/24 Overview of OurApproach vModel-based change-proneness prediction CD SD IOD Deriving all the Reachable Paths for all object-pair Synthesizing OBDGs into Object System Behavioral Dependency Graph Constructing Object Behavioral Dependency Graph for each SD Predicting change-proneness Calculating Behavioral Dependency Measure for every class in the system Summing the number of weighted Reachable Paths for all class-pair Behavioral Dependency Measurement OBDGs OSBDG Reachable Path Set BDMs Sum of the weighted reachable paths
  • 12.
    12/24 Constructing OBDG andOSBDG (1/2) vConstructing OBDG for each SD OBDGA = {O,M}, where Ÿ O: objects in the SD A ŸŸ M: mn(mb,mmeL,mmeH) - mn: message name - mb: instance of a backward navigable message - mmeL: probabilistic execution rate in SD - mmeH: expected message execution rate in IOD CD IOD
  • 13.
    13/24 Constructing OBDG andOSBDG (2/2) vSynthesizing OBDGs into OSBDG
  • 14.
    14/24 Where we arenow vModel-based change-proneness prediction Deriving all the Reachable Paths for all object-pair Synthesizing OBDGs into Object System Behavioral Dependency Graph Constructing Object Behavioral Dependency Graph for each SD Predicting change-proneness Calculating Behavioral Dependency Measure for every class in the system Summing the number of weighted Reachable Paths for all class-pair Behavioral Dependency Measurement OBDGs OSBDG Reachable Path Set BDMs Sum of the weighted reachable paths
  • 15.
    15/24 Deriving Reachable Paths vDerivingall reachable paths for all pair of objects in the system using OSBDG An example of reachable path set from o1 and o3 : {ab, b’}
  • 16.
    16/24 Where we arenow vModel-based change-proneness prediction CD SD IOD Deriving all the Reachable Paths for all object-pair Synthesizing OBDGs into Object System Behavioral Dependency Graph Constructing Object Behavioral Dependency Graph for each SD Predicting change-proneness Calculating Behavioral Dependency Measure for every class in the system Summing the number of weighted Reachable Paths for all class-pair Behavioral Dependency Measurement OBDGs OSBDG Reachable Path Set BDMs Sum of the weighted reachable paths
  • 17.
    17/24 Calculating BDM (1/2) vSummingthe number of weighted reachable paths for all pair of classes in the system Ÿ DF(s) = 1/d - d: distance length which is the number of messages in the corresponding reachable paths Sender classes Receiver classes c1 c2 c3 c4 c5 c6 c1 0 0.9 0.5 0.67 0 0.2 c2 0 0 0.8 1.2 0.8 0 c3 0 0 0 0.8 0 0 c4 0 0 0 0 0 0 c5 0 0 0 0 0 0 c6 0 0 0 0 0 0 Since RPS(o2,o4) = {bc, d}, SumWRP(c1,c2) = (½ x 0.8 x 1) + (1 x 0.8 x 1)
  • 18.
    18/24 Calculating BDM (2/2) vCalculatingBDM for every class in the system Sender classes Receiver classes c1 c2 c3 c4 c5 c6 BDM(c) c1 0 0.9 0.5 0.67 0 0.2 2.27 c2 0 0 0.8 1.2 0.8 0 2.8 c3 0 0 0 0.8 0 0 0.8 c4 0 0 0 0 0 0 0 c5 0 0 0 0 0 0 0 c6 0 0 0 0 0 0 0 Therefore, the class c2 is likely to be changed most in the system.
  • 19.
    19/24 Case Study (1/4) vGoal §To show that BDM is the useful and additional explanatory variable for change-proneness prediction vExperiment Design § Make two multivariate regression models with different independent variable set • Only C&K metrics* vs. BDM in addition to C&K metrics § Compare goodness of the fit of those models * S. Chidamber, C. Kemerer, and C. MIT. A metrics suite for object oriented design. IEEE Transactions on Software Engineering, 20(6) : 476–493, 1994.
  • 20.
    20/24 Case Study (2/4) vStudiedEnvironment § Input model: JFreeChart • Is an open-source Java class library for generating various types of charts • Reversed codes (ver. 1.0.0) into UML models – IOD is not applicable – CD is generated from RSA 7.0 – SD is constructed based on successive synchronous calls (i.e., reachable paths) SD reversed from the successive synchronous calls existed in JFreeChart source codes
  • 21.
    21/24 Case Study (3/4) vStudiedEnvironment (Cont’d) § Tool: BADAMO (BehAvioral Dependency Analyzer of UML MOdels) • Calculates the BDM • Is implemented based on EMF (Eclipse Modeling Framework) • Imports UML 2.0 models in the format of XMI generated from RSA (Rational Software Architect) 7.0 § Method for building prediction model: stepwise multiple regression • Dependent variable: change-proneness – Total amount of changes (source lines of code added and deleted) across the six releases (v.1.0.1 ~ 1.0.6) • Independent variables – C&K metrics (NOC, DIT, WMC, RFC, CBO, LCOM) and BDM
  • 22.
    22/24 Case Study (4/4) vResults §Models with only C&K metrics • Explains around 56% (adjusted R2 of 0.55) • Selected variables – WMC (1st), CBO (2nd), and LCOM (3rd) § Model with BDM in addition to C&K metrics • Explains around 64% (adjusted R2 of 0.64) • Selected variables – WMC (1st), BDM (2nd), CBO (3rd), LCOM (4th), and NOC (5th) R2 is increased by 9 percent or 20 percent of the unexplained variance using BDM.
  • 23.
    23/24 Conclusion vModel-based change-proneness predictionusing BDM § Help to redesign the change-prone classes easily • Make a stable software • Reduce the development cost of software § Can be used to visualize the problematic spots • Improve understandability of software
  • 24.
    24/24 Future Work vExtend BDMto take into account other dependencies § Time, etc. vInvestigate other applications of BDM § Fault-proneness prediction, object allocation in a distributed system, etc. vVisualize change-prone classes on the modeling tools § Rational Rose, ArgoUML, RSA (Rational Software Architect), etc.
  • 25.
    ⓒ KAIST SELAB 2008