This document compares the performance of support vector machine (SVM) and gene expression programming (GEP) models for estimating suspended sediment levels in the Kashkan River in Iran. Daily flow discharge and sediment data from 1998-2018 were used to train and validate the models. The SVM model had the highest correlation coefficient (0.994), lowest root mean square error (0.001 ton/day), lowest mean absolute error (0.001 ton/day), and highest Nash-Sutcliffe coefficient (0.988) indicating it best estimated sediment levels compared to the GEP model. The SVM model also showed great ability to estimate minimum and maximum sediment levels.
Developing best practice for infilling daily river flow datahydrologywebsite1
This document evaluates techniques for infilling missing daily river flow data. It assesses 10 techniques using data from 25 UK river gauging stations with missing values. The techniques include regression, scaling, and equipercentile methods. Results show that the equipercentile and multiple regression approaches performed best overall based on Nash-Sutcliffe Model Efficiency and percent bias statistics. Case studies provide further insight and an example infilling is presented. The results demonstrate the potential for developing standardized infilling methodologies to improve data completeness.
This document describes the development of a groundwater-based methodology for calibrating a hydrological model (PRMS) using automatic parameter optimization (MMS) and its application to a semi-arid basin in Cyprus. Groundwater data was used for calibration instead of surface runoff data, which is often unavailable in semi-arid areas. The methodology combined automatic optimization with heuristic expert intervention to calibrate PRMS and achieve good model performance, including low simulation error and good reproduction of measured groundwater levels over time.
Sewer systems are used to convey sewage and/or storm water to sewage treatment
plants for disposal by a network of buried sewer pipes, gutters, manholes and pits.
Unfortunately, the sewer pipe deteriorates with time leading to the collapsing of the
pipe with traffic disruption or clogging of the pipe causing flooding and
environmental pollution. Thus, the management and maintenance of the buried pipes
are important tasks that require information about the changes of the current and
future sewer pipes conditions. In this research, the study was carried on in Baghdad,
Iraq and two deteriorations model’s multinomial logistic regression and neural
network deterioration model NNDM are used to predict sewers future conditions. The
results of the deterioration models' application showed that NNDM gave the highest
overall prediction efficiency of 93.6% by adapting the confusion matrix test, while
multinomial logistic regression was inconsistent with the data. The error in prediction
of related model was due to its inability to reflect the dependent variable (condition
classes) ordered nature.
Fitting Probability Distribution Functions To Discharge Variability Of Kaduna...IJMER
International Journal of Modern Engineering Research (IJMER) is Peer reviewed, online Journal. It serves as an international archival forum of scholarly research related to engineering and science education.
This document summarizes a study that determined coefficients for the nonlinear Muskingum model of flood routing using genetic algorithms and numerical solutions of continuity equations. The researchers optimized the coefficients using genetic algorithms to increase computation speed compared to conventional methods. They then computed outflows using the optimized coefficients and by solving continuity equations with the Runge-Kutta method. Results showed the Runge-Kutta method produced hydrographs that more closely matched actual flows compared to the Muskingum and Muskingum-Cunge models.
1. The document compares the actual irrigation releases from the Isapur reservoir in India to the optimal irrigation releases calculated using a yield model.
2. The yield model is a linear programming model that maximizes reservoir yield based on constraints including storage continuity, reservoir capacity, and evaporation losses.
3. Parameters for the Isapur reservoir system including historic inflows, irrigation demands over time, and evaporation rates are presented to serve as inputs to the yield model.
Approaches for obtaining design flood peak discharges in sarada riverIAEME Publication
1. The document analyzes flood frequency in the Sarada River in India using peak discharge data from 2000-2013.
2. It finds that the Weibull 3 distribution best theoretically represents the data and the Gamma 3 distribution best empirically represents the data based on probability and quantile graphs.
3. The analysis concludes that the maximum recorded discharge of 2548.07 m3/s in 2012 can be used for flood protection and infrastructure design with a 2-year recurrence interval.
This document summarizes a study that estimated greenhouse gas emissions from daily commutes to Radford University. The study:
1) Mapped addresses for 1,945 faculty, staff, and students to determine commute distances using GIS software.
2) Calculated total annual miles driven and average daily commutes for each group.
3) Estimated total annual gasoline usage and resulting carbon dioxide emissions based on vehicle types and fuel efficiencies.
The study found a total of 12.5 million miles and 353,000 gallons of gasoline were used for commuting each year, emitting over 3,100 metric tons of carbon dioxide. Student commuters contributed the most emissions.
Best Fit and Selection of Probability Distribution Models for Frequency Analy...IJERD Editor
Frequency analysis of extreme low mean annual rainfall events is important to water resource planners at catchment level because mean annual rainfall is an important parameter in determining mean annual runoff. Mean annual runoff is an important input in determining surface water available for water resource infrastructure development. In order to carry out frequency analysis of extreme low mean annual rainfall events, it is necessary to identify the best fit probability distribution models (PDMs) for the frequency analysis. The primary objective of the study was to develop two model identification criteria. The first criterion was developed to identify candidate probability distribution models from which the best fit probability distribution models were identified. The second criterion was applied to select the best fit probability distribution models from the candidate models. The secondary objectives were:
1. manoj ecosystem services apafri workshop on forest hydrologymanojkumarnandan
This document proposes a meta-modeling framework to assess the water regulatory services provided by forests in Uttarakhand, India. It involves developing a simulation model called SMUFH to model forest hydrology processes and quantify services under different forest cover scenarios. Experimental data on forest hydrology would be collected and used to parameterize and validate the SMUFH model. The model would then simulate changes in hydrological outputs like soil moisture and groundwater recharge for varying levels of forest cover to estimate economic value of water regulation services. The framework is meant to provide a scientific basis for assessing impacts of forest management practices on hydrological regime.
This document summarizes a study that used multivariate statistical analysis to assess water quality in the Chamera-I reservoir in India over a two-year period from 2010-2012. Water quality parameters were measured seasonally and subjected to cluster analysis, principal component analysis, and correlation and regression analysis. Cluster analysis identified two major clusters separating the rainy season from the other three seasons. Principal component analysis selected three variables accounting for 100% of the total variance in water quality over time. Correlation analysis identified significant linear relationships between various water quality parameters.
This document describes a methodology for real-time reservoir operation of the Hirakud reservoir in India. The goal is to minimize penalties from deviating from recommended reservoir levels, flows exceeding safe limits downstream, and changes in release rates. The operation will be done in two phases - a calibration phase to determine penalty parameters, and a validation phase. Three historic floods will be used in the calibration phase to evaluate different penalty structures and select the best-performing set of penalties based on reservoir levels, downstream flows, and duration of flood operation.
DETERMINATION OF NET FLOWS INTO ALMATTI RESERVOIR FROM CWC GAUGE DATA AND RES...IAEME Publication
This paper presents the determination of net flows into Almatti reservoir from CWC data and reservoir data. From the study it can be concluded that the average flow in to Almatti will be 574.86 TMC, the maximum inflow will be 1196.8 TMC and the minimum flow will be 166.99 TMC. The flows in annual in deficit years may reduce by about 50 TMC but there is no variation in the good years in the good years as the storage effects will take care of this aspect during good years. It can be concluded that there will be reduction of flows in the June and July flows in the ultimate scenario except in very good years.
Application of Source Water Quantity and Quality Model to Dongshan PeninsulaeWater
Lake Tai is the third largest freshwater lake in China, bordering Jiangsu and Zhejiang provinces,
providing water to 30 million residents. A severe algal bloom in 2007 led to the development of the
Lake Tai Master Plan, launched by the National Development and Reform Commission (NDRC), to
improve nutrient management in the basin. Under a joint Australian China Environmental
Development Project, the Australian eWater Source Integrated Modelling System (IMS) was applied
to model water quantity and quality for a pilot area on the Dongshan Peninsula in the Lake Tai Basin.
Source is a powerful modelling platform for environmental management which can integrate many
physical processes and human impacts, successfully applied in over 70 basins across Australia.
Review of performance evaluation of canal irrigation systemRonak Patel
This document reviews various approaches that researchers have used to evaluate the performance of canal irrigation systems in India and worldwide. It discusses 12 studies that used indicators, remote sensing, hydrological models, or other methods to assess irrigation system efficiency, uniformity, productivity, and other metrics. The studies examined irrigation projects and canal systems in various locations and identified technical, financial, and other factors that affected performance. The review indicates that evaluating irrigation systems through performance indicators and other methods can provide insights on constraints and improvement opportunities.
This document summarizes a research study that investigated how modifications to a river's physical specifications, like width and length, impact the coefficients of the Muskingum flood routing model. The researchers used a genetic algorithm to compute the nonlinear Muskingum model coefficients after altering the river width and length in their schematic model. They found a logical relationship between changes in the river characteristics and the model coefficients. The goal was to determine if a mathematical relationship could be derived to express how modifications to the physical properties affect the coefficients.
Šantl et al_2015_Hydropower Suitability Analysis on a Large ScaleSašo Šantl
This document presents a method for analyzing the suitability of watercourses for hydropower use on a large scale. The method is based on multi-criteria analysis and includes the following key stages:
1. Determining decision options, criteria, and utility functions. Watercourse segments are the decision options, and criteria related to hydropower attractiveness and ecological value are selected.
2. Selecting calibration and confirmation data. Watercourse segments agreed to be suitable/unsuitable are used for calibration and confirmation of the model.
3. Calibrating model parameters. Weights of criteria and thresholds in utility functions are calibrated to maximize distances between ideal and anti-ideal calibration options.
The method was tested
This document discusses statistical analysis to identify the main parameters affecting wastewater quality index (WWQI) at sewage treatment plants and to predict biochemical oxygen demand (BOD). It presents a fuzzy multi-criteria decision making model to calculate WWQI based on eight wastewater parameters. Correlation analysis identified parameters like total dissolved solids, BOD, chemical oxygen demand as significantly correlated with WWQI. Regression analysis developed an equation to estimate WWQI and BOD from dissolved oxygen measurements. The study shows WWQI is influenced most by BOD, COD, suspended solids and total dissolved solids.
This document lists publications and thesis summaries by Hany G. Radwan related to improving irrigation systems in Egypt. It includes 20 publications from 2013 back to 2009 on topics like water distribution, head loss equations, and reduced water flow from dams. It also summarizes a PhD thesis on designing an integrated improved farm irrigation system in Egypt and an MSc thesis on developing an analytical program to solve equations for wells penetrating aquifers.
The document discusses water quality monitoring networks and mandates in India. It describes the Hydrological Information System (HIS) being set up under the Hydrology Project to coordinate water quality data collection. It identifies the major water quality issues affecting rivers, groundwater, and lakes/reservoirs. Finally, it provides an example of rationalizing the monitoring program for the Cauvery River through establishing objectives and assessing the existing network. The goal is to improve coordination between organizations and optimize limited monitoring resources.
The study examined the characteristics of the Sumanpa stream’s Flow-Duration-Frequency Curve statistics for a period of 25years (1985-2009) and compared the 1990-1999 and 2000-2009 Flow-Duration-Curves. The high, low and mean Flow-Duration-Curves were also analysed. The discharge records were analysed to develop a general quantitative characterization of the stream’s flow variability. Streamflow data was generated from daily stage data using the rating curve model developed at the stream’s gauge station. Flow-Duration-Frequency-Curves were developed using the Weibull plotting position and used to analyse the catchment’s surface and groundwater storage and stream’s flow characteristics. The approach placed the midpoints of the moist, mid-range, and dry zones of the curves at 25th, 50th, and 75th percentiles, respectively. The high zone was centered at the 5th percentile, while the low zone was centered at the 95th percentile. For 95% of the time, the streamflowequalled or exceeded 0.14 m3s-1, at 5% it equalled or exceeded 45 m3s-1 and at 50% flow equalled or exceeded 5.53 m3s-1.
Suspended Sediment Rating Curve for Tigris River Upstream Al- Betera RegulatorIJRES Journal
This document presents a study that establishes suspended sediment rating curves for a section of the Tigris River located upstream of the Al-Betera regulator in Maysan province, Iraq. Thirty-five data points measuring river discharge and calculated suspended sediment concentration using an ADCP were collected. A power function relationship between discharge and suspended sediment concentration was determined, with high correlation. The rating curves can be used to estimate suspended sediment loads transported in the river reach and improved with additional data.
The document discusses regional flood frequency analysis utilizing L-moments for the Narmada River Basin in India. It presents the methodology used, which includes calculating L-moments for annual peak flood data from 16 gauging sites in the basin to determine regional L-moment ratios. These ratios are used to estimate parameters of the Generalized Extreme Value distribution and develop a regional flood frequency relationship for the basin. Finally, a regional flood formula is created to estimate flood values at different return periods for ungauged sites based on catchment area.
International journal of engineering issues vol 2015 - no 2 - paper3sophiabelthome
This document discusses rainfall frequency analysis using L-moments of probability distributions. It analyzes annual maximum daily rainfall data from two locations in India - Narwar and Banswara. It fits three probability distributions to the data - Gumbel, Frechet, and Generalized Extreme Value - using the method of L-moments. It evaluates the fit of the distributions using goodness-of-fit tests and a diagnostic test. The tests show that the Gumbel distribution best fits the Narwar data, while the Generalized Extreme Value distribution best fits the Banswara data.
Runoff Prediction of Gharni River Catchment of Maharashtra by Regressional An...ijtsrd
The present study deals with the prediction of runoff of a river catchment of maharastra by using linear regressional analysis and self organizing maps by handling numerical data. The prediction is done by using past data record. A mathematical model has been developed for rainfall runoff correlation. Warish Khan | Adil Masood | Najib Hasan"Runoff Prediction of Gharni River Catchment of Maharashtra by Regressional Analysis and Ann Tool Box" Published in International Journal of Trend in Scientific Research and Development (ijtsrd), ISSN: 2456-6470, Volume-2 | Issue-1 , December 2017, URL: http://www.ijtsrd.com/papers/ijtsrd7025.pdf http://www.ijtsrd.com/engineering/civil-engineering/7025/runoff-prediction-of-gharni-river-catchment-of-maharashtra-by-regressional-analysis-and-ann-tool-box/warish-khan
APPLICATION OF GENE EXPRESSION PROGRAMMING IN FLOOD FREQUENCY ANALYSISMohd Danish
This document discusses different methods for flood frequency analysis, including Gumbel's method, artificial neural networks (ANN), and gene expression programming (GEP). Gumbel's method is widely used in India to predict flood peaks. ANN and GEP are artificial intelligence techniques that have been applied to hydraulic engineering problems in recent decades. The document focuses on applying GEP to flood frequency analysis of the Ganga River at Hardwar, India. GEP is implemented to derive a relationship between peak flood discharge and return period. The results of GEP are promising and suggest it is a useful alternative to more conventional flood frequency analysis methods.
IJERD (www.ijerd.com) International Journal of Engineering Research and Devel...IJERD Editor
This document summarizes a study that used Support Vector Regression (SVR) and M5 Model Trees (MT) to forecast stream flow at two locations in India. At the first location in the Narmada River basin, 36 models were developed to forecast stream flow for each of the months of July, August, September and October using different combinations of previous stream flow and rainfall values as inputs. At the second location in the Krishna River basin, 27 models were developed for July, August and September. The models were evaluated based on correlation coefficient, root mean square error, and coefficient of efficiency. The results showed that the SVR models performed better than the MT models, but adding rainfall inputs did not consistently improve accuracy for either
Assessment of two Methods to study Precipitation PredictionAI Publications
Presipitation analysis plays an important role in hydrological studies. In this study, using 50 years of rainfall data and ARIMA model, critical areas of Iran were determined. For this purpose, annual rainfall data of 112 different synoptic stations in Iran were gathered. To summarize, it could be concluded that: ARIMA model was an appropriate tool to forecast annual rainfall. According to obtained results from relative error, five stations were in critical condition. At 45 stations accrued rainfalls with amounts of less than half of average in the 50-year period. Therefore, in these 45 areas, chance of drought is more than other areas of Iran.
This document summarizes a research paper that uses explicit stochastic dynamic programming to determine optimal long-term reservoir operation policies under uncertainty. It begins by introducing reservoir operation as a multistage dynamic stochastic control process and describes how stochastic dynamic programming can account for uncertainties. It then reviews relevant literature on applying stochastic dynamic programming to single and multi-reservoir systems. The document proceeds to describe the DV reservoir system in India that is used as a case study. It provides storage capacities and operational details. Finally, it outlines the stochastic dynamic programming formulation, including the system dynamics, objective function, transition probabilities, and recursive equations used to solve for the optimal policy.
The document compares the use of artificial neural networks and sediment rating curve models for estimating suspended sediment in the Lokapavani River basin in India. It finds that an artificial neural network using multilayer perceptron with water discharge, accumulated discharge, and accumulated rainfall as inputs achieved an R2 value of 0.88 for estimating suspended sediment, outperforming a sediment rating curve model which achieved an R2 of 0.846. However, the artificial neural network was not as accurate at estimating peak sediment values. Overall, the study found artificial neural networks to be an acceptable method for suspended sediment estimation in this basin, though they have limitations in predicting peaks.
Application of Support Vector Machine for River flow EstimationAI Publications
In recent years application of intelligent methods has been considered in forecasting hydrologic processes. In this research, month river discharge of kakareza, a river located in lorestan province at the west of Iran, was forecasted using Support vector machine and as genetic programming Inference System methods in dehno stations. In this regard, some different combinations in the period (1979-2015) as input data for estimation of discharge in the month index were evaluated. Criteria of correlation coefficient, root mean square error and Nash Sutcliff coefficient to evaluate and compare the performance of methods were used. It showed that combined structure by using surveyed inelegant methods, resulted to an acceptable estimation of discharge to the kakareza river. In addition comparison between models shows that Support vector machine has a better performance than other models in inflow estimation. In terms of accuracy, Support vector machine with correlation coefficients ( 0.970 ) has more propriety than root mean square error (0.08m3 /s ) and Nash Sutcliff ( 0.94 ) . To sum up, it is mentioned that Support vector machine method has a better capability to estimate the minimum, maximum and other flow values.
EFFICACY OF NEURAL NETWORK IN RAINFALL-RUNOFF MODELLING OF BAGMATI RIVER BASINIAEME Publication
In this paper, rainfall-runoff model of Bagmati river basin has been developed
using the ANN Technique. Three-layered fced forward network structure with back
propagation algorithm was used to train the ANN model. Different combinations of
rainfall and runoff were considered as input to the network and trained by BP
algorithm with different error tolerance, learning parameter, number of cycles and
number of hidden layers. The sensitivity of the prediction accuracy to the number of
hidden layer neurons in a back error propagation algorithm was used for the study.
The monthly rainfall and runoff data from 2000 to 2009 of Bagmati river basin has
been considered for the development of ANN model. Performance evaluation of the
model has been done by using statistical parameters. Three sets of data have been
used to make several combination of year keeping in view the highest peaks of
hydrographs. First set of data used was from 2000 to 2006 for the calibration and
from 2007 to 2009 for validation. The second set of data was from 2004 to 2009 for
calibration and from 2000 to 2003 for validation. The Third set of data was from 2000
to 2009 for calibration and from 2007 to 2009 for validation. It was found that the
third set of data gave better result than other two sets of data. The study demonstrates
the applicability of ANN approach in developing effective non-linear models of
Rainfall-Runoff process without the need to explicitly representing the internal
hydraulic structure of the watershed
DEM GENERATION AND RIVER ANALYSIS USING HEC-RAS MODEL, HARIDWAR DISTRICT, UTT...IRJET Journal
This document summarizes a study that used HEC-RAS modeling to analyze river flow in the Ganga River in Haridwar District, Uttarakhand, India. A 30m DEM was downloaded and clipped to the area of interest. The DEM was converted to a TIN in ArcGIS and cross-sections, streamlines, and other data were created. This data was exported to HEC-RAS to build the hydraulic model. Simulations were run to generate water surface profiles. The results found the quality of the DEM input is important for flood modeling accuracy. The methodology can be applied to other river systems globally to examine topography data impacts on flood modeling.
A two-dimensional mathematical, model is developed to simulate the flow regime,
of the upper part of Dibdibba Formation. The proposed, conceptual model, which is
advocated to simulate the flow regime of aquifer is fixed for one layer, i.e. the activity
of the deeper aquifer is negligible. The model is calibrated using, trial and error
method. According to the calibration process, the hydraulic characteristics of the
upper aquifer has been identified the hydraulic conductivity in the study area ranged
(60-200) m/day while the specific, yield ranges, between, (0.08- 0.45).In this research,
the obtaining of the optimum management of groundwater flow by linked simulationoptimization
model. MODFLOW packages are used to simulate the flow in the system
of groundwater. This model is completed with an optimization model which is
depending on the Genetic Algorithm (GA) and Tabu Search (TS). Two management
cases (fixed well location and flexible well location with the moving, well option)
were considered by executing the model with adopting calibratedparameters. In the,
first case the objective function is converged to a maximum value of (3.35E+5 m3/day)
by using GA, while this function is closed to 4.00E+5 m3/day by using TS. The
objective function in second case converges to the maximum value (7.64E+05m3/day)
and (8.25E+05m3/day) when using GA and TS respectively. The choice option for the
optimal location of the wells in the second case leads to an increase of 106%
HYDROLOGICAL AND WATER QUALITY MODELLING USING SWAT FOR DONI RIVERIRJET Journal
This document describes using the Soil and Water Assessment Tool (SWAT) model to simulate hydrological and water quality parameters of the Doni River Basin in India over a 20-year period from 1998-2018. The key points are:
- The basin was divided into 7 sub-basins and 15 hydrologic response units. Land use is mainly agricultural (over 85% coverage).
- Model calibration and validation at a gauging site showed good performance, with Nash-Sutcliffe Efficiency values of 0.71 for calibration and 0.78 for validation.
- Modeling results found average annual evapotranspiration of 195 mm and potential evapotranspiration of 402mm. Sediment yield
This master's thesis presents a decision support system (DSS) to support integrated irrigation and groundwater management in Punjab, Pakistan. The DSS contains a database and modeling components. It estimates evapotranspiration, effective precipitation, groundwater recharge and abstraction on a monthly basis. A groundwater flow model simulates groundwater levels under different cropping and irrigation scenarios. The DSS helps achieve scenario goals and confirms decreasing water levels vary spatially. A cropping pattern with cotton, fodder and wheat, fodder is suitable to improve the current situation.
This document presents a seminar on improving flood forecasting in India. It discusses types of floods and their causes and impacts. It then covers current methods of flood forecasting, including deterministic models, data-driven models, and ensemble forecasts. Past efforts in India are reviewed through case studies applying models like ANN to rivers. Challenges are outlined such as limited data availability. The document concludes more investment is needed in India to develop efficient forecasting systems with longer lead times to better protect lives from flooding.
Review Paper for floodplain mapping with applications of HEC-HMS, HEC-RAS and...IRJET Journal
This document reviews previous research on floodplain mapping that utilized various software tools and methods. It categorizes the previous studies into three categories: flood frequency analysis methods, digital elevation models used, and software tools applied. Several studies are summarized that used different combinations of tools like HEC-HMS, HEC-RAS, and ArcGIS to model floodplains and generate inundation maps. The document provides these summaries to help new users understand which approaches have been effective for floodplain mapping.
Application of artificial neural network in metropolitan landscapeIAEME Publication
This document describes the application of an artificial neural network (ANN) to assess water quality in an urban landscape river. Specifically:
- An ANN using backpropagation was developed to create a water quality assessment model, using data from water quality monitoring at 6 sites on the landscape river.
- The ANN was trained on 4 water quality indicators (DO, NH3-N, TN, TP) using 5 water quality grades as targets, to classify new data and estimate water quality.
- The trained ANN was then used to assess the water quality at the 6 sites based on their average pollutant levels, classifying most sites as grade II or III quality.
ASSESSMENT OF LP AND GA AS RESERVOIR SYSTEM ANALYSIS TOOLSIAEME Publication
A reservoir is a huge manmade structure constructed for a number of reasons. It
uses natural water resources and helps in the development of a society. The quantum
of water in a reservoir is a function of the hydrologic characteristics of the region. An
efficient planning and operation of a reservoir is a skill of the water planner. The
works done by researchers in the system analysis of a reservoir are discussed in the
present paper. The most appreciated linear programming (LP) and genetic algorithm
(GA) are studied in the context of system analysis of Urmodi Reservoir in
Maharashtra, India. The objective function is set to minimize the sum of the squared
irrigation demand deficit. Results show that these tools seem to be versatile in nature
and efficiently adopted for reservoir operation purpose.
Application of mathematical modelling in rainfall forcast a csae study in...eSAT Journals
Abstract Malaysia receives rainfall from 2000 mm to 4000 mm annually where it is greatly influenced by two monsoon periods in November to March and May to September. The state of Sarawak is well known for its long and wide rivers. Numerous activities such as commercial, industrial and residential can always be found in the vicinity of the rivers. The activities have started since decades ago and still continue to grow and spatially expanding through times providing incomes ranging from small farmers to the largest corporations. Unfortunately, these areas are expected to experience frequent flood events as well as possible receding water level in rivers based on the findings of previous studies. If the projections are accurate, the productivity of these activities will be reduced, hence, in a longer term may affect the economy of the state as whole as well. Therefore, there is an urgent need for existing knowledge on rainfall behavior to be revised as effects of climate change with the intention that the state can fully utilize the favorable conditions and make scientific based decisions in the future. Recent study reveals that the Fourier series (FS), has the ability to simulate long-term rainfall up to 300 years is viewed as an important finding in the study of rainfall forecast. Long-term rainfall forecasting is viewed to be beneficial to the state of Sarawak in its future planning in various sectors such as water supply, flood mitigation, river transportation as well as agriculture. The main goal of the study is to apply a mathematical modeling in rainfall forecasting for the Sungai Sarawak basin. Data from eight rain gauge stations was analyzed and prepared for missing data, consistency check and adequacy of number of stations. Simple statistical analysis was conducted on the data such as maximum, minimum, mean and standard deviation. 27 years of annual rainfall data were simulated with the Fourier Series equation using spreadsheet. Hence, the result was compared with the Fitting N-term Harmonic Series. The model result reveals that the Fourier Series has the ability to simulate the observed data by being able to describe the rainfall pattern and there is a reasonable relationship between the simulation and observed data with p-value of 0.93. Keywords: Fourier series, Mathematical
The Development of a Catchment Management Modelling System for the Googong Re...GavanThomas
A scenario assessment model to assist the end-user in determining priorities for a series of agreed management prescriptions that can be enacted through controls on existing landuse
International Journal of Engineering and Science Invention (IJESI) is an international journal intended for professionals and researchers in all fields of computer science and electronics. IJESI publishes research articles and reviews within the whole field Engineering Science and Technology, new teaching methods, assessment, validation and the impact of new technologies and it will continue to provide information on the latest trends and developments in this ever-expanding subject. The publications of papers are selected through double peer reviewed to ensure originality, relevance, and readability. The articles published in our journal can be accessed online.
Similar to Comparison and Evaluation of Support Vector Machine and Gene Programming in River Suspended Sediment Estimation (Case Study: Kashkan River) (20)
The Statutory Interpretation of Renewable Energy Based on Syllogism of Britis...AI Publications
The current production for energy consumption generates harmful impacts of carbon dioxide to the environment causing instability to sustainable development goals. The constitutional reforms of British Government serve to be an important means of resolving any encountered incompatibilities to political environment. This study aims to evaluate green economy using developed equation for renewable energy towards political polarization of corporate governance. The Kano Model Assessment is used to measure the equivalency of 1970 Patents Act to UK Intellectual Property tabulating the criteria for the fulfillment of sustainable development goals in respect to the environment, artificial intelligence, and dynamic dichotomy of administrative agencies and presidential restriction, as statutory interpretation development to renewable energy. The constitutional forms of British government satisfy the sustainable development goals needed to fight climate change, advocate healthy ecosystem, promote leadership of magnates, and delegate responsibilities towards green economy. The presidential partisanship must be observed to delineate parties of concerns and execute the government prescriptions in equivalence to the dichotomous relationship of technology and the environment in fulfilling the rights and privileges of all citizens. Hence, the political elites can execute corporate governance towards sustainable development of renewable energy promoting environmental parks and zero emission target of carbon dioxide discharges. The economic theory developed in statutory interpretation for renewable energy serves as a tool to reduce detrimental impacts of carbon dioxide to the environment, mitigate climate change, and produce artefacts of bioenergy and artificial intelligence promoting sustainable development. It is suggested to explore other vulnerabilities of artificial intelligence to prosper economic success.
Enhancement of Aqueous Solubility of Piroxicam Using Solvent Deposition SystemAI Publications
Piroxicam is a non-steroidal anti-inflammatory drug that is characterized by low solubility-high permeability. The present study was designed to improve the dissolution rate of piroxicam at the physiological pH's through its increased solubility by using solvent deposition system.
Analysis of Value Chain of Cow Milk: The Case of Itang Special Woreda, Gambel...AI Publications
Ethiopia has a long and rich history of dairy farming, which was mostly carried out by small and marginal farmers who raised cattle, camels, goats, and sheep, among other species, for milk. Finding the Itang Special Woreda cow milk value chain is the study's main goal. In order to gather primary data, 204 smallholder dairy farmer households were randomly selected, and the market concentration ratio was calculated using 20 traders. Descriptive statistics, econometric models, and rank analysis were used to achieve the above specified goals. Out of all the participants in the milk value chain, producers, cafés, hotels, and dairy cooperatives had the largest gross marketing margins, accounting for 100% of the consumer price in channels I and II, 55% in channels III and V, and 25.5% in channels V. The number of children under five, the number of milking cows owned, the amount of money from non-dairy sources, the frequency of extension service contacts, the amount of milk produced each day, and the availability of market information were found to have an impact on smallholders' involvement in the milk market. Numerous obstacles also limited the amount of milk produced and marketed. The poll claims that general health issues, sickness, predators, and a lack of veterinary care are plaguing farmers. In order to address the issue of milk perishability, the researchers recommended the host community and organization to construct an agro milk processor, renovate the dairy cooperative in the study region, and restructure the current conventional marketing to lower the transaction and cost of milk marketing.
Minds and Machines: Impact of Emotional Intelligence on Investment Decisions ...AI Publications
In the evolving landscape of financial decision-making, this study delves into the intricate relationships among Emotional Intelligence (EI), Artificial Intelligence (AI), and Investment Decisions (ID). By scrutinizing the direct influence of human emotional intelligence on investment choices and elucidating the mediating role of AI in this process, our research seeks to unravel the complex interplay between minds and machines. Through empirical analysis, we reveal that EI not only directly impacts ID but also exerts its influence indirectly through AI-mediated pathways. The findings underscore the pivotal role of emotional awareness in investor decision-making, augmented by the technological capabilities of AI. It suggests that most investors are influenced by the identified emotional intelligence when making investment decisions. Furthermore, AI substantially impacts investors' decision-making process when it comes to investing; nevertheless, AI partially mediates the relationship between emotional intelligence and investment decisions. This nuanced understanding provides valuable insights for financial practitioners, policymakers, and researchers, emphasizing the need for holistic strategies that integrate emotional and technological dimensions in navigating the intricacies of modern investment landscapes. As the synergy between human intuition and artificial intelligence becomes increasingly integral to financial decision-making, this study contributes to the ongoing discourse on the symbiotic relationship between minds and machines in investments.0
Bronchopulmonary cancers are common cancers with a poor prognosis. It is the leading cause of death by cancer in Algeria and in the world. Behind this unfavorable prognosis hides numerous disparities according to age, sex, and exposure to risk factors, ranking 4th among incident cancers and developing countries including Algeria, all sexes combined. It ranks 2nd cancers in men and 3rd among women. Whatever the age observed, the incidence of this cancer is higher in men than in women, however the gap is narrowing to the detriment of the latter. The results of scientific research agree to relate trends in incidence and mortality rates to tobacco consumption, including passive smoking. Furthermore, other risk factors are mentioned such as exposure to asbestos in the workplace or to radon for the general population, or even genetic predisposition. However, the weight of these etiological and/or predisposing factors is in no way comparable to that of tobacco in the genesis of lung cancer and the resulting mortality. We provide a literature review in our article on the descriptive and analytical epidemiology of lung cancer.
Further analysis on Organic agriculture and organic farming in case of Thaila...AI Publications
The objective of this paper is to present Further analysis on Organic agriculture and organic farming in case of Thailand agriculture and enhancing farmer productivity. In view of the demand for organic fertilizers, efforts should also be made to enhance and to develop more effective of compost, bio-fertilizer, and bio-pesticides currently used by farmers. Likewise, emphasis should also be laid on the cultivation of legumes and other crops that can enhance the fertility of the soil, as practiced by farmers in many developing countries to fertilize their lands. On the other hand, most of the farmers who practice this farm system found that they are adopting a number of SLMs and interested in joining the meeting or training to gain more and more knowledge.
Current Changes in the Role of Agriculture and Agri-Farming Structures in Tha...AI Publications
The objective os this study is to present Current Changes in the Role of Agriculture and Agri-Farming Structures in Thailand and Vietnam with SLM practices. Farmer’s adoption and investment in SLM is a key for controlling land degradation, enhancing the well-being of society, and ensuring the optimal use of land resources for the benefit of present and future generations (World Bank, 2006; FAO, 2018). And agriculture remains an essential element of lives of many farmers in term of the strong cultural and symbolic values that attach current working generation to do and to spend time for it but not intern of income generating.
Growth, Yield and Economic Advantage of Onion (Allium cepa L.) Varieties in R...AI Publications
Haphazard and low soil fertility, low yielding verities and poor agronomic practices are among the major factors constraining onion production in the central rift valley of Ethiopia. Therefore, a field experiment was conducted in East Showa Zone of Adami Tulu Jido Combolcha district in central rift valley areas at ziway from October 2021 to April 2022 to identify appropriate rate of NPSB fertilizer and planting pattern of onion varieties. The experiment was laid out in split plot design of factorial arrangement in three replications. The main effect of NPSB blended fertilizer rates and varieties (red coach and red king) significantly (p<0.01) influenced plant height, leaf length, leaf diameter, leaf number and fresh leaf weight, shoot dry matter per plant, and harvest index. Total dry biomass, bulb diameter, neck diameter, average fresh bulb weight, bulb dry matter, marketable bulb yield, and total bulb yield were significantly (p<0.01) influenced only by the main effect of NPSB blended fertilizer rates. In addition, unmarketable bulb yield was statistically significantly affected (p≥0.05) by the blended fertilizer rates and planting pattern. Moreover, days to 90% maturity of onion was affected by the main factor of NPSB fertilizer rate, variety and planting pattern. The non-fertilized plants in the control treatment were inferior in all parameters except unmarketable bulb yield and harvest index. Significantly higher marketable bulb yield (41 t ha-1) and total bulb yield (41.33 t ha-1) was recorded from 300 kg ha-1 NPSB blended fertilizer rate applied. Double row planting method and hybrid red coach onion variety had also gave higher growth and yields. The study revealed that the highest net benefit of Birr, 878,894 with lest cost of Birr 148,006 by the combinations of 150 kg blended NPSB ha-1 with double row planting method (40cm*20cm*7cm) and red coach variety which can be recommendable for higher marketable bulb yield and economic return of hybrid onion for small scale farmers in the study area. Also, for resource full producers (investors), highest net benefit of Birr 1,205,372 with higher cost (159,628 Birr) by application of 300 kg NPSB ha-1 is recommended as a second option. However, the research should be replicated both in season and areas to more verify the recommendations.
Evaluation of In-vitro neuroprotective effect of Ethanolic extract of Canariu...AI Publications
The ethanolic extract of canarium solomonense leaves (ecsl) was studied for its neuroprotective activity. The neuroprotective activity of ECSL was found to have a significant impact on neuronal cell death triggered by hydrogen peroxide (MTT assay) in human SH-SY5Y neuroblastoma cells. Scopolamine, a muscarinic receptor blocker, is frequently used to induce cognitive impairment in laboratory animals. Injections of scopolamine influence multiple cognitive functions, including motor function, short-term memory, and attention. Using the Morris water maze, the Y maze, and the passive avoidance paradigm, memory enhancing activity in scopolamine-induced amnesic rats was evaluated. Using the Morris water maze, the Y maze, and the passive avoidance paradigm, ECSL was found to have a substantial effect on the memory of scopolamine- induced amnesic rats. Our experimental data indicated that ECSL can reverse scopolamine induced amnesia and assist with memory issues.
The goal of neuroprotection is to shield neurons against damage, whether that damage is caused by environmental factors, pathogens, or neurodegenerative illnesses. Inhibiting protein-based deposit buildup, oxidative stress, and neuroinflammation, as well as rectifying abnormalities of neurotransmitters like dopamine and acetylcholine, are some of the ways in which medicinal herbs have neuroprotective effects [1-3]. This review will focus on the ways in which medicinal herbs may protect neurons.
A phytochemical and pharmacological review on canarium solomonenseAI Publications
The genus Canarium L. consists of 75 species of aromatic trees which are found in the rainforests of tropical Asia, Africa and the Pacific. The medicinal uses, botany, chemical constituents and pharmacological activities are now reviewed. Various compounds are tabulated according to their classes their structures are given. Traditionally canarium solomonense have been used to treat a broad array of illnesses. Pharmacological actions for canarium solomonense as discussed in this review include antibacterial, antimicrobial, antioxidant, anti-inflammatory, hepatoprotective and antitumor activity.
Influences of Digital Marketing in the Buying Decisions of College Students i...AI Publications
This research investigates the influence of digital marketing channels on purchasing decisions among college students in Ramanathapuram District. The study highlights that social media marketing, online advertising, and mobile marketing exhibit substantial positive effects on purchase decisions. However, email marketing's impact appears to be more complex. Moreover, the study explores how demographic variables like gender and academic level shape these effects. Notably, freshman students display varying susceptibility to specific digital marketing messages compared to their junior, senior, or graduate counterparts. These findings offer crucial insights for marketers aiming to tailor their strategies effectively to the preferences and behaviors of college students. By understanding the differential impacts of various digital marketing channels and considering demographic nuances, marketers can refine their approaches, optimize engagement, and ultimately enhance the effectiveness of their campaigns in targeting this demographic.
A Study on Performance of the Karnataka State Cooperative Agriculture & Rural...AI Publications
The Karnataka State Co-operative Agriculture and Rural Development Bank Limited is the apex bank of all the primary co-operative agriculture and rural development banks in the state. All the PCARD Banks in the state are affiliated to it. The KSCARD Bank provides financial accommodation to the PCARD Banks for their lending operations. In order to quick sanction and disbursement of loans and supervision over the PCARD Banks the KSCARD Bank has opened district level branches. Bank has established Women Development Cell to promote entrepreneurship among women in 2005. The Bank is identifying women borrowers in the rural areas by assigning suitable projects to motivate their self-confidence to lead independent life. Progress made in financing women entrepreneurs women.
Breast hamartoma is a rare, well-circumscribed, benign lesion made up of a variable quantity of glandular, adipose and fibrous tissue. This is a lesion that can affect women at any age from puberty. With the increasingly frequent use of imaging methods such as mammography and ultrasound as well as breast biopsy, cases of hamartoma diagnosed are increasing. The diagnosis of these lesions is made by mammography. The histological and radiological aspects are variable and depend on its adipose tissue content. The identification of these lesions is important in order to avoid surgical excisions. We report radio-clinical and pathological records of breast hamartoma.
A retrospective study on ovarian cancer with a median follow-up of 36 months ...AI Publications
Ovarian cancer is relatively common but serious and has a poor prognosis. The aim of this study is to highlight the epidemiological, diagnostic, therapeutic and evolutionary aspects of this malignant pathology managed at the Bejaia university hospital center. This is a retrospective and descriptive study over a period of 3 years (2019 - 2022) carried out on 20 patients who developed ovarian cancer. The average age of the patients was 50 years old, 53.23% of whom were over 45 years old. The CA-125 blood test was positive in 18 out of 20 patients. The tumors were discovered on ultrasound in 87.10% of cases and at laparotomy in 12.90%. Total hysterectomy with bilateral adnexectomy was the most performed procedure (64.52%). The early postoperative course was simple. 15 patients underwent second look surgery (16.13%) for locoregional recurrences. Epithelial tumors were the most frequent histological type (93.55%), including 79% in the advanced stage ( IIIc -IV) and 21% in the early stage (Ia- Ib ). Adjuvant chemotherapy was administered in 80% of patients. With a median follow-up of 36 months, 2 patients were lost to follow-up. The evolution was favorable in 27.42% and in 25.81% deaths occurred late postoperatively. Ovarian cancer is not common but serious given the advanced stages and the high rate of late postoperative deaths which were largely observed in patients deprived of adequate neoadjuvant or adjuvant chemotherapy.
More analysis on environment protection and sustainable agriculture - A case ...AI Publications
This study presents a case of tea and coffee crops , esp. environment protection and sustainable agriculture in Son La and Thai Nguyen of Vietnam. Research results show us that The process of having an agricultural product goes through many steps such as planting, planning, harvesting, packing, transporting, storing and distributing. - The State adopts policies to encourage innovation of agricultural production models and methods towards sustainability, adapting to climate change, saving water, and limiting the use of inorganic fertilizers and pesticides. chemicals and products for environmental treatment in agriculture; develop environmentally friendly agricultural models. Our research limitation is that we can expand for other crops, industries and markets as well.
Assessment of Growth and Yield Performance of Twelve Different Rice Varieties...AI Publications
The present investigation entitled “Assessment of growth and yield performance of twelve different rice varieties under north Konkan coastal zone of Maharashtra” was carried out during the kharif season of the year 2021 and 2022 on the field of ASPEE, Agricultural Research and Development Foundation, Tansa Farm, At Nare, Taluka Wada, District Palghar, Maharashtra, India. The experiment was laid out in Randomized Block Design (RBD). The twelve varieties namely Zini, Jaya, Dandi, Rahghudya, Govindbhog, Dangi, Gurjari, VNR-7, VNR-8, VNR-9, Karjat-3, and Karjat-5 were replicated thrice. The plant height (cm), number of tillers per plant, number of panicles per plant, number of panicles (m²), and length of panicle (cm) were noted to the maximum with cv. “VNR-7”. The highest number of seeds per panicle, test weight (gm), grain yield (q/ha), and straw yield (q/ha) were recorded with the cv. “VNR-7”. While the lowest number of days to 50% flowering was also recorded with cv. “VNR-7” during the year 2021 and 2022.
Cultivating Proactive Cybersecurity Culture among IT Professional to Combat E...AI Publications
In the current digital landscape, cybercriminals continually evolve their techniques to execute successful attacks on businesses, thus posing a great challenge to information technology (IT) professionals. While traditional cybersecurity approaches like layered defense and reactive security have helped IT professionals cope with traditional threats, they are ineffective in dealing with evolving cyberattacks. This paper focuses on the need for a proactive cybersecurity culture among IT professionals to enable them combat evolving threats. The paper emphasis that building a proactive security approach and culture can help among IT professionals anticipate, identify, and mitigate latent threats prior to them exploiting existing vulnerabilities. This paper also points out that as IT professionals use reactive security when dealing with traditional attacks, they can use it collaboratively with proactive security to effectively protect their networks, data, and systems and avoid heavy costs of dealing with cyberattack’s aftermaths and business recovery.
The Impacts of Viral Hepatitis on Liver Enzymes and BilrubinAI Publications
Viral hepatitis is an infection that causes liver inflammation and damage. Several different viruses cause hepatitis, including hepatitis A, B, C, D, and E. The hepatitis A and E viruses typically cause acute infections. The hepatitis B, C, and D viruses can cause acute and chronic infections. Hepatitis A causes only acute infection and typically gets better without treatment after a few weeks. The hepatitis A virus spreads through contact with an infected person’s stool. Protection by getting the hepatitis A vaccine. Hepatitis E is typically an acute infection that gets better without treatment after several weeks. Some types of hepatitis E virus are spread by drinking water contaminated by an infected person’s stool. Other types are spread by eating undercooked pork or wild game. Hepatitis B can cause acute or chronic infection. Recommendation for screening for hepatitis B in pregnant women or in those with a high chance of being infected. Protection from hepatitis B by getting the hepatitis B vaccine. Hepatitis C can cause acute or chronic infection. Doctors usually recommend one-time screening of all adults ages 18 to 79 for hepatitis C. Early diagnosis and treatment can prevent liver damage. The hepatitis D virus is unusual because it can only infect those who have a hepatitis B virus infection. A coinfection occurs when both hepatitis D and hepatitis B infections at the same time. A superinfection occurs already have chronic hepatitis B and then become infected with hepatitis D. The aim of this study is to find the effect of each type of viral hepatitis on the bilirubin (TB , DSB) , and liver enzymes; AST, ALT, ALP,GGT among viral hepatitis patients. 200 patients were selected from the viral hepatitis units in the central public health laboratory in Baghdad city, all the chosen cases were confirmed as a positive samples , they are classified into four equal group each with fifty individual and with a single serological viral hepatitis type either; anti-HAV( IgM ) , HBs Ag , anti-HCV ,or anti-HEV(IgM ). All patients were tested for; serum bilirubin ( TB ,D.SB ) , AST , ALT , ALP , GGT. Another fifty quite healthy and normal person was selected as a control group for comparison. . Liver enzymes and bilirubin changes are more pronounced in HAV, HEV than HCV and HBVAST and ALT lack some sensitivity in detecting HCV ,HBV and mild elevations of ALT or AST in asymptomatic patients can be evaluated efficiently by considering ,hepatitis B, hepatitis C. ALT is generally a more sensitive indicator of acute liver cell damage than AST, It is relatively specific for hepatocyte necrosis with a marked elevations in viral hepatitis. Liver enzymes and bilirubin changes are more pronounced in HAV, HEV than HCV and HBV.AST and ALT lack some sensitivity in detecting HCV ,HBV and mild elevations of ALT or AST in asymptomatic patients can be evaluated efficiently by considering ,hepatitis B, hepatitis C. ALT is generally a more sensitive indicator of acute liver
Determinants of Women Empowerment in Bishoftu Town; Oromia Regional State of ...AI Publications
The purpose of this study was to determine the status of women's empowerment and its determinants using women's asset endowment and decision-making potential as indicators. To determine representative sample size, this study used a two-stage sampling technique, and 122 sample respondents were selected at random. To analyze the data in this study, descriptive statistics and a probit model were used. The average women's empowerment index was 0.41, indicating a relatively lower status of women's empowerment in the study area. According to the study's findings, only 40.9% of women were empowered, while the remaining 59.1% were not. The probit model results show that women's access to the media, women's income, and their husbands' education status have a significant and positive impact on the status of women's empowerment, while the family size of households has a negative impact. As a result, it is important to enhance women's access to the media and income, promote family planning and contraception, and improve men's educational status in order to improve the status of women's empowerment.
Determinants of Women Empowerment in Bishoftu Town; Oromia Regional State of ...
Comparison and Evaluation of Support Vector Machine and Gene Programming in River Suspended Sediment Estimation (Case Study: Kashkan River)
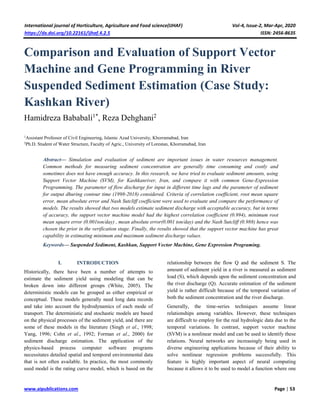
1. International journal of Horticulture, Agriculture and Food science(IJHAF) Vol-4, Issue-2, Mar-Apr, 2020
https://dx.doi.org/10.22161/ijhaf.4.2.5 ISSN: 2456-8635
www.aipublications.com Page | 53
Comparison and Evaluation of Support Vector
Machine and Gene Programming in River
Suspended Sediment Estimation (Case Study:
Kashkan River)
Hamidreza Bababali1*
, Reza Dehghani2
1
Assistant Professor of Civil Engineering, Islamic Azad University, Khorramabad, Iran
2
Ph.D. Student of Water Structure, Faculty of Agric., University of Lorestan, Khorramabad, Iran
Abstract— Simulation and evaluation of sediment are important issues in water resources management.
Common methods for measuring sediment concentration are generally time consuming and costly and
sometimes does not have enough accuracy. In this research, we have tried to evaluate sediment amounts, using
Support Vector Machine (SVM), for Kashkanriver, Iran, and compare it with common Gene-Expression
Programming. The parameter of flow discharge for input in different time lags and the parameter of sediment
for output dhuring contour time (1998-2018) considered. Criteria of correlation coefficient, root mean square
error, mean absolute error and Nash Sutcliff coefficient were used to evaluate and compare the performance of
models. The results showed that two models estimate sediment discharge with acceptable accuracy, but in terms
of accuracy, the support vector machine model had the highest correlation coefficient (0.994), minimum root
mean square error (0.001ton/day) , mean absolute error(0.001 ton/day) and the Nash Sutcliff (0.988) hence was
chosen the prior in the verification stage. Finally, the results showed that the support vector machine has great
capability in estimating minimum and maximum sediment discharge values.
Keywords— Suspended Sediment, Kashkan, Support Vector Machine, Gene Expression Programing.
I. INTRODUCTION
Historically, there have been a number of attempts to
estimate the sediment yield using modeling that can be
broken down into different groups (White, 2005). The
deterministic models can be grouped as either empirical or
conceptual. These models generally need long data records
and take into account the hydrodynamics of each mode of
transport. The deterministic and stochastic models are based
on the physical processes of the sediment yield, and there are
some of these models in the literature (Singh et al., 1998;
Yang, 1996; Cohn et al., 1992; Forman et al., 2000) for
sediment discharge estimation. The application of the
physics-based process computer software programs
necessitates detailed spatial and temporal environmental data
that is not often available. In practice, the most commonly
used model is the rating curve model, which is based on the
relationship between the flow Q and the sediment S. The
amount of sediment yield in a river is measured as sediment
load (S), which depends upon the sediment concentration and
the river discharge (Q). Accurate estimation of the sediment
yield is rather difficult because of the temporal variation of
both the sediment concentration and the river discharge.
Generally, the time-series techniques assume linear
relationships among variables. However, these techniques
are difficult to employ for the real hydrologic data due to the
temporal variations. In contrast, support vector machine
(SVM) is a nonlinear model and can be used to identify these
relations. Neural networks are increasingly being used in
diverse engineering applications because of their ability to
solve nonlinear regression problems successfully. This
feature is highly important aspect of neural computing
because it allows it to be used to model a function where one
2. International journal of Horticulture, Agriculture and Food science(IJHAF) Vol-4, Issue-2, Mar-Apr, 2020
https://dx.doi.org/10.22161/ijhaf.4.2.5 ISSN: 2456-8635
www.aipublications.com Page | 54
has little information or incomplete understanding. Thus, the
SVM approach is extensively used in the water resources
literature in the field of prediction and forecasting (In recent
years, Support Vector Machines (SVM) has been widely
used in various fields. Runoff and sediment yield estimation
can utilize SVM as well (misraet al,2009). SVM is a
powerful nonlinear pattern recognition technique
(Vapnik,1998; Kecman,2000). The relationship was used to
estimate suspended sediment load by using linear regression
model, power regression model, artificial neural network and
support vector machine in this study. Records of river
discharges and suspended sediment loads in Kaoping river
basin were investigated as case study. The result shows that
SVM outperforms the ANN and other two regression
models(Chiang and Tsai,2011).This study presents gene-
expression programming (GEP), which is an extension of
genetic programming (GP), as an alternative approach for
modeling the functional relationships of sediment transport
in sewer pipe systems. A functional relation has been
developed using GEP. The proposed relationship can be
applied to different boundaries with partial flow. The
proposed GEP approach gives satisfactory results) compared
to the existing predictor(Ghani and Azamathulla,2011).The
study Records of river discharges and suspended sediment
loads in the Goodwin Creek Experimental Watershed in
United States were investigated as a case study. As a result,
we believe that the proposed SVM model has high potential
for predicting suspended sediment load(Chiang et
al.,2014).The study compares the results of the Soil and
Water Assessment Tool (SWAT) with a Support Vector
Machine (SVM) to predict the monthly streamflow of arid
regions located in the southern part of Iran, namely the
Roodan watershed. Results indicate that the SVM has a
closer value for the average flow in comparison to the
SWAT model; whereas the SWAT model outperformed for
total runoff volume with a lower error in the validation
period(Jajarmizadehet al.,2015).Discharge time series were
investigated using predictive models of support vector
machine (SVM) and artificial neural network (ANN) and
their performances were compared with two conventional
models. The evaluation of the results includes different
performance measures, which indicate that SVM and ANN
have an edge over the results by the conventional RC and
MLR models. Notably, peak values predicted by SVM and
ANN are more reliable than those by RC and MLR, although
the performances of these conventional models are
acceptable for a range of practical problems(Ghorbaniet
al.,2016).In total, according to done research and mention
this point that Kashkan river as the main source of water
supply for different sectors and adjacent areas, so the
estimated Suspended sediment and management proceedings
to improved optimal operation of reservoir more than ever it
is essential. So the purpose this research is estimated
Suspended sediment in Kashkanriver with the help support
vector machine and compared that's results with gene
expression programming.
II. MATERIALS AND METHODS
Case study and used data
Kashkan River is the most flooded river in Lorestan
province. The Kashkan catchment area is located in the
southwestern part of Iran with a surface area of 1.5 km2.
This area forms an important part of the rugged branches of
the Karkhe River and covers about one-third of the Lorestan
soil. Watershed of Kashan River in the hydrological division
of Iran is a part of the Persian Gulf catchment. The river is
located between latitude ′ 34 ′ 31 ° 47 ° to ′ 12 48 12 ° 48
east and latitude ″ 45 ° 5 ° 33 to ″ 41 ° 44 ° 33 ° N in
Lorestan province. The location of the study area is shown in
Figure 1.
3. International journal of Horticulture, Agriculture and Food science(IJHAF) Vol-4, Issue-2, Mar-Apr, 2020
https://dx.doi.org/10.22161/ijhaf.4.2.5 ISSN: 2456-8635
www.aipublications.com Page | 55
Fig.1: Geographical location Kashkanriver
Table 1. Statistical properties Sediment parameter month (1998-2018)
Station Period of record Data set Statistics Q(m3/s) S(ton/day)
Kashkan 1998-2018
Training
Minimum 0.921 0.425
Mean 18.865 4427.341
Maximum 410.840 355474.284
deviation 41.652 28324.672
Skewness 7.542 12.424
Testing
Minimum 0.000 0.742
Mean 9.154 31.756
Maximum 24.158 215.122
deviation 7.874 52.105
Skewness 1.058 2.598
Gene Expression Programming
Gene Expression Programming method presented with
Ferreira in 1999 (Ferreira.2001). This method is a
combination of genetic algorithms (GA) and genetic
programming (GP) method than in this, simple linear
chromosomes of fixed length are similar to what is used in
genetic algorithm and branched structures with different
sizes and shapes aresimilar to the decomposition of trees in
genetic programming.Since this method all branch
structures of different shapes and size are encoded in linear
chromosome with fixed length, this is equivalent than
Phenotype and Genotype are separated from each other and
system could use all evolutionary advantagesbecause of
their. Now,however the Phenotype in GEP included branch
structures used in GP, but the branch structures be
inferences by GEP (than also calledtreestatement) are
explainer all independent genomes. In short can say
improvements happened in linear structure then is expressed
similar with tree structure and this causes only the modified
genomemoved to the Next Generation and don't need with
4. International journal of Horticulture, Agriculture and Food science(IJHAF) Vol-4, Issue-2, Mar-Apr, 2020
https://dx.doi.org/10.22161/ijhaf.4.2.5 ISSN: 2456-8635
www.aipublications.com Page | 56
heavy structure to reproduce and mutation (Ferreira.2001).
In this method different phenomena are modeling by
collection of functions and terminals. Collection of
functions generally include the main functions of arithmetic
{+, -, ×, /}, the trigonometric functions or any other
mathematical function {√, x2, sin, cos, log, exp, …} or
defined functions by author whom believed they are
appropriate for interpreting model. Collection of terminals
consist problem's constants values and independent
variables (2001). For applying gene expression
programming method is used GenXproTools 4.0 Software.
In order to obtain more information can recourse to
(Ghorbaniet al.,2012).
Support Vector Machine
Support Vector Machine is anefficient learning system
based on optimization theory that used the principle of
induction minimization Structural error and results an
overall optimal solution(Vapnik,1998). In regression model
SVM is estimated function associated with the dependent
variable Y as if is afunction of several independent
variables X(Xuet al.,2007).Like other regression problems
is assumed the relationship between the dependent and
independent variables to be determined with algebraic
function similar f(x) plus some allowable error (𝜀).
f(x)=W T
.∅(x)+b (1)
(2)
If W is coefficients vector, b is constant characteristic of
regression function, and also ∅ is kernel function, then goal
is to find a functional form for f(x). It is realized with SVM
model training by collection of samples (train collection).
To calculate w and b require to be optimized error function
in 𝜀-SVM with considering the conditions embodied in
Equation 4(Shin et al.,2005).
WT
. ∅(Xi)+b-yi
≤ ε+ εi
*
,
1
2
WT
. W + C ∑ εi
N
i=1 + C ∑ εi
∗N
i=1
(3)
yi − WT
. ∅ (Xi) − b ≤ ε + εi , εi , εi
∗
≥ 0 , i = 1,2, … , N
(4)
In the above equations, C is integer and positive, that it's
factor of penalty determinant when an error occurs. ∅ is
kernel function, N is number of samples and two
characteristics εi and εi
∗
are shortage variables. Finally can
rewrite SVM function as follow(Shin et al.,2005):
f(x)= ∑ α̅i
N
i=1 ∅(xi)T
. ∅(x)+b (5)
Average Lagrange Coefficients α̅i in characterized space is
∅(x).Maybe calculation be very complex. To solve this
problem, the usual process of SVM model is choose a
kernel function as followrelation.
K(XJ ,X)=∅(Xi)T√ b2
-4ac (6)
Can be used of different kernel functions to create different
types of 𝜀-SVM. Various kernel functions used in SVM
regression models are: Polynomial with three
Characteristics of the target, Radial Basis Functions (RBF)
with one Characteristics of the target, and Linear
respectively, are calculated as follows
relation(Vapnik.1998).
k(xi,xj)=(xi.xj)
d
(7)
K(x,xi)=exp (-
‖x-xi‖
2
2σ2 ) (8)
k(xi,xj)=xi.xj (9)
Evaluation Criteria
In this research to evaluate the accuracy and efficiency of
the models was used indices Correlation Coefficient (CC),
Root Mean Square Error (RMSE), Nash–Sutcliffe
coefficient (NS), and Bias according to the following
relations.Best values for these four criterions are
respectively 1, 0, 1, and 0.
CC=
∑ (xi-x̅)(yi-y̅)N
i=1
√∑ (xi-x̅)
2N
i=1 ∑ (yi-y̅)
2N
i=1
-1≤ R ≤1 (10)
RMSE=√
1
N
∑ (xi-yi
)
2N
i=1 (11)
NS=1-
∑ (xi-yi)
2N
i=1
∑ (xi-y̅)
2N
i=1
-∞≤ NS ≤1 (12)
In the above relations xi and yi are respectively observed
and calculated values in time step i, N is number of time
steps, x̅ and y̅ are respectively mean observed and
calculated values.
III. RESULTS AND DISCUSSION
One of the most important steps in modeling, is select the
right combination of input variables. Also shown in Table
2.The structure of input combinations.
5. International journal of Horticulture, Agriculture and Food science(IJHAF) Vol-4, Issue-2, Mar-Apr, 2020
https://dx.doi.org/10.22161/ijhaf.4.2.5 ISSN: 2456-8635
www.aipublications.com Page | 57
Table 2.The structure of input combinations
OutputInputStructure
S(t)Q(t)1
S(t)Q(t)Q(t-1)2
S(t)Q(t)Q(t-1)Q(t-2)3
In this Table Q(t), Q(t-1) and Q(t-2) are respectively
discharge in t, t-1 , t-2 time as input and S(t) is sediment in
t time as output being considered. Due to the significant
cross-correlation between input and output data, in order to
achieve an optimal model to estimate the sediment to
Kashkan river use of different combinations of input
parameters that showed them in Table3. To estimate input
discharge Kashkan river using by Gene Expression
Programming and Support Vector Machine with have
catchment hydrometric data from 240 registered records
during the period (1998-2018), count in 192 records to
training and 48 remaining records to verification.
The results of Gene Expression Programming
Using gene expression programming due to the selection of
variables in the model and remove variables with less
impact and also ability to provide a clear relationship were
considered to estimating sediment to the Kashkanriver.
Since ever four input are incorporated to determining the
significant variables and more reviews in addition three of
the original operator (F1) and the states based on arithmetic
operators default (F2). The reason for choice this type of
operator has been based on studies (Ghorbaniet al.,2012)
and (Khatibiet al.,2012).
F1:{+, −,∗,/, √, Exp, Ln,2
,3
, ∛, Sin, Cos, Atan} (13)
F2:{+, −,∗,/} (14)
Results of gene expression programming model for both
operator in Table3 show that F2 operator in both stages
training and verification with maximum correlation
coefficient R=0.813, root mean square error RMSE=0.002,
mean absolute error MAE=0.002 and NS=0.643 has high
accurate than other operators. Therefore gene expression
programming with F2 operator include four the main
mathematical operators with a simple mathematical
relationship has the most accurate to estimating sediment to
the Kashkan river.
Also, In order to compare the results of the usemodel
support vector machine. The program for SVM was
constructed using MATLAB (The MathWorksInc 2012). In
this study the RBF,Poly and Line kernel with parameters
(C, ɛ, σ),were used for stage–discharge modeling, with the
accuracy of the SVM model being dependent on the
identified parameters. In this study, the parameter search
scheme employed is the shuffled complex evolution
algorithm (SCE-UA), (see Lin et al., 2006; Yu et al., 2006).
The SCE-UA technique has been used successfully in the
area of surface and subsurface hydrology processes (Duanet
al., 1994). To obtain suitable values of these parameters (C,
ɛ, σ),the RMSE was used to optimize parameters. In order
to estimate the sediment to the Kashkanriver by SVM
model can examine types of kernel function, than was
selected linear kernel, polynomial and radial basis functions
that are common types used in hydrology. The results of
study models is given in Table3. According to this table
combined model number 3 with radial basis functions
kernel has the highest correlation coefficient R=0.994,
lowest root mean square error RMSE=0.001 ton/day ,mean
absolute errorMAE=0.001ton/day and NS=0.988 in
verification stage that has optimal solution than other
models. In Fig3 shown the best model for verification of
data.
Table 3. The final results of the training and verification gene expression programming and support vector machine
Model
Training Testing
R RMSE MAE NS R RMSE MAE NS
SVM_RBF_1 0.91 0.074 0.27 0.901 0.946 0.008 0.006 0.952
SVM_RBF_2 0.95 0.042 0.011 0.926 0.978 0.005 0.003 0.978
SVM_RBF_3 0.974 0.018 0.006 0.945 0.994 0.001 0.001 0.988
GEP_F2_1 0.89 0.075 0.023 0.837 0.797 0.011 0.007 0.612
GEP_F2_2 0.92 0.043 0.014 0.862 0.805 0.007 0.003 0.637
GEP_F2_3 0.936 0.030 0.008 0.876 0.813 0.002 0.002 0.643
6. International journal of Horticulture, Agriculture and Food science(IJHAF) Vol-4, Issue-2, Mar-Apr, 2020
https://dx.doi.org/10.22161/ijhaf.4.2.5 ISSN: 2456-8635
www.aipublications.com Page | 58
As shown in Figure 2, scatter plot Support Vector Machine
matched observed and simulated values relative to the with
the best fit line there y=x. Which explains the ability of this
model is the estimation most values. The scatter plots of gene
expression programming related to the verification stage in
Fig(2-b) show the fit line of computational values with four
mathematical operators to the best fit line y=x.As is from this
Fig, all of the estimated and observation values are in the fit
line except few points that are not in bisector line which it is
denoted the estimated and observed values of equality on the
line (y=x). On the other side in figures 3, the graph of can be
seen over time for simulation models. In fig 3-a , is shown
Support Vector Machine model from performance acceptable
in estimation values. But according to the fig 3-b, shown
GEP model estimating the maximum acceptable accuracy
has not been.
Fig.2: Scatterplots of the predicted-observed sediment time series of the Kashkan station in test period using (a)SVM; (b) GEP.
0
50
100
150
200
250
1 3 5 7 9 11 13 15 17 19 21 23 25 27 29 31 33 35 37 39 41 43 45 47
Observed Predicted
Predicted(ton/day)
Time (month)
a_SVM
7. International journal of Horticulture, Agriculture and Food science(IJHAF) Vol-4, Issue-2, Mar-Apr, 2020
https://dx.doi.org/10.22161/ijhaf.4.2.5 ISSN: 2456-8635
www.aipublications.com Page | 59
Fig.3: Comparison of the optimal models with observed values observed values plots for testing data set (a) SVM; (b) GEP
Comparison Performance of models
Choosing the optimal solution for each of the models and
compare together was defined all two methods can with good
accurate simulate sediment to the Kashkan river. Comparison
of gene expression programming model and support vector
machine model shown proximity the results of these two
models. In Fig4 shown the results of all two models to the
observed valueduring the time that all two models good
function, whereas support vector machine modelis well
covered minimum, maximum, and middle values.
Fig.4: The scatter plot between estimated and observed values gene expression programming and support vector machine models
for recorded data in verification stage
0
50
100
150
200
250
1 3 5 7 9 11 13 15 17 19 21 23 25 27 29 31 33 35 37 39 41 43 45 47
Observed Predicted
Predicted(ton/day)
Time (month)
b_GEP
0
50
100
150
200
250
1 3 5 7 9 11 13 15 17 19 21 23 25 27 29 31 33 35 37 39 41 43 45 47
Observed SVM GEP
Predicted(ton/day)
Time (month)
8. International journal of Horticulture, Agriculture and Food science(IJHAF) Vol-4, Issue-2, Mar-Apr, 2020
https://dx.doi.org/10.22161/ijhaf.4.2.5 ISSN: 2456-8635
www.aipublications.com Page | 60
Fig.5: All two models graph optimization error as a percentage of the mean observed value
Finally difference between the observed sediment values
and optimal computational models calculated as a
percentage of the mean observed values (error value) and
was drawn this diagram in comparison with the data
recorded (Fig5). As seen in this Fig, more errors to ever two
models has been ±5 band the highest error rate gene
expression programming and support vector machine
models are respectively 0.643 and 0.291 percent of the
mean observed values. Among these models ( GEP and
SVM) svm model has lowest error value. Totally due to the
high estimation accuracy and reliability gene expression
programming and support vector machine models the
correlation between the observed values and the computed
values are respectively 0.994 and 0.813. Also the results of
was significant estimated and observed values in the
probability levels %5 and %10 shown, SVM model has
significant correlation in both probability levels.
IV. CONCLUSIONS
In this research, we tried to evaluated performance some
models to simulating sediment to the Kashkan River In the
province lorestan using by sediment month data in
Kashkanriver. Used models include gene expression
programming and support vector machine models.
Observed sediment values compared with estimated
sediment in these models (GEP and SVM). The results
summarized as follows:
A: SVM model has high accurate and a little error to
estimate minimum, maximum, middle values and peak
sediment, and high correlation with the observed value. B:
Gene expression programming model with the four basic
arithmetic operations has high ability to estimating
minimum, maximum, and middle values and peak values,
also support vector machine with radial basis functions
kernel has high ability estimating minimum and middle
values but to estimating maximum values do have enough
operation. C: Increasing the number of parameters in the
various models to simulating sediment cause to improve
operation to estimating sediment. D: Estimating sediment
using by combined models have lower error and high
correlation than other models to estimated sediment in
reservoirs dam.
Totally the results of this research showed support vector
machine method has highest accurate than other models. As
research results Jajarmizadeh et al(2015) and Ghorbani et
al(2016) has been proven its. Also this research shown
using of gene expression programming and support vector
machine models could use to estimating sediment to the
river.
V. ACKNOWLEDGMENTS
The authors are very grateful of the Regional Water
Company, Lorestan Province, Iran, because they participate
in gathering the data required to perform the work.
-2
-1.5
-1
-0.5
0
0.5
1
1 3 5 7 9 11 13 15 17 19 21 23 25 27 29 31 33 35 37 39 41 43 45 47
SVM GEP
Error
Time (month)
9. International journal of Horticulture, Agriculture and Food science(IJHAF) Vol-4, Issue-2, Mar-Apr, 2020
https://dx.doi.org/10.22161/ijhaf.4.2.5 ISSN: 2456-8635
www.aipublications.com Page | 61
REFERENCES
[1] Chiang, J., Tsai, Y., Cheng, K., Lee, Y., Sun, M., Wei,
J.,2014. Suspended Sediment Load Prediction Using Support
Vector Machines in the Goodwin Creek Experimental
Watershed. Geophysical Research Abstracts. 16(1):pp.234-
247.
[2] Chiang, J., Tsai, Y., 2011. Suspended Sediment Load
Estimate Using Support Vector Machines in Kaoping River
Basin. International Conference on suspended sediment load
[3] Cohn, T.A.,Caulder, D.L., Gilroy, E.J., Zynjuk, L.D.,
Summers, R.M., 1992. The validity of a simple statistical
model for estimating fluvial constituent loads: an empirical
study involving nutrient loads entering Chesapeake Bay.
Water Resources Research 28.pp.2353–2363.
[4] Ferreira,C .,2001. Gene expression programming: a new
adaptive algorithm for solving problems. Complex
Systems,13(2):pp. 87–129.
[5] Forman, S.L., Pierson, J., Lepper, K., 2000. Luminescence
geochronology. In: Sowers, J.M., Noller, J.S., Lettis, W.R.
(Eds.), Quaternary Geochronology: Methods and
Applications. American Geophysical Union Reference Shelf
4, Washington DC,pp. 157– 176.
[6] Ghani, A.B., Azamathulla, H., 2011.Gene-Expression
Programming for Sediment Transport in Sewer Pipe
Systems. J. Pipeline Syst. Eng. Pract., 2(3):pp. 102-106.
[7] Ghorbani, M.A.,Khatibi, R., Goel, A., Azani, A.,
2016.Modeling river discharge time series using support
vector machine and artificial neural networks. Environmental
Earth Sciences. 75(8):pp.675-685
[8] Ghorbani, M.A., Khatibi, R., Asadi, H., Yousefi,P ., 2012.
Inter- Comparison of an Evolutionary Programming Model of
Suspended Sediment Time-series whit other Local Model.
INTECH. doi. org/10.5772/47801,pp. 255-282
[9] Ghorbani, M.A., Khatibi, R.,Goel, A., FazeliFard, M.H.,
Azani, A., 2016. Modeling river discharge time series using
support vector machine and artificial neural networks.
Environ Earth Sci. DOI: 10.1007/s12665-016-5435-6
[10] Jajarmizadeh, M., KakaeiLafdani, E., Harun, S., Ahmadi, A.,
2015. Application of SVM and SWAT models for monthly
streamflow prediction, a case study in South of Iran. KSCE
Journal of Civil Engineering.19(1):pp.345-357
[11] Kecman, V., 2000. Learning and Soft Computing, Support
Vector Machines, Neural Network and Fuzzy Logic
Models.MIT Press,2000(ISBN 0- 262-11255-8. 608p).
[12] Khatibi, R., Naghipour, L., Ghorbani, M.A., Aalami,M.T .,
2012. Predictability of relative humidity by two artificial
intelligence techniques using noisy data from two Californian
gauging stations. Neural computing and application,pp. 643-
941.
[13] Misra, D., Oommen, T., Agarwal, A., Mishra, S.K.,
Thompson, A.M., 2009. Application and analysis of support
vector machine based simulation for runoff and sediment
yield, Biosystems engineering, 103(2): pp. 527 – 535,
[14] Shin, S., Kyung, D., Lee, S., Taik Kim, J., Hyun, J ., 2005.
An application of support vector machines in bankruptcy
prediction model. Expert Systems with Applications, 28:pp.
127-135.
[15] Singh, V.P.,Krstanovic, P.F., Lane, L.J., 1998. Stochastic
models of sediment yield. In: Anderson, M.G. (Ed.),
Modeling Geomorphological Systems, vol. 2. John Wiley and
Sons Ltd., pp.272–286.
[16] Vapnik,V.N .,1998. Statistical Learning Theory. Wiley, New
York.
[17] White S. 2005. Sediment yield prediction and modeling.
Hydrological Processes 19, pp.3053–3057.
[18] Xu, L., Wang, J., Guan, J., Huang, F ., 2007. A Support
Vector Machine Model for Mapping of Lake Water Quality
from Remote-Sensed Images. IC-MED. Vol. 1(1), pp. 57-66.
[19] Yang, C.T., 1996. Sediment Transport, Theory and Practice.
McGraw-Hill, New York.