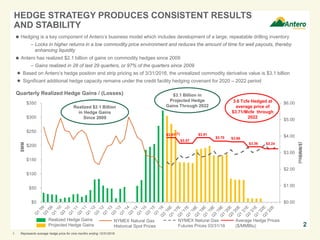
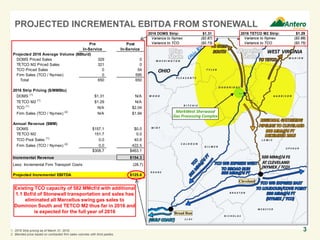
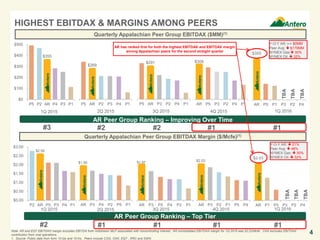
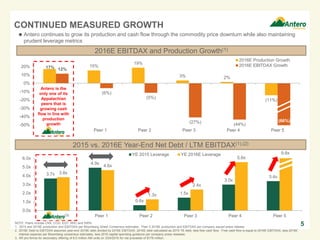
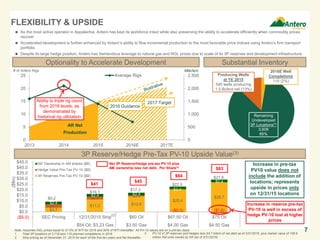
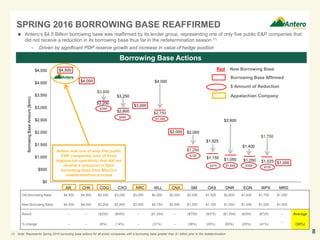
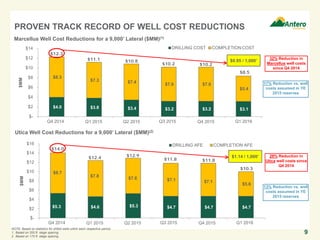
SlideShare a Scribd company logo
First Quarter 2016 Earnings Call Presentation
April 28, 2016
FORWARD-LOOKING STATEMENTS
This presentation contains forward-looking statements within the meaning of Section 27A of the Securities Act of 1933 and Section 21E of the
Securities Exchange Act of 1934. All statements, other than statements of historical facts, included in this presentation that address activities,
events or developments that Antero Resources Corporation and its subsidiaries (collectively, the “Company” or “Antero”) expects, believes or
anticipates will or may occur in the future are forward-looking statements. The words “believe,” “expect,” “anticipate,” “plan,” “intend,” “estimate,”
“project,” “foresee,” “should,” “would,” “could,” or other similar expressions are intended to identify forward-looking statements. However, the
absence of these words does not mean that the statements are not forward-looking. Without limiting the generality of the foregoing, forward-
looking statements contained in this presentation specifically include estimates of the Company’s reserves, expectations of plans, strategies,
objectives and anticipated financial and operating results of the Company, including as to the Company’s drilling program, production, hedging
activities, capital expenditure levels and other guidance included in this presentation. These statements are based on certain assumptions made
by the Company based on management’s experience and perception of historical trends, current conditions, anticipated future developments and
other factors believed to be appropriate. Such statements are subject to a number of assumptions, risks and uncertainties, many of which are
beyond the control of the Company, which may cause actual results to differ materially from those implied or expressed by the forward-looking
statements. These include the factors discussed or referenced under the heading “Item 1A. Risk Factors” in our Annual Report on Form 10-K for
the year ended December 31, 2015 and in the Company’s subsequent filings with the SEC.
The Company cautions you that these forward-looking statements are subject to all of the risks and uncertainties, most of which are difficult to
predict and many of which are beyond our control, incident to the exploration for and development, production, gathering and sale of natural gas
and oil. These risks include, but are not limited to, commodity price volatility, inflation, lack of availability of drilling and production equipment and
services, environmental risks, drilling and other operating risks, regulatory changes, the uncertainty inherent in estimating natural gas and oil
reserves and in projecting future rates of production, cash flow and access to capital, the timing of development expenditures, and the other risks
described under the heading “Risk Factors” in our Annual Report on Form 10-K for the year ended December 31, 2015 and in the Company’s
subsequent filings with the SEC.
Any forward-looking statement speaks only as of the date on which such statement is made and the Company undertakes no obligation to correct
or update any forward-looking statement, whether as a result of new information, future events or otherwise, except as required by applicable law.
1
Antero Resources Corporation is denoted as “AR” and Antero Midstream Partners LP is denoted as “AM”
in the presentation, which are their respective New York Stock Exchange ticker symbols.
$0.00
$1.00
$2.00
$3.00
$4.00
$5.00
$6.00
$0
$50
$100
$150
$200
$250
$300
$350
$MM
2
 Hedging is a key component of Antero’s business model which includes development of a large, repeatable drilling inventory
– Locks in higher returns in a low commodity price environment and reduces the amount of time for well payouts, thereby
enhancing liquidity
 Antero has realized $2.1 billion of gains on commodity hedges since 2009
– Gains realized in 28 of last 29 quarters, or 97% of the quarters since 2009
● Based on Antero’s hedge position and strip pricing as of 3/31/2016, the unrealized commodity derivative value is $3.1 billion
● Significant additional hedge capacity remains under the credit facility hedging covenant for 2020 – 2022 period
Quarterly Realized Hedge Gains / (Losses)
Realized Hedge Gains
Projected Hedge Gains
NYMEX Natural Gas
Historical Spot Prices
($/MMBtu)
NYMEX Natural Gas
Futures Prices 03/31/16
3.6 Tcfe Hedged at
average price of
$3.71/Mcfe through
2022
Average Hedge Prices
($/MMBtu)
$3.36
$3.91
$3.57
$3.91
$3.70 $3.66
$3.24
$3.1 Billion in
Projected Hedge
Gains Through 2022Realized $2.1 Billion
in Hedge Gains
Since 2009
HEDGE STRATEGY PRODUCES CONSISTENT RESULTS
AND STABILITY
(1)
1. Represents average hedge price for nine months ending 12/31/2016.
Pre Post
In-Service In-Service
Projected 2016 Average Volume (BBtu/d)
DOMS Priced Sales 329 0
TETCO M2 Priced Sales 321 0
TCO Priced Sales 0 54
Firm Sales (TCO / Nymex) 0 595
Total 650 650
2016 Strip Pricing ($/MMBtu)
DOMS (1)
$1.31 N/A
TETCO M2 (1)
$1.29 N/A
TCO (1)
N/A $2.04
Firm Sales (TCO / Nymex) (2)
N/A $1.94
Annual Revenue ($MM)
DOMS $157.1 $0.0
TETCO M2 151.7 0.0
TCO Pool Sales (1)
0.0 40.6
Firm Sales (TCO / Nymex) (2)
0.0 422.5
$308.7 $463.1
Incremental Revenue $154.3
Less: Incremental Firm Transport Costs: (28.7)
Projected Incremental EBITDA $125.6
PROJECTED INCREMENTAL EBITDA FROM STONEWALL
1. 2016 Strip pricing as of March 31, 2016.
2. Blended price based on contracted firm sales volumes with third parties.
Existing TCO capacity of 582 MMcf/d with additional
1.1 Bcf/d of Stonewall transportation and sales has
eliminated all Marcellus swing gas sales to
Dominion South and TETCO M2 thus far in 2016 and
is expected for the full year of 2016
3
2016 DOMS Strip: $1.31
Variance to Nymex ($0.87)
Variance to TCO ($0.73)
2016 TETCO M2 Strip: $1.29
Variance to Nymex ($0.88)
Variance to TCO ($0.75)
$2.03
AR P1 P5 P3 P2 P4
$355
AR P5 P1 P3 P2 P4
3Q 2015
$1.97
AR P3 P5 P4 P2 P1
$2.03
AR P3 P2 P1 P5 P4
$2.56
$0.00
$0.50
$1.00
$1.50
$2.00
$2.50
$3.00
P2 AR P5 P3 P4 P1
$308
AR P5 P3 P2 P4 P1
$1.90
AR P3 P4 P2 P5 P1
$291
P5 AR P3 P2 P4 P1
$269
P5 AR P2 P3 P4 P1
$355
$0
$100
$200
$300
$400
$500
P5 P2 AR P4 P3 P1
HIGHEST EBITDAX & MARGINS AMONG PEERS
Quarterly Appalachian Peer Group EBITDAX Margin ($/Mcfe)(1)
Quarterly Appalachian Peer Group EBITDAX ($MM)(1)
1Q 2015 2Q 2015
Note: AR and EQT EBITDAX margin excludes EBITDA from midstream MLP associated with noncontrolling interest. AR consolidated EBITDAX margin for 1Q 2016 was $2.22/Mcfe. CNX excludes EBITDAX
contribution from coal operations.
1. Source: Public data from form 10-Qs and 10-Ks. Peers include COG, CNX, EQT , RRC and SWN.
4Q 2015 1Q 20161Q 2015 2Q 2015
AR Peer Group Ranking – Top Tier
#2 #1 #1 #1 #1
AR Peer Group Ranking – Improving Over Time
#3 #2 #2 #1 #1
Y-O-Y AR: ↔ $0MM
Peer Avg:  $170MM
NYMEX Gas: 30%
NYMEX Oil:  32%
Y-O-Y AR:  21%
Peer Avg:  46%
NYMEX Gas:  30%
NYMEX Oil:  32%
4
3Q 2015
AR has ranked first for both the highest EBITDAX and EBITDAX margin
among Appalachian peers for the second straight quarter
4Q 2015 1Q 2016
TBA
TBA
TBA
TBA
TBA
TBA
3.7x
4.9x
0.6x
1.5x
3.0x
3.4x
3.8x
4.6x
1.3x
2.4x
5.6x
0.0x
1.0x
2.0x
3.0x
4.0x
5.0x
6.0x
AR Peer 1 Peer 2 Peer 3 Peer 4 Peer 5
YE 2015 Leverage YE 2016E Leverage
17% 15%
19%
3% 2%
(11%)
12%
(6%)
(5%)
(27%) (44%)-50%
-40%
-30%
-20%
-10%
0%
10%
20%
AR Peer 1 Peer 2 Peer 3 Peer 4 Peer 5
2016E Production Growth
2016E EBITDAX Growth
CONTINUED MEASURED GROWTH
5
2015 vs. 2016E Year-End Net Debt / LTM EBITDAX(1),(2)
NOTE: Peers include CNX, COG, EQT, RRC and SWN.
1. 2015 and 2016E production and EBITDAX per Bloomberg Street Consensus estimates. Peer 5 2016E production and EBITDAX per company issued press release.
2. 2016E Debt to EBITDAX assumes year-end 2016E debt divided by 2016E EBITDAX. 2016E debt calculated as 2015 YE debt, less free cash flow. Free cash flow is equal to 2016E EBITDAX, less 2016E
interest expense per Bloomberg consensus estimates, less 2016 capital spending guidance per company press releases.
3. AR pro forma for secondary offering of 8.0 million AM units on 3/24/2016 for net proceeds of $178 million.
9.8x
Antero continues to grow its production and cash flow through the commodity price downturn while also maintaining
prudent leverage metrics
2016E EBITDAX and Production Growth(1)
Antero is the
only one of its
Appalachian
peers that is
growing cash
flow in line with
production
growth
(66%)
(3)
6
1. Revenues represent annual mark-to-market value based on 3/31/2016 strip pricing, including 1Q 2016 actual hedge gain of $324 million.
2. Consensus EBITDAX as of 3/31/2016.
3. Includes targeted drilling and completion cost improvements.
 Antero can achieve 17% year-over-year net production growth for 2016 by spending only $675 million, or approximately $500
million less than the $1.2 billion of expected hedge revenues for the year(1)
 Incremental growth capital of $625 million in 2016 positions Antero to achieve its 20% year-over-year targeted net production
growth in 2017, while only having to spend $875 million in 2017
LOW MAINTENANCE CAPITAL PROVIDES
FLEXIBILITY AND UPSIDE
Maintenance Capital
$275
Maintenance Capital
$500
2016 Growth Capital
$400
2017 Growth Capital
$375
2017 Growth Capital
$625
$0
$200
$400
$600
$800
$1,000
$1,200
$1,400
$1,600
2016 2017
$1.3 Bn D&C Budget
0% Y-O-Y
Growth of
1,493 MMcfe/d
17% Y-O-Y
Growth
Contributes to 20%
Y-O-Y Growth
Target for 2017
0% Y-O-Y
Growth of
1,750 MMcfe/d
20% Y-O-Y
Growth Target
for $875 MM
Capex in 2017
Hedge
Revenues
$1,156MM(1)
Hedge
Revenues
$572MM(1)
$MM
2016 2017
Prior year DUCs completed 16 70
D&C Capital – DUCs ($MM) $125 $425
Driven by the DUC inventory, continued capital efficiency
and volumes sold forward at attractive prices, Antero is
positioned to achieve its 2016 guidance and 2017
production target with modest outspend
2018 Growth
Capital
TBD
(3)
Consensus
EBITDAX(2)
Consensus
EBITDAX(2)
$3.7
$11.2 $13.9
$20.4
$26.7
$3.1
$2.5
$0.9
($0.3) ($1.6)
$2.4
$2.4 $2.4
$2.4
$2.4
$9.2
$16.1
$17.3
$22.5
$27.6
($5.0)
$0.0
$5.0
$10.0
$15.0
$20.0
$25.0
$30.0
$35.0
$40.0
$45.0
SEC Pricing 12/31/2015 Strip $60 Oil $67.50 Oil $75 Oil
$3.50 Gas $4.00 Gas $4.50 Gas
AR Ownership in AM shares ($B)
Hedge Value Pre-Tax PV-10 ($B)
3P Reserves Pre-Tax PV-10 ($B)
FLEXIBILITY & UPSIDE
7
 As the most active operator in Appalachia, Antero has kept its workforce intact while also preserving the ability to accelerate efficiently when commodity prices
recover
 Accelerated development is further enhanced by Antero’s ability to flow incremental production to the most favorable price indices using Antero’s firm transport
portfolio
 Despite its large hedge position, Antero has tremendous leverage to natural gas and NGL prices due to scale of its 3P reserves and development infrastructure
Net 3P Reserve/Hedge pre-tax PV-10 plus
AM ownership less net debt, Per Share(3)
$45
$64
$83
Increase in pre-tax
PV10 value does not
include the addition of
locations; represents
upside in prices only
on 12/31/15 locations
Note: Assumes NGL prices equal to 37.5% of WTI for 2016 and 50% of WTI thereafter. All PV-10 values are on a pre-tax basis.
1. Total 3P locations of 3,719 less 110 planned completions in 2016.
2. Strip pricing as of December 31, 2015 for each of the first ten years and flat thereafter.
$54 Oil; $3.23 Gas
Increase in reserve pre-tax
PV-10 is well in excess of
hedge PV-10 lost at higher
prices
3P Reserve/Hedge Pre-Tax PV-10 Upside Value(3)
Substantial InventoryOptionality to Accelerate Development
$41
Remaining
Undeveloped
3P Locations(1)
3,609
85%
Producing Wells
at YE 2015
540 wells producing
1.5 Bcfe/d net (13%)
2016E Well
Completions
110 (2%)
3. PV-10 of 3P reserves and hedges less $4.7 billion of net debt as of 3/31/2016, plus market value of 108.9
million AM units owned by AR (as of 3/31/2016).
(2)
0
500
1,000
1,500
2,000
2,500
0
5
10
15
20
25
2013 2014 2015 2016E 2017E
Average Rigs
Ability to triple rig count
from 2016 levels, as
demonstrated by
historical rig utilization
# of Antero Rigs MMcfe/d
AR Net
Production
2016 Guidance
2017 Target
($Bn)
Old Borrowing Base $4,500 $4,000 $3,400 $3,250 $3,000 $4,000 $2,000 $2,000 $1,525 $2,600 $1,400 $1,750 $1,000
New Borrowing Base $4,500 $4,000 $3,200 $2,800 $3,000 $2,750 $2,000 $1,250 $1,150 $1,050 $1,050 $1,025 $1,000
Result -- -- ($200) ($450) -- ($1,250) -- ($750) ($375) ($1,550) ($350) ($725) -- Average
% change -- -- (6%) (14%) -- (31%) -- (38%) (25%) (60%) (25%) (41%)
--
(30%)
SPRING 2016 BORROWING BASE REAFFIRMED
Borrowing Base Actions
(1) Note: Represents Spring 2016 borrowing base actions for all public companies with a borrowing base greater than $1 billion prior to the redetermination.
 Antero’s $4.5 Billion borrowing base was reaffirmed by its lender group, representing one of only five public E&P companies that
did not receive a reduction in its borrowing base thus far in the redetermination season (1)
– Driven by significant PDP reserve growth and increase in value of hedge position
8
$2,800
$3,000
$2,000
$1,150 $1,050 $1,050 $1,025
$4,000
$4,500
$4,000
$3,200
$3,250
$2,000
$1,525
$2,600
$1,400
$1,000
AR CHK COG CXO RRC WLL CNX SM OAS DNR EGN WPX MRD
$0
$500
$1,000
$1,500
$2,000
$2,500
$3,000
$3,500
$4,000
$4,500
BorrowingBaseAmount($mm)
$3,400
$1,250Antero was one of only five public
E&P companies (one of three
Appalachia operators) that did not
receive a reduction in their
borrowing base from March’s
redetermination process
Red New Borrowing Base
Borrowing Base Affirmed
$450
$1,250
$350
$ Amount of Reduction
$725
$1,550$375
$750
$200
$2,750
$1,750
Appalachian Company
PROVEN TRACK RECORD OF WELL COST REDUCTIONS
9
Marcellus Well Cost Reductions for a 9,000’ Lateral ($MM)(1)
NOTE: Based on statistics for drilled wells within each respective period.
1. Based on 200 ft. stage spacing.
2. Based on 175 ft. stage spacing.
$5.3 $4.6 $5.3 $4.7 $4.7 $4.7
$8.7
$7.8
$7.6 $7.1 $7.1
$5.6
$-
$2
$4
$6
$8
$10
$12
$14
$16
2014 Q4 2015 Q1 2015 Q2 2015 Q3 2015 Q4 2016 Q1
$MM
DRILLING AFE COMPLETION AFE
$14.0
$12.4 $12.9
$11.8 $11.8
29% Reduction in
Utica well costs since
Q4 2014
Utica Well Cost Reductions for a 9,000’ Lateral ($MM)(2)
$4.0 $3.8 $3.4 $3.2 $3.2 $3.1
$8.3
$7.3 $7.4 $7.0 $7.0
$5.4
$-
$2
$4
$6
$8
$10
$12
$14
2014 Q4 2015 Q1 2015 Q2 2015 Q3 2015 Q4 2016 Q1
$MM
DRILLING AFE COMPLETION AFE
$12.3
$11.1 $10.8
$10.2 $10.2
$0.95 / 1,000’
32% Reduction in
Marcellus well costs
since Q4 2014
17% Reduction vs. well
costs assumed in YE
2015 reserves
13% Reduction vs. well
costs assumed in YE
2015 reserves
$1.14 / 1,000’
Q4 2014 Q1 2015 Q2 2015 Q3 2015 Q4 2015 Q1 2016
COST COST
$8.5
$10.3
Marcellus ShaleUtica Shale Ohio
10
Operating Highlights
 Top 10 best drilling footage days in
Marcellus since 2009 have all occurred in
2016, including 5,291’ drilled in 24 hours in
West Virginia on the Charleston 3H
 Recently drilled and cased longest lateral
in company history at 14,024 feet
 Increased sand placement during
completions to 98% in Q1 2016
 Stayed within targeted zone for 98% of
lateral length drilled in Q1 2016
 Utilizing new floating casing procedure,
reducing casing run time by over 12 hours
 Increased proppant loading and shorter
stages in certain areas of the Marcellus
1. Based on statistics for wells completed within each respective period.
2. Year end 2016 forecast.
CONTINUOUS OPERATING IMPROVEMENT
(2)
Utica Marcellus
2014 2015 Q1 2016 Q1 2016 vs. 2014 2014 2015 Q1 2016 Q1 2016 vs. 2014
Activity Levels
Average Rigs Running 4 5 1 (75%) 14 9 7 (50%)
Average Completion Crews 2.0 3.0 1.5 (25%) 5.5 2.0 4.0 (27%)
Operational Improvements
Drilling Days 29 31 24 17% 29 24 21 28%
Average Lateral Length (Ft) 8,543 8,575 9,000 5% 8,052 8,910 9,000 12%
Stages per Well 47 49 51 9% 40 45 45 12%
Stage Length 183 175 175 4% 200 200 200 0%
Stages per Day 3.2 3.7 4.4 38% 3.2 3.5 3.8 19%
Well Cost & Performance Improvements
D&C per 1,000' $1.55 $1.36 $1.14 (26%) $1.34 $1.18 $0.95 (29%)
EUR per 1,000' (Bcf) (1)
1.4 1.6 1.6 14% 1.5 1.7 2.0 33%
EUR per 1,000' (Bcfe) (1)
1.5 1.8 1.8 20% 1.8 1.9 2.3 28%
(2)
1,194
1,128 1,117
990
1,031
1,016
958 956
1,084
1,126
1,274
1,304
1,337
1,418
1,480
1,500
800
900
1,000
1,100
1,200
1,300
1,400
1,500
1,600
Jan-15 Feb-15 Mar-15 Apr-15 May-15 Jun-15 Jul-15 Aug-15 Sep-15 Oct-15 Nov-15 Dec-15 Jan-16 Feb-16 Mar-16 2016
Plan
ProppantPlaced(lbs/ft)MARCELLUS PROPPANT PLACEMENT
11
Increased Proppant Load by 25% While Increasing Proppant Placement to 98%
Pilot testing demonstrated
improved recoveries while
maintaining well density
0
5
10
15
20
25
30
35
4,000 5,000 6,000 7,000 8,000 9,000 10,000 11,000 12,000 13,000
EUR(Bcfe)
Lateral Length (Feet)
All Wells Q1 2016 Wells
12
MARCELLUS IMPROVEMENTS DRIVING VALUE CREATION
Antero Marcellus EUR vs. Lateral Length(1)(2)
33 wells > 10,000’ lateral
length and 43 wells waiting
on completion ranging from
10,000’ to 14,000’
1. All 251 wells completed since 2014 when Antero transitioned to shorter stage length completions (SSL).
2. EUR’s include NGL processing (C3+) but assume ethane rejection.
Longer Laterals Better Well Economics
TBD
Current
completions
using 1,500 lbs/ft
of sand and 39
Bbls/ft of water
2016 wells
average 2.3
Bcfe/1,000’
98% sand placement for
1,200 lbs/ft drove
outperformance in 1Q
2016 compared to type
curve
39 wells > 20 Bcfe
High correlation of EURs
to lateral length
 While we have not changed our 1.7 Bcf/1,000' Marcellus project-wide type curve, we are seeing stronger EURs per 1,000' in a
significant portion of our Marcellus rich gas acreage as exhibited in our 2.0 Bcf/1,000' average for wells completed in the first quarter
with at least 30 days of production history
$8.7
$11.7
$5.2
$7.7
35%
45%
24%
30%
0%
10%
20%
30%
40%
50%
$0.0
$3.0
$6.0
$9.0
$12.0
$15.0
1.7 Bcf/1,000'
2.3 Bcfe/1,000'
2.0 Bcf/1,000'
2.7 Bcfe/1,000'
1.7 Bcf/1,000'
2.1 Bcfe/1,000'
2.0 Bcf/1,000'
2.5 Bcfe/1,000'
Pre-TaxROR
Pre-TaxPV-10
Pre-Tax PV-10 Pre-Tax ROR
Classification(1) Highly-Rich Gas/Condensate Highly-Rich Gas
BTU Regime 1275-1350 1275-1350 1200-1275 1200-1275
EUR (Bcfe): 20.8 24.4 18.8 22.1
EUR (MMBoe): 3.5 4.1 3.1 3.7
% Liquids: 33% 33% 24% 24%
Lateral Length (ft): 9,000 9,000 9,000 9,000
Well Cost ($MM): $8.5 $8.5 $8.5 $8.5
Bcf/1,000’ 1.7 2.0 1.7 2.0
Bcfe/1,000’: 2.3 2.7 2.1 2.5
Net F&D ($/Mcfe): $0.48 $0.41 $0.53 $0.45
Pre-Tax NPV10 ($MM): $8.7 $11.7 $5.3 $7.7
Pre-Tax ROR: 35% 45% 24% 30%
Payout (Years): 2.5 2.0 3.7 2.9
Breakeven NYMEX Gas Price ($/MMBtu)(5) $1.67 $1.40 $2.31 $2.05
Gross 3P Locations(3): 626 971
13
NYMEX
($/MMBtu)
WTI
($/Bbl)
C3+ NGL(2)
($/Bbl)
2016 $2.26 $41 $16
2017 $2.77 $45 $21
2018 $2.87 $47 $24
2019 $2.93 $49 $25
2020 $3.03 $50 $26
2021-25 $3.49 $51-$53 $27
Assumptions
 Natural Gas – 3/31/2016 strip
 Oil – 3/31/2016 strip
 NGLs – 37.5% of Oil Price
2016; 50% of Oil Price 2017+
4535
2016 Development Plan: Completions
1. 3/31/2016 pre-tax well economics based on a 9,000’ lateral, 3/31/2016 natural gas and WTI strip pricing for 2016-2025, flat thereafter, NGLs at 37.5% of WTI for 2016 and 50% of WTI thereafter,
and applicable firm transportation and operating costs including 50% of Antero Midstream fees. Well cost estimates include $1.2 million for road, pad and production facilities.
2. Pricing for a 1225 BTU y-grade ethane rejection barrel. NGLs at 37.5% of WTI for 2016 and 50% of WTI for 2017 and thereafter. NGL prices are forecast to increase in 2017 relative to WTI due to
projected in-service date of Mariner East 2 project allowing for a significant increase in AR NGL exports via ship.
3. Undeveloped well locations as of 12/31/2015.
4. Represents actual results for 1Q 2016.
5. Breakeven price for 15% pre-tax rate of return.
MARCELLUS UPSIDE POTENTIAL
Highly-Rich Gas/Condensate Highly-Rich Gas
(4) (4)
14
APPENDIX
14
ANTERO RESOURCES EBITDAX RECONCILIATION
15
EBITDAX Reconciliation
($ in millions) Quarter Ended LTM Ended
3/31/2016 3/31/2016
EBITDAX:
Net income including noncontrolling interest $10.7 $591.5
Commodity derivative fair value (gains) (279.9) (1,901.9)
Net cash receipts on settled derivatives instruments 324.3 996.1
Interest expense 63.3 244.4
Income tax expense (benefit) 4.8 333.3
Depreciation, depletion, amortization and accretion 192.2 720.9
Impairment of unproved properties 15.5 111.3
Exploration expense 1.0 3.5
Equity-based compensation expense 23.5 93.6
State franchise taxes 0.0 (0.1)
Contract termination and rig stacking 0.0 29.6
Consolidated Adjusted EBITDAX $355.4 $1,222.2

More Related Content

What's hot

Company website presentation february 2016
Company website presentation   february 2016Company website presentation   february 2016
Company website presentation february 2016
AnteroResources
 
Am website presentation february 2016
Am website presentation   february 2016Am website presentation   february 2016
Am website presentation february 2016
anteromidstream
 
Company website presentation (a) june 2016
Company website presentation (a)   june 2016Company website presentation (a)   june 2016
Company website presentation (a) june 2016
AnteroResources
 
Credit suisse conference presentation - february 2016
Credit suisse conference presentation - february 2016Credit suisse conference presentation - february 2016
Credit suisse conference presentation - february 2016
AnteroResources
 
Am website presentation june 2016
Am website presentation   june 2016Am website presentation   june 2016
Am website presentation june 2016
anteromidstream
 
Goldman conference presentation v f-02.01.16_revised 4
Goldman conference presentation   v f-02.01.16_revised 4Goldman conference presentation   v f-02.01.16_revised 4
Goldman conference presentation v f-02.01.16_revised 4
AnteroResources
 
Company website presentation (a) september 2016
Company website presentation (a)   september 2016Company website presentation (a)   september 2016
Company website presentation (a) september 2016
AnteroResources
 
Company website presentation july 2016
Company website presentation   july 2016Company website presentation   july 2016
Company website presentation july 2016
AnteroResources
 
Barclays conference presentation (website) september 2016 v5
Barclays conference presentation (website)   september 2016 v5Barclays conference presentation (website)   september 2016 v5
Barclays conference presentation (website) september 2016 v5
AnteroResources
 
Company website presentation (b) september 2016
Company website presentation (b)   september 2016Company website presentation (b)   september 2016
Company website presentation (b) september 2016
AnteroResources
 
Company website presentation (a) february 2016
Company website presentation (a)   february 2016Company website presentation (a)   february 2016
Company website presentation (a) february 2016
AnteroResources
 
Am website presentation (a) june 2016
Am website presentation (a)   june 2016Am website presentation (a)   june 2016
Am website presentation (a) june 2016
anteromidstream
 
Jp morgan hy conference presentation february 2016 v-f
Jp morgan hy conference presentation   february 2016 v-fJp morgan hy conference presentation   february 2016 v-f
Jp morgan hy conference presentation february 2016 v-f
AnteroResources
 
Company website presentation April 2016
Company website presentation April 2016Company website presentation April 2016
Company website presentation April 2016
AnteroResources
 
Company website presentation (b) october 2016
Company website presentation (b)   october 2016Company website presentation (b)   october 2016
Company website presentation (b) october 2016
AnteroResources
 
Company website presentation (a) january 2016
Company website presentation (a)   january 2016Company website presentation (a)   january 2016
Company website presentation (a) january 2016
AnteroResources
 
4Q 2015 Earnings Call Presentation
4Q 2015 Earnings Call Presentation 4Q 2015 Earnings Call Presentation
4Q 2015 Earnings Call Presentation
AnteroResources
 
Goldman conference presentation v f-01.06.16
Goldman conference presentation   v f-01.06.16Goldman conference presentation   v f-01.06.16
Goldman conference presentation v f-01.06.16
AnteroResources
 
Company website presentation december 2016
Company website presentation   december 2016Company website presentation   december 2016
Company website presentation december 2016
AnteroResources
 
Company website presentation january 2016
Company website presentation   january 2016 Company website presentation   january 2016
Company website presentation january 2016
AnteroResources
 

What's hot (20)

Company website presentation february 2016
Company website presentation   february 2016Company website presentation   february 2016
Company website presentation february 2016
 
Am website presentation february 2016
Am website presentation   february 2016Am website presentation   february 2016
Am website presentation february 2016
 
Company website presentation (a) june 2016
Company website presentation (a)   june 2016Company website presentation (a)   june 2016
Company website presentation (a) june 2016
 
Credit suisse conference presentation - february 2016
Credit suisse conference presentation - february 2016Credit suisse conference presentation - february 2016
Credit suisse conference presentation - february 2016
 
Am website presentation june 2016
Am website presentation   june 2016Am website presentation   june 2016
Am website presentation june 2016
 
Goldman conference presentation v f-02.01.16_revised 4
Goldman conference presentation   v f-02.01.16_revised 4Goldman conference presentation   v f-02.01.16_revised 4
Goldman conference presentation v f-02.01.16_revised 4
 
Company website presentation (a) september 2016
Company website presentation (a)   september 2016Company website presentation (a)   september 2016
Company website presentation (a) september 2016
 
Company website presentation july 2016
Company website presentation   july 2016Company website presentation   july 2016
Company website presentation july 2016
 
Barclays conference presentation (website) september 2016 v5
Barclays conference presentation (website)   september 2016 v5Barclays conference presentation (website)   september 2016 v5
Barclays conference presentation (website) september 2016 v5
 
Company website presentation (b) september 2016
Company website presentation (b)   september 2016Company website presentation (b)   september 2016
Company website presentation (b) september 2016
 
Company website presentation (a) february 2016
Company website presentation (a)   february 2016Company website presentation (a)   february 2016
Company website presentation (a) february 2016
 
Am website presentation (a) june 2016
Am website presentation (a)   june 2016Am website presentation (a)   june 2016
Am website presentation (a) june 2016
 
Jp morgan hy conference presentation february 2016 v-f
Jp morgan hy conference presentation   february 2016 v-fJp morgan hy conference presentation   february 2016 v-f
Jp morgan hy conference presentation february 2016 v-f
 
Company website presentation April 2016
Company website presentation April 2016Company website presentation April 2016
Company website presentation April 2016
 
Company website presentation (b) october 2016
Company website presentation (b)   october 2016Company website presentation (b)   october 2016
Company website presentation (b) october 2016
 
Company website presentation (a) january 2016
Company website presentation (a)   january 2016Company website presentation (a)   january 2016
Company website presentation (a) january 2016
 
4Q 2015 Earnings Call Presentation
4Q 2015 Earnings Call Presentation 4Q 2015 Earnings Call Presentation
4Q 2015 Earnings Call Presentation
 
Goldman conference presentation v f-01.06.16
Goldman conference presentation   v f-01.06.16Goldman conference presentation   v f-01.06.16
Goldman conference presentation v f-01.06.16
 
Company website presentation december 2016
Company website presentation   december 2016Company website presentation   december 2016
Company website presentation december 2016
 
Company website presentation january 2016
Company website presentation   january 2016 Company website presentation   january 2016
Company website presentation january 2016
 

Viewers also liked

JISC Design Studio Overview
JISC Design Studio OverviewJISC Design Studio Overview
JISC Design Studio Overview
JISC infoNet
 
Planificador proyecto enriquecido_con_tic.docx
Planificador proyecto enriquecido_con_tic.docxPlanificador proyecto enriquecido_con_tic.docx
Planificador proyecto enriquecido_con_tic.docx
Stefany Urbano
 
Danny Thorpe Key conventions
Danny Thorpe Key conventionsDanny Thorpe Key conventions
Danny Thorpe Key conventionsbir
 
Company website presentation december 2015
Company website presentation   december 2015Company website presentation   december 2015
Company website presentation december 2015
AnteroResources
 
Pre lim task analysis sheet
Pre lim task analysis sheetPre lim task analysis sheet
Pre lim task analysis sheetbir
 
Quimica
QuimicaQuimica
CURRICULUM_VITAE_OF_BONGANI_GLEN[1]
CURRICULUM_VITAE_OF_BONGANI_GLEN[1]CURRICULUM_VITAE_OF_BONGANI_GLEN[1]
CURRICULUM_VITAE_OF_BONGANI_GLEN[1]bongani sibanyoni
 
Proyecto Integrado Plástica
Proyecto  Integrado PlásticaProyecto  Integrado Plástica
Proyecto Integrado Plástica
IES Antonio Gala
 
Company website presentation (b) january 2016
Company website presentation (b)   january 2016Company website presentation (b)   january 2016
Company website presentation (b) january 2016
AnteroResources
 
Ley Telecomunicaciones
Ley TelecomunicacionesLey Telecomunicaciones
Ley Telecomunicacionestelecom2009
 
Sesión de validación de conceptos
Sesión de validación de conceptosSesión de validación de conceptos
Sesión de validación de conceptosNikki Valenzuela
 
Design by Brad Campbell
Design by Brad CampbellDesign by Brad Campbell
Design by Brad Campbell
Brad Campbell
 
November 2016 corporate presentation final
November 2016 corporate presentation finalNovember 2016 corporate presentation final
November 2016 corporate presentation final
Denbury
 
hydroxlyapatite -glass &ceramic dept(ruet)
hydroxlyapatite -glass &ceramic dept(ruet)hydroxlyapatite -glass &ceramic dept(ruet)
hydroxlyapatite -glass &ceramic dept(ruet)
isopik
 
2017 credit suisse final
2017 credit suisse final2017 credit suisse final
2017 credit suisse final
Denbury
 
January 2017 Real Estate Market Report, The Woodlands, TX
January 2017 Real Estate Market Report, The Woodlands, TXJanuary 2017 Real Estate Market Report, The Woodlands, TX
January 2017 Real Estate Market Report, The Woodlands, TX
Referred Realty Group
 
Аналітична характеристика сертифікаційних робіт та методичні рекомендації щод...
Аналітична характеристика сертифікаційних робіт та методичні рекомендації щод...Аналітична характеристика сертифікаційних робіт та методичні рекомендації щод...
Аналітична характеристика сертифікаційних робіт та методичні рекомендації щод...
Андрій Лубенець
 

Viewers also liked (20)

JISC Design Studio Overview
JISC Design Studio OverviewJISC Design Studio Overview
JISC Design Studio Overview
 
Planificador proyecto enriquecido_con_tic.docx
Planificador proyecto enriquecido_con_tic.docxPlanificador proyecto enriquecido_con_tic.docx
Planificador proyecto enriquecido_con_tic.docx
 
Danny Thorpe Key conventions
Danny Thorpe Key conventionsDanny Thorpe Key conventions
Danny Thorpe Key conventions
 
Company website presentation december 2015
Company website presentation   december 2015Company website presentation   december 2015
Company website presentation december 2015
 
Pre lim task analysis sheet
Pre lim task analysis sheetPre lim task analysis sheet
Pre lim task analysis sheet
 
Quimica
QuimicaQuimica
Quimica
 
curriculum GLP
curriculum GLPcurriculum GLP
curriculum GLP
 
CURRICULUM_VITAE_OF_BONGANI_GLEN[1]
CURRICULUM_VITAE_OF_BONGANI_GLEN[1]CURRICULUM_VITAE_OF_BONGANI_GLEN[1]
CURRICULUM_VITAE_OF_BONGANI_GLEN[1]
 
Proyecto Integrado Plástica
Proyecto  Integrado PlásticaProyecto  Integrado Plástica
Proyecto Integrado Plástica
 
05
0505
05
 
Company website presentation (b) january 2016
Company website presentation (b)   january 2016Company website presentation (b)   january 2016
Company website presentation (b) january 2016
 
Ley Telecomunicaciones
Ley TelecomunicacionesLey Telecomunicaciones
Ley Telecomunicaciones
 
Quanta Consulting Work for Us
Quanta Consulting Work for UsQuanta Consulting Work for Us
Quanta Consulting Work for Us
 
Sesión de validación de conceptos
Sesión de validación de conceptosSesión de validación de conceptos
Sesión de validación de conceptos
 
Design by Brad Campbell
Design by Brad CampbellDesign by Brad Campbell
Design by Brad Campbell
 
November 2016 corporate presentation final
November 2016 corporate presentation finalNovember 2016 corporate presentation final
November 2016 corporate presentation final
 
hydroxlyapatite -glass &ceramic dept(ruet)
hydroxlyapatite -glass &ceramic dept(ruet)hydroxlyapatite -glass &ceramic dept(ruet)
hydroxlyapatite -glass &ceramic dept(ruet)
 
2017 credit suisse final
2017 credit suisse final2017 credit suisse final
2017 credit suisse final
 
January 2017 Real Estate Market Report, The Woodlands, TX
January 2017 Real Estate Market Report, The Woodlands, TXJanuary 2017 Real Estate Market Report, The Woodlands, TX
January 2017 Real Estate Market Report, The Woodlands, TX
 
Аналітична характеристика сертифікаційних робіт та методичні рекомендації щод...
Аналітична характеристика сертифікаційних робіт та методичні рекомендації щод...Аналітична характеристика сертифікаційних робіт та методичні рекомендації щод...
Аналітична характеристика сертифікаційних робіт та методичні рекомендації щод...
 

Similar to 1 q 2016 earnings call presentation 04.28.16_vf2

Company website presentation October 2016
Company website presentation October 2016Company website presentation October 2016
Company website presentation October 2016
AnteroResources
 
Company website presentation (a) december 2016
Company website presentation (a)   december 2016Company website presentation (a)   december 2016
Company website presentation (a) december 2016
AnteroResources
 
Company website presentation november 2016
Company website presentation   november 2016Company website presentation   november 2016
Company website presentation november 2016
AnteroResources
 
Company website presentation october 2016
Company website presentation   october 2016Company website presentation   october 2016
Company website presentation october 2016
AnteroResources
 
Company website presentation april 2016
Company website presentation   april 2016Company website presentation   april 2016
Company website presentation april 2016
AnteroResources
 
Company website presentation march 2016
Company website presentation   march 2016Company website presentation   march 2016
Company website presentation march 2016
AnteroResources
 
Company website presentation (b) march 2017
Company website presentation (b)   march 2017Company website presentation (b)   march 2017
Company website presentation (b) march 2017
AnteroResources
 
Am website presentation november 2016
Am website presentation   november 2016Am website presentation   november 2016
Am website presentation november 2016
anteromidstream
 
Am website presentation (a) october 2016
Am website presentation (a)   october 2016Am website presentation (a)   october 2016
Am website presentation (a) october 2016
anteromidstream
 
Am website presentation october 2016
Am website presentation   october 2016Am website presentation   october 2016
Am website presentation october 2016
anteromidstream
 
Company website presentation april 2017
Company website presentation   april 2017Company website presentation   april 2017
Company website presentation april 2017
AnteroResources
 
Company Overview - March 2015
Company Overview - March 2015Company Overview - March 2015
Company Overview - March 2015
AnteroResources
 
Company website presentation march 2017
Company website presentation   march 2017Company website presentation   march 2017
Company website presentation march 2017
AnteroResources
 
Am website presentation (a) december 2016
Am website presentation (a)   december 2016Am website presentation (a)   december 2016
Am website presentation (a) december 2016
anteromidstream
 
Am website presentation december 2016
Am website presentation   december 2016Am website presentation   december 2016
Am website presentation december 2016
anteromidstream
 
Am website presentation (b) january 2016
Am website presentation (b)   january 2016Am website presentation (b)   january 2016
Am website presentation (b) january 2016
anteromidstream
 
Company website presentation september 2015
Company website presentation   september 2015Company website presentation   september 2015
Company website presentation september 2015
AnteroResources
 
Am website presentation (a) september 2016
Am website presentation (a)   september 2016Am website presentation (a)   september 2016
Am website presentation (a) september 2016
anteromidstream
 

Similar to 1 q 2016 earnings call presentation 04.28.16_vf2 (18)

Company website presentation October 2016
Company website presentation October 2016Company website presentation October 2016
Company website presentation October 2016
 
Company website presentation (a) december 2016
Company website presentation (a)   december 2016Company website presentation (a)   december 2016
Company website presentation (a) december 2016
 
Company website presentation november 2016
Company website presentation   november 2016Company website presentation   november 2016
Company website presentation november 2016
 
Company website presentation october 2016
Company website presentation   october 2016Company website presentation   october 2016
Company website presentation october 2016
 
Company website presentation april 2016
Company website presentation   april 2016Company website presentation   april 2016
Company website presentation april 2016
 
Company website presentation march 2016
Company website presentation   march 2016Company website presentation   march 2016
Company website presentation march 2016
 
Company website presentation (b) march 2017
Company website presentation (b)   march 2017Company website presentation (b)   march 2017
Company website presentation (b) march 2017
 
Am website presentation november 2016
Am website presentation   november 2016Am website presentation   november 2016
Am website presentation november 2016
 
Am website presentation (a) october 2016
Am website presentation (a)   october 2016Am website presentation (a)   october 2016
Am website presentation (a) october 2016
 
Am website presentation october 2016
Am website presentation   october 2016Am website presentation   october 2016
Am website presentation october 2016
 
Company website presentation april 2017
Company website presentation   april 2017Company website presentation   april 2017
Company website presentation april 2017
 
Company Overview - March 2015
Company Overview - March 2015Company Overview - March 2015
Company Overview - March 2015
 
Company website presentation march 2017
Company website presentation   march 2017Company website presentation   march 2017
Company website presentation march 2017
 
Am website presentation (a) december 2016
Am website presentation (a)   december 2016Am website presentation (a)   december 2016
Am website presentation (a) december 2016
 
Am website presentation december 2016
Am website presentation   december 2016Am website presentation   december 2016
Am website presentation december 2016
 
Am website presentation (b) january 2016
Am website presentation (b)   january 2016Am website presentation (b)   january 2016
Am website presentation (b) january 2016
 
Company website presentation september 2015
Company website presentation   september 2015Company website presentation   september 2015
Company website presentation september 2015
 
Am website presentation (a) september 2016
Am website presentation (a)   september 2016Am website presentation (a)   september 2016
Am website presentation (a) september 2016
 

More from AnteroResources

Howard weil conference presentation march 2017 v-f (small)
Howard weil conference presentation   march 2017 v-f (small)Howard weil conference presentation   march 2017 v-f (small)
Howard weil conference presentation march 2017 v-f (small)
AnteroResources
 
Credit suisse conference presentation february 2017 v-f
Credit suisse conference presentation   february 2017 v-fCredit suisse conference presentation   february 2017 v-f
Credit suisse conference presentation february 2017 v-f
AnteroResources
 
Company website presentation (c) february 2017
Company website presentation (c)   february 2017Company website presentation (c)   february 2017
Company website presentation (c) february 2017
AnteroResources
 
Company website presentation (b) february 2017
Company website presentation (b)   february 2017Company website presentation (b)   february 2017
Company website presentation (b) february 2017
AnteroResources
 
Company website presentation (a) february 2017
Company website presentation (a)   february 2017Company website presentation (a)   february 2017
Company website presentation (a) february 2017
AnteroResources
 
Company website presentation february 2017
Company website presentation   february 2017Company website presentation   february 2017
Company website presentation february 2017
AnteroResources
 
Goldman Sachs Global Energy Conference
Goldman Sachs Global Energy ConferenceGoldman Sachs Global Energy Conference
Goldman Sachs Global Energy Conference
AnteroResources
 
Company website presentation september 2016
Company website presentation   september 2016Company website presentation   september 2016
Company website presentation september 2016
AnteroResources
 
Company website presentation august 2016
Company website presentation   august 2016Company website presentation   august 2016
Company website presentation august 2016
AnteroResources
 
Company website presentation (a) july 2016
Company website presentation (a)   july 2016Company website presentation (a)   july 2016
Company website presentation (a) july 2016
AnteroResources
 

More from AnteroResources (10)

Howard weil conference presentation march 2017 v-f (small)
Howard weil conference presentation   march 2017 v-f (small)Howard weil conference presentation   march 2017 v-f (small)
Howard weil conference presentation march 2017 v-f (small)
 
Credit suisse conference presentation february 2017 v-f
Credit suisse conference presentation   february 2017 v-fCredit suisse conference presentation   february 2017 v-f
Credit suisse conference presentation february 2017 v-f
 
Company website presentation (c) february 2017
Company website presentation (c)   february 2017Company website presentation (c)   february 2017
Company website presentation (c) february 2017
 
Company website presentation (b) february 2017
Company website presentation (b)   february 2017Company website presentation (b)   february 2017
Company website presentation (b) february 2017
 
Company website presentation (a) february 2017
Company website presentation (a)   february 2017Company website presentation (a)   february 2017
Company website presentation (a) february 2017
 
Company website presentation february 2017
Company website presentation   february 2017Company website presentation   february 2017
Company website presentation february 2017
 
Goldman Sachs Global Energy Conference
Goldman Sachs Global Energy ConferenceGoldman Sachs Global Energy Conference
Goldman Sachs Global Energy Conference
 
Company website presentation september 2016
Company website presentation   september 2016Company website presentation   september 2016
Company website presentation september 2016
 
Company website presentation august 2016
Company website presentation   august 2016Company website presentation   august 2016
Company website presentation august 2016
 
Company website presentation (a) july 2016
Company website presentation (a)   july 2016Company website presentation (a)   july 2016
Company website presentation (a) july 2016
 

Recently uploaded

Snam 2023-27 Industrial Plan - Financial Presentation
Snam 2023-27 Industrial Plan - Financial PresentationSnam 2023-27 Industrial Plan - Financial Presentation
Snam 2023-27 Industrial Plan - Financial Presentation
Valentina Ottini
 
Osisko Gold Royalties Ltd - Corporate Presentation, June 2024
Osisko Gold Royalties Ltd - Corporate Presentation, June 2024Osisko Gold Royalties Ltd - Corporate Presentation, June 2024
Osisko Gold Royalties Ltd - Corporate Presentation, June 2024
Osisko Gold Royalties Ltd
 
Osisko Development - Investor Presentation - June 24
Osisko Development - Investor Presentation - June 24Osisko Development - Investor Presentation - June 24
Osisko Development - Investor Presentation - June 24
Philip Rabenok
 
一比一原版(UW毕业证)华盛顿大学毕业证成绩单专业办理
一比一原版(UW毕业证)华盛顿大学毕业证成绩单专业办理一比一原版(UW毕业证)华盛顿大学毕业证成绩单专业办理
一比一原版(UW毕业证)华盛顿大学毕业证成绩单专业办理
ybout
 
2024-deutsche-bank-global-consumer-conference.pdf
2024-deutsche-bank-global-consumer-conference.pdf2024-deutsche-bank-global-consumer-conference.pdf
2024-deutsche-bank-global-consumer-conference.pdf
Sysco_Investors
 
Collective Mining | Corporate Presentation - June 2024
Collective Mining | Corporate Presentation - June 2024Collective Mining | Corporate Presentation - June 2024
Collective Mining | Corporate Presentation - June 2024
CollectiveMining1
 
Corporate Presentation Probe June 2024.pdf
Corporate Presentation Probe June 2024.pdfCorporate Presentation Probe June 2024.pdf
Corporate Presentation Probe June 2024.pdf
Probe Gold
 

Recently uploaded (7)

Snam 2023-27 Industrial Plan - Financial Presentation
Snam 2023-27 Industrial Plan - Financial PresentationSnam 2023-27 Industrial Plan - Financial Presentation
Snam 2023-27 Industrial Plan - Financial Presentation
 
Osisko Gold Royalties Ltd - Corporate Presentation, June 2024
Osisko Gold Royalties Ltd - Corporate Presentation, June 2024Osisko Gold Royalties Ltd - Corporate Presentation, June 2024
Osisko Gold Royalties Ltd - Corporate Presentation, June 2024
 
Osisko Development - Investor Presentation - June 24
Osisko Development - Investor Presentation - June 24Osisko Development - Investor Presentation - June 24
Osisko Development - Investor Presentation - June 24
 
一比一原版(UW毕业证)华盛顿大学毕业证成绩单专业办理
一比一原版(UW毕业证)华盛顿大学毕业证成绩单专业办理一比一原版(UW毕业证)华盛顿大学毕业证成绩单专业办理
一比一原版(UW毕业证)华盛顿大学毕业证成绩单专业办理
 
2024-deutsche-bank-global-consumer-conference.pdf
2024-deutsche-bank-global-consumer-conference.pdf2024-deutsche-bank-global-consumer-conference.pdf
2024-deutsche-bank-global-consumer-conference.pdf
 
Collective Mining | Corporate Presentation - June 2024
Collective Mining | Corporate Presentation - June 2024Collective Mining | Corporate Presentation - June 2024
Collective Mining | Corporate Presentation - June 2024
 
Corporate Presentation Probe June 2024.pdf
Corporate Presentation Probe June 2024.pdfCorporate Presentation Probe June 2024.pdf
Corporate Presentation Probe June 2024.pdf
 

1 q 2016 earnings call presentation 04.28.16_vf2

  • 1. First Quarter 2016 Earnings Call Presentation April 28, 2016
  • 2. FORWARD-LOOKING STATEMENTS This presentation contains forward-looking statements within the meaning of Section 27A of the Securities Act of 1933 and Section 21E of the Securities Exchange Act of 1934. All statements, other than statements of historical facts, included in this presentation that address activities, events or developments that Antero Resources Corporation and its subsidiaries (collectively, the “Company” or “Antero”) expects, believes or anticipates will or may occur in the future are forward-looking statements. The words “believe,” “expect,” “anticipate,” “plan,” “intend,” “estimate,” “project,” “foresee,” “should,” “would,” “could,” or other similar expressions are intended to identify forward-looking statements. However, the absence of these words does not mean that the statements are not forward-looking. Without limiting the generality of the foregoing, forward- looking statements contained in this presentation specifically include estimates of the Company’s reserves, expectations of plans, strategies, objectives and anticipated financial and operating results of the Company, including as to the Company’s drilling program, production, hedging activities, capital expenditure levels and other guidance included in this presentation. These statements are based on certain assumptions made by the Company based on management’s experience and perception of historical trends, current conditions, anticipated future developments and other factors believed to be appropriate. Such statements are subject to a number of assumptions, risks and uncertainties, many of which are beyond the control of the Company, which may cause actual results to differ materially from those implied or expressed by the forward-looking statements. These include the factors discussed or referenced under the heading “Item 1A. Risk Factors” in our Annual Report on Form 10-K for the year ended December 31, 2015 and in the Company’s subsequent filings with the SEC. The Company cautions you that these forward-looking statements are subject to all of the risks and uncertainties, most of which are difficult to predict and many of which are beyond our control, incident to the exploration for and development, production, gathering and sale of natural gas and oil. These risks include, but are not limited to, commodity price volatility, inflation, lack of availability of drilling and production equipment and services, environmental risks, drilling and other operating risks, regulatory changes, the uncertainty inherent in estimating natural gas and oil reserves and in projecting future rates of production, cash flow and access to capital, the timing of development expenditures, and the other risks described under the heading “Risk Factors” in our Annual Report on Form 10-K for the year ended December 31, 2015 and in the Company’s subsequent filings with the SEC. Any forward-looking statement speaks only as of the date on which such statement is made and the Company undertakes no obligation to correct or update any forward-looking statement, whether as a result of new information, future events or otherwise, except as required by applicable law. 1 Antero Resources Corporation is denoted as “AR” and Antero Midstream Partners LP is denoted as “AM” in the presentation, which are their respective New York Stock Exchange ticker symbols.
  • 3. $0.00 $1.00 $2.00 $3.00 $4.00 $5.00 $6.00 $0 $50 $100 $150 $200 $250 $300 $350 $MM 2  Hedging is a key component of Antero’s business model which includes development of a large, repeatable drilling inventory – Locks in higher returns in a low commodity price environment and reduces the amount of time for well payouts, thereby enhancing liquidity  Antero has realized $2.1 billion of gains on commodity hedges since 2009 – Gains realized in 28 of last 29 quarters, or 97% of the quarters since 2009 ● Based on Antero’s hedge position and strip pricing as of 3/31/2016, the unrealized commodity derivative value is $3.1 billion ● Significant additional hedge capacity remains under the credit facility hedging covenant for 2020 – 2022 period Quarterly Realized Hedge Gains / (Losses) Realized Hedge Gains Projected Hedge Gains NYMEX Natural Gas Historical Spot Prices ($/MMBtu) NYMEX Natural Gas Futures Prices 03/31/16 3.6 Tcfe Hedged at average price of $3.71/Mcfe through 2022 Average Hedge Prices ($/MMBtu) $3.36 $3.91 $3.57 $3.91 $3.70 $3.66 $3.24 $3.1 Billion in Projected Hedge Gains Through 2022Realized $2.1 Billion in Hedge Gains Since 2009 HEDGE STRATEGY PRODUCES CONSISTENT RESULTS AND STABILITY (1) 1. Represents average hedge price for nine months ending 12/31/2016.
  • 4. Pre Post In-Service In-Service Projected 2016 Average Volume (BBtu/d) DOMS Priced Sales 329 0 TETCO M2 Priced Sales 321 0 TCO Priced Sales 0 54 Firm Sales (TCO / Nymex) 0 595 Total 650 650 2016 Strip Pricing ($/MMBtu) DOMS (1) $1.31 N/A TETCO M2 (1) $1.29 N/A TCO (1) N/A $2.04 Firm Sales (TCO / Nymex) (2) N/A $1.94 Annual Revenue ($MM) DOMS $157.1 $0.0 TETCO M2 151.7 0.0 TCO Pool Sales (1) 0.0 40.6 Firm Sales (TCO / Nymex) (2) 0.0 422.5 $308.7 $463.1 Incremental Revenue $154.3 Less: Incremental Firm Transport Costs: (28.7) Projected Incremental EBITDA $125.6 PROJECTED INCREMENTAL EBITDA FROM STONEWALL 1. 2016 Strip pricing as of March 31, 2016. 2. Blended price based on contracted firm sales volumes with third parties. Existing TCO capacity of 582 MMcf/d with additional 1.1 Bcf/d of Stonewall transportation and sales has eliminated all Marcellus swing gas sales to Dominion South and TETCO M2 thus far in 2016 and is expected for the full year of 2016 3 2016 DOMS Strip: $1.31 Variance to Nymex ($0.87) Variance to TCO ($0.73) 2016 TETCO M2 Strip: $1.29 Variance to Nymex ($0.88) Variance to TCO ($0.75)
  • 5. $2.03 AR P1 P5 P3 P2 P4 $355 AR P5 P1 P3 P2 P4 3Q 2015 $1.97 AR P3 P5 P4 P2 P1 $2.03 AR P3 P2 P1 P5 P4 $2.56 $0.00 $0.50 $1.00 $1.50 $2.00 $2.50 $3.00 P2 AR P5 P3 P4 P1 $308 AR P5 P3 P2 P4 P1 $1.90 AR P3 P4 P2 P5 P1 $291 P5 AR P3 P2 P4 P1 $269 P5 AR P2 P3 P4 P1 $355 $0 $100 $200 $300 $400 $500 P5 P2 AR P4 P3 P1 HIGHEST EBITDAX & MARGINS AMONG PEERS Quarterly Appalachian Peer Group EBITDAX Margin ($/Mcfe)(1) Quarterly Appalachian Peer Group EBITDAX ($MM)(1) 1Q 2015 2Q 2015 Note: AR and EQT EBITDAX margin excludes EBITDA from midstream MLP associated with noncontrolling interest. AR consolidated EBITDAX margin for 1Q 2016 was $2.22/Mcfe. CNX excludes EBITDAX contribution from coal operations. 1. Source: Public data from form 10-Qs and 10-Ks. Peers include COG, CNX, EQT , RRC and SWN. 4Q 2015 1Q 20161Q 2015 2Q 2015 AR Peer Group Ranking – Top Tier #2 #1 #1 #1 #1 AR Peer Group Ranking – Improving Over Time #3 #2 #2 #1 #1 Y-O-Y AR: ↔ $0MM Peer Avg:  $170MM NYMEX Gas: 30% NYMEX Oil:  32% Y-O-Y AR:  21% Peer Avg:  46% NYMEX Gas:  30% NYMEX Oil:  32% 4 3Q 2015 AR has ranked first for both the highest EBITDAX and EBITDAX margin among Appalachian peers for the second straight quarter 4Q 2015 1Q 2016 TBA TBA TBA TBA TBA TBA
  • 6. 3.7x 4.9x 0.6x 1.5x 3.0x 3.4x 3.8x 4.6x 1.3x 2.4x 5.6x 0.0x 1.0x 2.0x 3.0x 4.0x 5.0x 6.0x AR Peer 1 Peer 2 Peer 3 Peer 4 Peer 5 YE 2015 Leverage YE 2016E Leverage 17% 15% 19% 3% 2% (11%) 12% (6%) (5%) (27%) (44%)-50% -40% -30% -20% -10% 0% 10% 20% AR Peer 1 Peer 2 Peer 3 Peer 4 Peer 5 2016E Production Growth 2016E EBITDAX Growth CONTINUED MEASURED GROWTH 5 2015 vs. 2016E Year-End Net Debt / LTM EBITDAX(1),(2) NOTE: Peers include CNX, COG, EQT, RRC and SWN. 1. 2015 and 2016E production and EBITDAX per Bloomberg Street Consensus estimates. Peer 5 2016E production and EBITDAX per company issued press release. 2. 2016E Debt to EBITDAX assumes year-end 2016E debt divided by 2016E EBITDAX. 2016E debt calculated as 2015 YE debt, less free cash flow. Free cash flow is equal to 2016E EBITDAX, less 2016E interest expense per Bloomberg consensus estimates, less 2016 capital spending guidance per company press releases. 3. AR pro forma for secondary offering of 8.0 million AM units on 3/24/2016 for net proceeds of $178 million. 9.8x Antero continues to grow its production and cash flow through the commodity price downturn while also maintaining prudent leverage metrics 2016E EBITDAX and Production Growth(1) Antero is the only one of its Appalachian peers that is growing cash flow in line with production growth (66%) (3)
  • 7. 6 1. Revenues represent annual mark-to-market value based on 3/31/2016 strip pricing, including 1Q 2016 actual hedge gain of $324 million. 2. Consensus EBITDAX as of 3/31/2016. 3. Includes targeted drilling and completion cost improvements.  Antero can achieve 17% year-over-year net production growth for 2016 by spending only $675 million, or approximately $500 million less than the $1.2 billion of expected hedge revenues for the year(1)  Incremental growth capital of $625 million in 2016 positions Antero to achieve its 20% year-over-year targeted net production growth in 2017, while only having to spend $875 million in 2017 LOW MAINTENANCE CAPITAL PROVIDES FLEXIBILITY AND UPSIDE Maintenance Capital $275 Maintenance Capital $500 2016 Growth Capital $400 2017 Growth Capital $375 2017 Growth Capital $625 $0 $200 $400 $600 $800 $1,000 $1,200 $1,400 $1,600 2016 2017 $1.3 Bn D&C Budget 0% Y-O-Y Growth of 1,493 MMcfe/d 17% Y-O-Y Growth Contributes to 20% Y-O-Y Growth Target for 2017 0% Y-O-Y Growth of 1,750 MMcfe/d 20% Y-O-Y Growth Target for $875 MM Capex in 2017 Hedge Revenues $1,156MM(1) Hedge Revenues $572MM(1) $MM 2016 2017 Prior year DUCs completed 16 70 D&C Capital – DUCs ($MM) $125 $425 Driven by the DUC inventory, continued capital efficiency and volumes sold forward at attractive prices, Antero is positioned to achieve its 2016 guidance and 2017 production target with modest outspend 2018 Growth Capital TBD (3) Consensus EBITDAX(2) Consensus EBITDAX(2)
  • 8. $3.7 $11.2 $13.9 $20.4 $26.7 $3.1 $2.5 $0.9 ($0.3) ($1.6) $2.4 $2.4 $2.4 $2.4 $2.4 $9.2 $16.1 $17.3 $22.5 $27.6 ($5.0) $0.0 $5.0 $10.0 $15.0 $20.0 $25.0 $30.0 $35.0 $40.0 $45.0 SEC Pricing 12/31/2015 Strip $60 Oil $67.50 Oil $75 Oil $3.50 Gas $4.00 Gas $4.50 Gas AR Ownership in AM shares ($B) Hedge Value Pre-Tax PV-10 ($B) 3P Reserves Pre-Tax PV-10 ($B) FLEXIBILITY & UPSIDE 7  As the most active operator in Appalachia, Antero has kept its workforce intact while also preserving the ability to accelerate efficiently when commodity prices recover  Accelerated development is further enhanced by Antero’s ability to flow incremental production to the most favorable price indices using Antero’s firm transport portfolio  Despite its large hedge position, Antero has tremendous leverage to natural gas and NGL prices due to scale of its 3P reserves and development infrastructure Net 3P Reserve/Hedge pre-tax PV-10 plus AM ownership less net debt, Per Share(3) $45 $64 $83 Increase in pre-tax PV10 value does not include the addition of locations; represents upside in prices only on 12/31/15 locations Note: Assumes NGL prices equal to 37.5% of WTI for 2016 and 50% of WTI thereafter. All PV-10 values are on a pre-tax basis. 1. Total 3P locations of 3,719 less 110 planned completions in 2016. 2. Strip pricing as of December 31, 2015 for each of the first ten years and flat thereafter. $54 Oil; $3.23 Gas Increase in reserve pre-tax PV-10 is well in excess of hedge PV-10 lost at higher prices 3P Reserve/Hedge Pre-Tax PV-10 Upside Value(3) Substantial InventoryOptionality to Accelerate Development $41 Remaining Undeveloped 3P Locations(1) 3,609 85% Producing Wells at YE 2015 540 wells producing 1.5 Bcfe/d net (13%) 2016E Well Completions 110 (2%) 3. PV-10 of 3P reserves and hedges less $4.7 billion of net debt as of 3/31/2016, plus market value of 108.9 million AM units owned by AR (as of 3/31/2016). (2) 0 500 1,000 1,500 2,000 2,500 0 5 10 15 20 25 2013 2014 2015 2016E 2017E Average Rigs Ability to triple rig count from 2016 levels, as demonstrated by historical rig utilization # of Antero Rigs MMcfe/d AR Net Production 2016 Guidance 2017 Target ($Bn)
  • 9. Old Borrowing Base $4,500 $4,000 $3,400 $3,250 $3,000 $4,000 $2,000 $2,000 $1,525 $2,600 $1,400 $1,750 $1,000 New Borrowing Base $4,500 $4,000 $3,200 $2,800 $3,000 $2,750 $2,000 $1,250 $1,150 $1,050 $1,050 $1,025 $1,000 Result -- -- ($200) ($450) -- ($1,250) -- ($750) ($375) ($1,550) ($350) ($725) -- Average % change -- -- (6%) (14%) -- (31%) -- (38%) (25%) (60%) (25%) (41%) -- (30%) SPRING 2016 BORROWING BASE REAFFIRMED Borrowing Base Actions (1) Note: Represents Spring 2016 borrowing base actions for all public companies with a borrowing base greater than $1 billion prior to the redetermination.  Antero’s $4.5 Billion borrowing base was reaffirmed by its lender group, representing one of only five public E&P companies that did not receive a reduction in its borrowing base thus far in the redetermination season (1) – Driven by significant PDP reserve growth and increase in value of hedge position 8 $2,800 $3,000 $2,000 $1,150 $1,050 $1,050 $1,025 $4,000 $4,500 $4,000 $3,200 $3,250 $2,000 $1,525 $2,600 $1,400 $1,000 AR CHK COG CXO RRC WLL CNX SM OAS DNR EGN WPX MRD $0 $500 $1,000 $1,500 $2,000 $2,500 $3,000 $3,500 $4,000 $4,500 BorrowingBaseAmount($mm) $3,400 $1,250Antero was one of only five public E&P companies (one of three Appalachia operators) that did not receive a reduction in their borrowing base from March’s redetermination process Red New Borrowing Base Borrowing Base Affirmed $450 $1,250 $350 $ Amount of Reduction $725 $1,550$375 $750 $200 $2,750 $1,750 Appalachian Company
  • 10. PROVEN TRACK RECORD OF WELL COST REDUCTIONS 9 Marcellus Well Cost Reductions for a 9,000’ Lateral ($MM)(1) NOTE: Based on statistics for drilled wells within each respective period. 1. Based on 200 ft. stage spacing. 2. Based on 175 ft. stage spacing. $5.3 $4.6 $5.3 $4.7 $4.7 $4.7 $8.7 $7.8 $7.6 $7.1 $7.1 $5.6 $- $2 $4 $6 $8 $10 $12 $14 $16 2014 Q4 2015 Q1 2015 Q2 2015 Q3 2015 Q4 2016 Q1 $MM DRILLING AFE COMPLETION AFE $14.0 $12.4 $12.9 $11.8 $11.8 29% Reduction in Utica well costs since Q4 2014 Utica Well Cost Reductions for a 9,000’ Lateral ($MM)(2) $4.0 $3.8 $3.4 $3.2 $3.2 $3.1 $8.3 $7.3 $7.4 $7.0 $7.0 $5.4 $- $2 $4 $6 $8 $10 $12 $14 2014 Q4 2015 Q1 2015 Q2 2015 Q3 2015 Q4 2016 Q1 $MM DRILLING AFE COMPLETION AFE $12.3 $11.1 $10.8 $10.2 $10.2 $0.95 / 1,000’ 32% Reduction in Marcellus well costs since Q4 2014 17% Reduction vs. well costs assumed in YE 2015 reserves 13% Reduction vs. well costs assumed in YE 2015 reserves $1.14 / 1,000’ Q4 2014 Q1 2015 Q2 2015 Q3 2015 Q4 2015 Q1 2016 Q4 2014 Q1 2015 Q2 2015 Q3 2015 Q4 2015 Q1 2016 COST COST $8.5 $10.3
  • 11. Marcellus ShaleUtica Shale Ohio 10 Operating Highlights  Top 10 best drilling footage days in Marcellus since 2009 have all occurred in 2016, including 5,291’ drilled in 24 hours in West Virginia on the Charleston 3H  Recently drilled and cased longest lateral in company history at 14,024 feet  Increased sand placement during completions to 98% in Q1 2016  Stayed within targeted zone for 98% of lateral length drilled in Q1 2016  Utilizing new floating casing procedure, reducing casing run time by over 12 hours  Increased proppant loading and shorter stages in certain areas of the Marcellus 1. Based on statistics for wells completed within each respective period. 2. Year end 2016 forecast. CONTINUOUS OPERATING IMPROVEMENT (2) Utica Marcellus 2014 2015 Q1 2016 Q1 2016 vs. 2014 2014 2015 Q1 2016 Q1 2016 vs. 2014 Activity Levels Average Rigs Running 4 5 1 (75%) 14 9 7 (50%) Average Completion Crews 2.0 3.0 1.5 (25%) 5.5 2.0 4.0 (27%) Operational Improvements Drilling Days 29 31 24 17% 29 24 21 28% Average Lateral Length (Ft) 8,543 8,575 9,000 5% 8,052 8,910 9,000 12% Stages per Well 47 49 51 9% 40 45 45 12% Stage Length 183 175 175 4% 200 200 200 0% Stages per Day 3.2 3.7 4.4 38% 3.2 3.5 3.8 19% Well Cost & Performance Improvements D&C per 1,000' $1.55 $1.36 $1.14 (26%) $1.34 $1.18 $0.95 (29%) EUR per 1,000' (Bcf) (1) 1.4 1.6 1.6 14% 1.5 1.7 2.0 33% EUR per 1,000' (Bcfe) (1) 1.5 1.8 1.8 20% 1.8 1.9 2.3 28% (2)
  • 12. 1,194 1,128 1,117 990 1,031 1,016 958 956 1,084 1,126 1,274 1,304 1,337 1,418 1,480 1,500 800 900 1,000 1,100 1,200 1,300 1,400 1,500 1,600 Jan-15 Feb-15 Mar-15 Apr-15 May-15 Jun-15 Jul-15 Aug-15 Sep-15 Oct-15 Nov-15 Dec-15 Jan-16 Feb-16 Mar-16 2016 Plan ProppantPlaced(lbs/ft)MARCELLUS PROPPANT PLACEMENT 11 Increased Proppant Load by 25% While Increasing Proppant Placement to 98% Pilot testing demonstrated improved recoveries while maintaining well density
  • 13. 0 5 10 15 20 25 30 35 4,000 5,000 6,000 7,000 8,000 9,000 10,000 11,000 12,000 13,000 EUR(Bcfe) Lateral Length (Feet) All Wells Q1 2016 Wells 12 MARCELLUS IMPROVEMENTS DRIVING VALUE CREATION Antero Marcellus EUR vs. Lateral Length(1)(2) 33 wells > 10,000’ lateral length and 43 wells waiting on completion ranging from 10,000’ to 14,000’ 1. All 251 wells completed since 2014 when Antero transitioned to shorter stage length completions (SSL). 2. EUR’s include NGL processing (C3+) but assume ethane rejection. Longer Laterals Better Well Economics TBD Current completions using 1,500 lbs/ft of sand and 39 Bbls/ft of water 2016 wells average 2.3 Bcfe/1,000’ 98% sand placement for 1,200 lbs/ft drove outperformance in 1Q 2016 compared to type curve 39 wells > 20 Bcfe High correlation of EURs to lateral length
  • 14.  While we have not changed our 1.7 Bcf/1,000' Marcellus project-wide type curve, we are seeing stronger EURs per 1,000' in a significant portion of our Marcellus rich gas acreage as exhibited in our 2.0 Bcf/1,000' average for wells completed in the first quarter with at least 30 days of production history $8.7 $11.7 $5.2 $7.7 35% 45% 24% 30% 0% 10% 20% 30% 40% 50% $0.0 $3.0 $6.0 $9.0 $12.0 $15.0 1.7 Bcf/1,000' 2.3 Bcfe/1,000' 2.0 Bcf/1,000' 2.7 Bcfe/1,000' 1.7 Bcf/1,000' 2.1 Bcfe/1,000' 2.0 Bcf/1,000' 2.5 Bcfe/1,000' Pre-TaxROR Pre-TaxPV-10 Pre-Tax PV-10 Pre-Tax ROR Classification(1) Highly-Rich Gas/Condensate Highly-Rich Gas BTU Regime 1275-1350 1275-1350 1200-1275 1200-1275 EUR (Bcfe): 20.8 24.4 18.8 22.1 EUR (MMBoe): 3.5 4.1 3.1 3.7 % Liquids: 33% 33% 24% 24% Lateral Length (ft): 9,000 9,000 9,000 9,000 Well Cost ($MM): $8.5 $8.5 $8.5 $8.5 Bcf/1,000’ 1.7 2.0 1.7 2.0 Bcfe/1,000’: 2.3 2.7 2.1 2.5 Net F&D ($/Mcfe): $0.48 $0.41 $0.53 $0.45 Pre-Tax NPV10 ($MM): $8.7 $11.7 $5.3 $7.7 Pre-Tax ROR: 35% 45% 24% 30% Payout (Years): 2.5 2.0 3.7 2.9 Breakeven NYMEX Gas Price ($/MMBtu)(5) $1.67 $1.40 $2.31 $2.05 Gross 3P Locations(3): 626 971 13 NYMEX ($/MMBtu) WTI ($/Bbl) C3+ NGL(2) ($/Bbl) 2016 $2.26 $41 $16 2017 $2.77 $45 $21 2018 $2.87 $47 $24 2019 $2.93 $49 $25 2020 $3.03 $50 $26 2021-25 $3.49 $51-$53 $27 Assumptions  Natural Gas – 3/31/2016 strip  Oil – 3/31/2016 strip  NGLs – 37.5% of Oil Price 2016; 50% of Oil Price 2017+ 4535 2016 Development Plan: Completions 1. 3/31/2016 pre-tax well economics based on a 9,000’ lateral, 3/31/2016 natural gas and WTI strip pricing for 2016-2025, flat thereafter, NGLs at 37.5% of WTI for 2016 and 50% of WTI thereafter, and applicable firm transportation and operating costs including 50% of Antero Midstream fees. Well cost estimates include $1.2 million for road, pad and production facilities. 2. Pricing for a 1225 BTU y-grade ethane rejection barrel. NGLs at 37.5% of WTI for 2016 and 50% of WTI for 2017 and thereafter. NGL prices are forecast to increase in 2017 relative to WTI due to projected in-service date of Mariner East 2 project allowing for a significant increase in AR NGL exports via ship. 3. Undeveloped well locations as of 12/31/2015. 4. Represents actual results for 1Q 2016. 5. Breakeven price for 15% pre-tax rate of return. MARCELLUS UPSIDE POTENTIAL Highly-Rich Gas/Condensate Highly-Rich Gas (4) (4)
  • 16. ANTERO RESOURCES EBITDAX RECONCILIATION 15 EBITDAX Reconciliation ($ in millions) Quarter Ended LTM Ended 3/31/2016 3/31/2016 EBITDAX: Net income including noncontrolling interest $10.7 $591.5 Commodity derivative fair value (gains) (279.9) (1,901.9) Net cash receipts on settled derivatives instruments 324.3 996.1 Interest expense 63.3 244.4 Income tax expense (benefit) 4.8 333.3 Depreciation, depletion, amortization and accretion 192.2 720.9 Impairment of unproved properties 15.5 111.3 Exploration expense 1.0 3.5 Equity-based compensation expense 23.5 93.6 State franchise taxes 0.0 (0.1) Contract termination and rig stacking 0.0 29.6 Consolidated Adjusted EBITDAX $355.4 $1,222.2