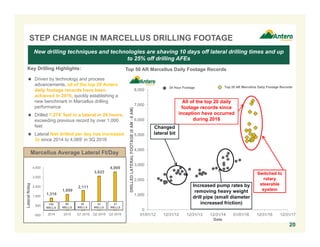
This document provides guidance and forward-looking statements from Antero Resources Corporation regarding its operations and financial outlook. Some of the key points include:
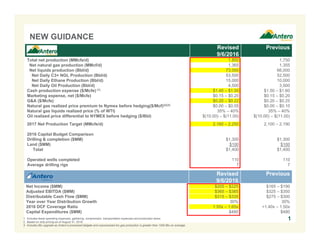
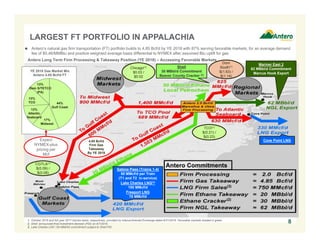
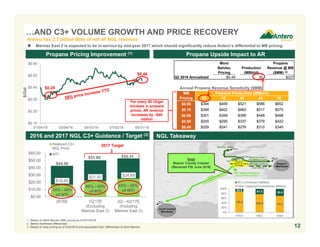
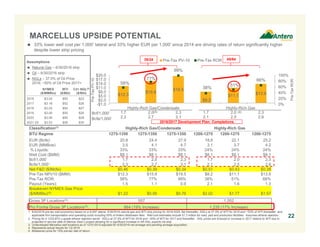
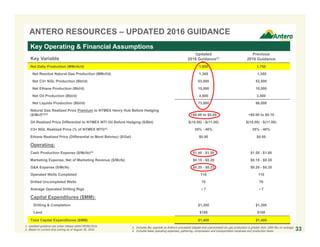
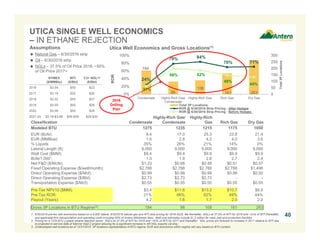
- Revised 2016 total production guidance of 1.8 Bcfe/d, an increase from previous guidance of 1.75 Bcfe/d.
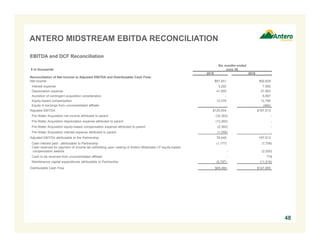
- Estimated net income range for 2016 of $205-225 million, an increase from the previous estimate of $165-190 million.
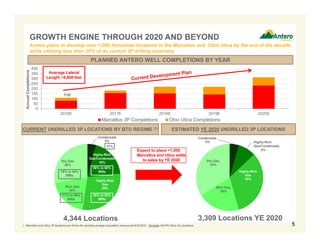
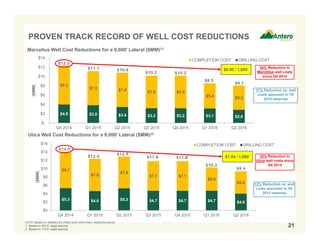
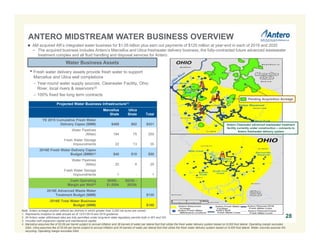
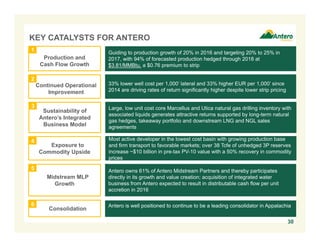
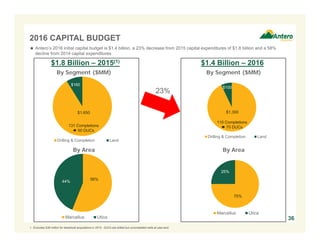
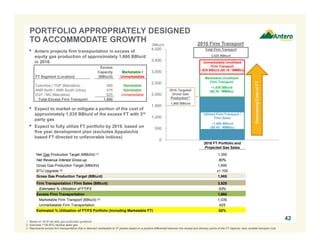
- Capital budget for 2016 remains at $1.4 billion to drill 110 wells while maintaining production growth of 20-25% annually through 2020.
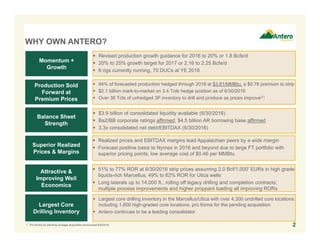
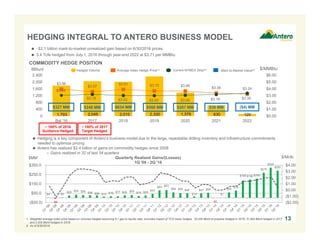
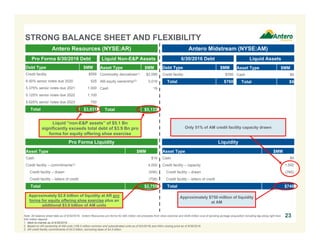
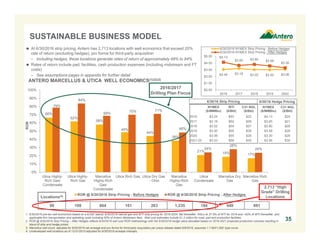
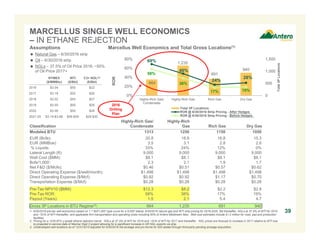
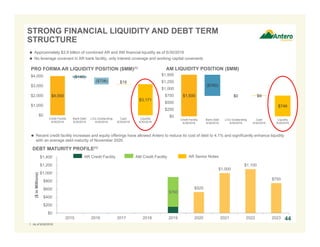
- The company has significant liquidity and a large drilling inventory that positions it to capitalize on growing natural