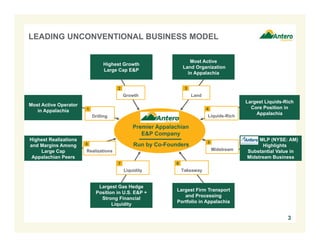
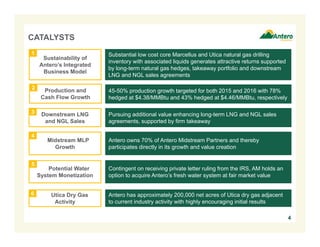
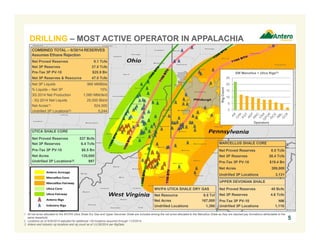
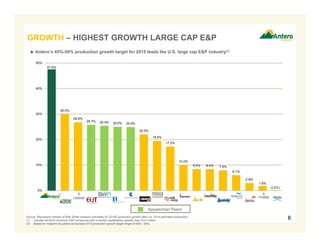
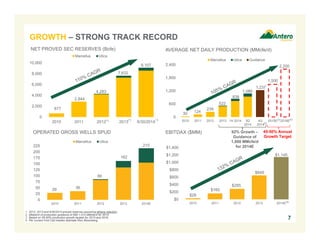
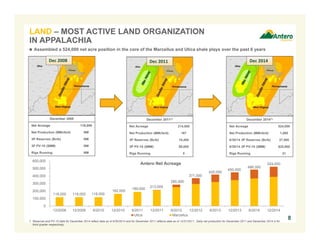
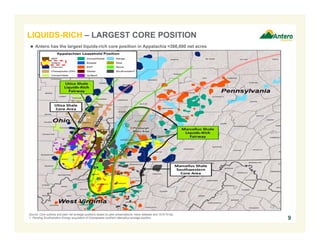
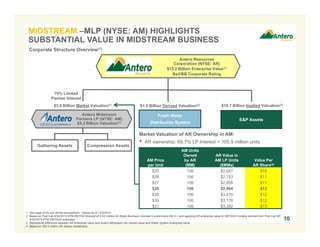
SlideShare a Scribd company logo
Company Overview
December 2014
FORWARD-LOOKING STATEMENTS
This presentation contains forward-looking statements within the meaning of Section 27A of the Securities Act of 1933 and Section 21E of the
Securities Exchange Act of 1934. All statements, other than statements of historical facts, included in this presentation that address activities,
events or developments that Antero Resources Corporation and its subsidiaries (collectively, the “Company” or “Antero”) expects, believes or
anticipates will or may occur in the future are forward-looking statements. The words “believe,” “expect,” “anticipate,” “plan,” “intend,” “estimate,”
“project,” “foresee,” “should,” “would,” “could,” or other similar expressions are intended to identify forward-looking statements. However, the
absence of these words does not mean that the statements are not forward-looking. Without limiting the generality of the foregoing, forward-
looking statements contained in this presentation specifically include estimates of the Company’s reserves, expectations of plans, strategies,
objectives and anticipated financial and operating results of the Company, including as to the Company’s drilling program, production, hedging
activities, capital expenditure levels and other guidance included in this presentation. These statements are based on certain assumptions made
by the Company based on management’s experience and perception of historical trends, current conditions, anticipated future developments and
other factors believed to be appropriate. Such statements are subject to a number of assumptions, risks and uncertainties, many of which are
beyond the control of the Company, which may cause actual results to differ materially from those implied or expressed by the forward-looking
statements. These include the factors discussed or referenced under the heading “Item 1A. Risk Factors” in our Annual Report on Form 10-K for
the year ended December 31, 2013 and in the Company’s subsequent filings with the SEC.
The Company cautions you that these forward-looking statements are subject to all of the risks and uncertainties, most of which are difficult to
predict and many of which are beyond our control, incident to the exploration for and development, production, gathering and sale of natural gas
and oil. These risks include, but are not limited to, commodity price volatility, inflation, lack of availability of drilling and production equipment and
services, environmental risks, drilling and other operating risks, regulatory changes, the uncertainty inherent in estimating natural gas and oil
reserves and in projecting future rates of production, cash flow and access to capital, the timing of development expenditures, and the other risks
described under the heading “Risk Factors” in our Annual Report on Form 10-K for the year ended December 31, 2013 and in the Company’s
subsequent filings with the SEC.
Any forward-looking statement speaks only as of the date on which such statement is made and the Company undertakes no obligation to correct
or update any forward-looking statement, whether as a result of new information, future events or otherwise, except as required by applicable law.
1
2
CHANGES SINCE NOVEMBER 2014 PRESENTATION
New and updated overview slides highlighting Antero’s
integrated business model
Updated single well economic returns for Marcellus and
Utica at 11/28/2014 strip prices
Slides 16, 19, 21,
38, 39
Substantial value in Antero Midstream Partners
(NYSE: AM)
Updated “Road Map” for natural gas realizations based
on 11/28/2014 strip prices
Expanded natural gas hedge portfolio with mark-to-
market value at 11/28/2014
Slides 3 – 14
Slide 10
Slide 12
Slide 14
Updated firm transportation map for 330 MMcf/d of firm
sales for LNG through Cove Point to GAIL (India)
Slide 11
3
Most Active Operator
in Appalachia
Most Active
Land Organization
in Appalachia
Largest Firm Transport
and Processing
Portfolio in Appalachia
Largest Gas Hedge
Position in U.S. E&P +
Strong Financial
Liquidity
Highest Growth
Large Cap E&P
Largest Liquids-Rich
Core Position in
Appalachia
Highest Realizations
and Margins Among
Large Cap
Appalachian Peers
Growth Land
Liquidity
Midstream
Drilling
LEADING UNCONVENTIONAL BUSINESS MODEL
MLP (NYSE: AM)
Highlights
Substantial Value in
Midstream Business
Realizations
Takeaway
Liquids-Rich
1
2 3
4
5
67
8
Premier Appalachian
E&P Company
Run by Co-Founders
Downstream LNG
and NGL Sales
Production and
Cash Flow Growth
4
Antero has approximately 200,000 net acres of Utica dry gas adjacent
to current industry activity with highly encouraging initial results
CATALYSTS
45-50% production growth targeted for both 2015 and 2016 with 78%
hedged at $4.38/MMBtu and 43% hedged at $4.46/MMBtu, respectively
Substantial low cost core Marcellus and Utica natural gas drilling
inventory with associated liquids generates attractive returns supported
by long-term natural gas hedges, takeaway portfolio and downstream
LNG and NGL sales agreements
Pursuing additional value enhancing long-term LNG and NGL sales
agreements, supported by firm takeaway
Antero owns 70% of Antero Midstream Partners and thereby
participates directly in its growth and value creation
Midstream MLP
Growth
Sustainability of
Antero’s Integrated
Business Model
Utica Dry Gas
Activity
Potential Water
System Monetization
1
2
3
4
5
6
Contingent on receiving private letter ruling from the IRS, AM holds an
option to acquire Antero’s fresh water system at fair market value
DRILLING – MOST ACTIVE OPERATOR IN APPALACHIA
1. All net acres allocated to the WV/PA Utica Shale Dry Gas and Upper Devonian Shale are included among the net acres allocated to the Marcellus Shale as they are stacked pay formations attributable to the
same leasehold.
2. Locations as of 9/30/2014 adjusted for additional 130 locations acquired through 11/3/2014.
3. Antero and industry rig locations and rig count as of 11/28/2014 per RigData.
5
COMBINED TOTAL – 6/30/14 RESERVES
Assumes Ethane Rejection
Net Proved Reserves 9.1 Tcfe
Net 3P Reserves 37.5 Tcfe
Pre-Tax 3P PV-10 $25.9 Bn
Net 3P Reserves & Resource 47.0 Tcfe
Net 3P Liquids 966 MMBbls
% Liquids – Net 3P 15%
3Q 2014 Net Production 1,080 MMcfe/d
- 3Q 2014 Net Liquids 25,000 Bbl/d
Net Acres(1) 524,000
Undrilled 3P Locations(2) 5,244
UTICA SHALE CORE
Net Proved Reserves 537 Bcfe
Net 3P Reserves 6.4 Tcfe
Pre-Tax 3P PV-10 $6.5 Bn
Net Acres 135,000
Undrilled 3P Locations(2) 997
MARCELLUS SHALE CORE
Net Proved Reserves 8.5 Tcfe
Net 3P Reserves 26.4 Tcfe
Pre-Tax 3P PV-10 $19.4 Bn
Net Acres 389,000
Undrilled 3P Locations 3,131
UPPER DEVONIAN SHALE
Net Proved Reserves 40 Bcfe
Net 3P Reserves 4.6 Tcfe
Pre-Tax 3P PV-10 NM
Undrilled 3P Locations 1,116
WV/PA UTICA SHALE DRY GAS
Net Resource 9.5 Tcf
Net Acres 167,000
Undrilled Locations 1,390
0
5
10
15
20
25
RigCount
Operators
SW Marcellus + Utica Rigs(3)
47.5%
30.0%
26.8%
25.7% 25.4% 25.0% 24.9%
22.0%
19.5%
17.2%
10.0%
8.4% 8.4% 7.9%
6.1%
2.9%
1.8%
0%
10%
20%
30%
40%
50%
(2.8%)
Source: Represents median of Wall Street research estimates for 2015E production growth rates (vs. 2014 estimated production).
(1) Includes all North American E&P companies with a market capitalization greater than $10.0 billion.
(2) Based on midpoint of publicly announced 2015 production growth target range of 45% - 50%.
6
 Antero’s 45%-50% production growth target for 2015 leads the U.S. large cap E&P industry(1)
(2)
GROWTH – HIGHEST GROWTH LARGE CAP E&P
Appalachian Peers
1. 2012, 2013 and 6/30/2014 proved reserves assuming ethane rejection.
2. Midpoint of production guidance of 990-1,010 MMcfe/d for 2014.
3. Based on 45-50% production growth targets for 2015 and 2016.
4. Per current First Call median estimate from Bloomberg.
0
600
1,200
1,800
2,400
2010 2011 2012 2013 1H 2014 3Q
2014
4Q
2014
2015E 2016E
Marcellus Utica Guidance
30 124
239
522
(2)
1,237
838
1,500
2,200
(3) (3)
1,080
0
2,000
4,000
6,000
8,000
10,000
2010 2011 2012 2013 6/30/2014
Marcellus Utica
677
2,844
4,283
7,632
(1) (1) (1)
9,107
7
AVERAGE NET DAILY PRODUCTION (MMcfe/d)NET PROVED SEC RESERVES (Bcfe)
0
25
50
75
100
125
150
175
200
225
2010 2011 2012 2013 2014E
Marcellus Utica
29 36
86
162
215
GROWTH – STRONG TRACK RECORD
OPERATED GROSS WELLS SPUD EBITDAX ($MM)
$0
$200
$400
$600
$800
$1,000
$1,200
$1,400
2010 2011 2012 2013 2014E
$28
$160
$285
$649
$1,145
(4)
45-50% Annual
Growth Target
92% Growth –
Guidance of
1,000 MMcfe/d
for 2014E
 Assembled a 524,000 net acre position in the core of the Marcellus and Utica shale plays over the past 6 years
December 2008
Net Acreage 118,000
Net Production (MMcfe/d) NM
3P Reserves (Bcfe) NM
3P PV-10 ($MM) NM
Rigs Running NM
Dec 2008 Dec 2011 Dec 2014
December 2011(1)
Net Acreage 214,000
Net Production (MMcfe/d) 167
3P Reserves (Bcfe) 18,400
3P PV-10 ($MM) $9,000
Rigs Running 5
December 2014(1)
Net Acreage 524,000
Net Production (MMcfe/d) 1,080
6/30/14 3P Reserves (Bcfe) 37,500
6/30/14 3P PV-10 ($MM) $25,900
Rigs Running 21
1. Reserves and PV-10 data for December 2014 reflect data as of 6/30/2014 and for December 2011 reflects data as of 12/31/2011. Daily net production for December 2011 and December 2014 is for
third quarter respectively.
LAND – MOST ACTIVE LAND ORGANIZATION
IN APPALACHIA
8
118,000 118,000 118,000
162,000
189,000
213,000
285,000
371,000
420,000
450,000
486,000
524,000
0
100,000
200,000
300,000
400,000
500,000
600,000
12/2008 12/2009 6/2010 12/2010 6/2011 12/2011 6/2012 12/2012 6/2013 12/2013 6/2014 12/2014
Antero Net Acreage
Utica Marcellus
9
LIQUIDS-RICH – LARGEST CORE POSITION
Source: Core outlines and peer net acreage positions based on peer presentations, news releases and 10-K/10-Qs.
1. Pending Southwestern Energy acquisition of Chesapeake southern Marcellus acreage position.
(1)
 Antero has the largest liquids-rich core position in Appalachia ≈366,000 net acres
MIDSTREAM –MLP (NYSE: AM) HIGHLIGHTS
SUBSTANTIAL VALUE IN MIDSTREAM BUSINESS
1. See page 34 for pro forma assumptions. Values as of 12/2/2014.
2. Based on First Call 9/30/2015 NTM EBITDA forecast of $142 million for Water Business included in preliminary AM S-1 and applying AR enterprise value to EBITDAX multiple derived from First Call AR
9/30/2015 NTM EBITDAX estimates.
3. Represents difference between AR enterprise value and Antero Midstream net market value and Water System enterprise value.
4. Based on 262.0 million AR shares outstanding.
10
Antero Resources
Corporation (NYSE: AR)
$15.2 Billion Enterprise Value(1)
Ba3/BB Corporate Rating
Antero Midstream
Partners LP (NYSE: AM)
$4.3 Billion Valuation(1)
70% Limited
Partner Interest
E&P Assets
Gathering Assets
Corporate Structure Overview(1)
Market Valuation of AR Ownership in AM:
• AR ownership: 69.7% LP Interest = 105.9 million units
AM Price
per Unit
AM Units
Owned
by AR
(MM)
AR Value in
AM LP Units
($MMs)
Value Per
AR Share(4)
$25 106 $2,647 $10
$26 106 $2,753 $11
$27 106 $2,858 $11
$28 106 $2,964 $12
$29 106 $3,070 $12
$30 106 $3,176 $12
$31 106 $3,282 $13
Fresh Water
Distribution System
Compression Assets
$3.0 Billion Market Valuation(1) $10.7 Billion Implied Valuation(3)
$1.5 Billion Derived Valuation(2)
TAKEAWAY – LARGEST FIRM TRANSPORTATION AND
PROCESSING PORTFOLIO IN APPALACHIA
Odebrecht / Braskem
30 MBbl/d Commitment
Ascent Cracker
(Pending Final
Investment Decision)
Antero Long Term Firm Processing & Takeaway Position (2018) – Accessing Favorable Markets
Mariner East II
62 MBbl/d Commitment(2)
Marcus Hook Export
Shell
25 MBbl/d Commitment
Beaver County Cracker
(Pending Final
Investment Decision)
Sabine Pass (Trains 1-4)
50 MMcf/d per Train
1. 2015 and 2016 futures basis, respectively, provided by Wells Fargo dated 11/28/2014. Favorable gas markets shaded in green.
2. As an anchor shipper on Mariner East II, Antero has the right to expand its NGL commitment with notice to operator.
Chicago(1)
+$0.18 /
$(0.04)
CGTLA(1)
$(0.10) /
$(0.09)
Dom South(1)
$(1.32) /
$(1.16)
TCO(1)
$(0.29) /
$(0.47)
11
4 Bcf/d
Firm Gas
Takeaway
By 2018
Cove Point
788 1,168 943 780 1,073 818
$4.97
$4.38 $4.46 $4.34 $4.50 $4.41
$4.07 $3.82 $3.83 $3.96 $4.09 $4.21
$0.00
$1.00
$2.00
$3.00
$4.00
$5.00
$6.00
$7.00
0
200
400
600
800
1,000
1,200
4Q 2014 2015 2016 2017 2018 2019
BBtu/d $/MMBtu
12
Average Index Hedge Price(1)Hedged Volume Current NYMEX Strip(2)
COMMODITY HEDGE POSITION
1. Reflects weighted average index price per annum based on volumes hedged and 6:1 gas to oil ratio. Antero has hedged 3,000 Bbl/d of oil for 2014 and 2,000 Bbl/d of propane for 2015.
2. As of 11/28/2014.
3. Percentage of net gas equivalent production target hedged for respective years.
 ~$1,109 million mark-to-market unrealized gain based on current prices
 1.8 Tcfe hedged from October 1, 2014 through year-end 2019 and 256 Bcf of TCO basis hedges from 2015 to 2017
$72 MM $345 MM $349 MM $123 MM $160 MM $60 MM
Mark-to-Market Value(2)
LIQUIDITY – LARGEST GAS HEDGE POSITION IN U.S. E&P
+ STRONG FINANCIAL LIQUIDITY
$3,000
$2,012
($1,505)
($332) $6 $843
$0
$500
$1,000
$1,500
$2,000
$2,500
$3,000
Credit Facility
9/30/2014
Bank Debt
9/30/2014
L/Cs
Outstanding
9/30/2014
Cash
9/30/2014
AM IPO
Proceeds
to AR
Pro Forma
Liquidity
9/30/2014
AR LIQUIDITY POSITION ($MM) AM LIQUIDITY POSITION ($MM)
$1,000
$1,250
$0 $0 $0
$250
$0
$500
$1,000
$1,500
$2,000
$2,500
$3,000
Credit Facility
9/30/2014
Bank Debt
9/30/2014
L/Cs
Outstanding
9/30/2014
Cash
9/30/2014
AM IPO
Proceeds
to AM
Pro Forma
Liquidity
9/30/2014
≈ 78% of 2015E
Target
Production(3)
≈ 43% of 2015E
Target
Production(3)
 Over $3 billion of combined AR and AM financial liquidity as of 9/30/2014, pro forma for AM IPO closed on 11/10/2014
1. Gulf Coast differential represents contractual deduct to NYMEX-based sales.
2. Includes firm sales.
3. Includes natural gas hedges.
4. Source: Public data from 3Q 2014 10-Qs. Peers include Cabot Oil & Gas, CONSOL Energy, EQT Corp. and Range Resources.
5. Includes realized hedge gains and losses. Operating costs include lease operating expenses, production taxes, gathering, processing and firm transport costs and general and administrative costs. 4-year
proved reserve average all-in F&D from 2010-2013. Calculation = (Development costs + exploration costs + leasehold costs) / Total reserves added (2013 ending reserves – 2010 beginning reserves + 4-year
reserve sales – 4-year reserve purchases + 4-year accumulated production). AR price realization includes $0.04 of midstream revenues.
$4.16 $3.97
$0.58
$0.95
$0.74 $0.77 $0.81
$0.00
$1.00
$2.00
$3.00
$4.00
$5.00
$6.00
Antero Peer 1 Peer 2 Peer 3 Peer 4
$/Mcfe
LOE Production Taxes GPT G&A EBITDAX 4-year Avg. All-in F&D ($/Mcfe)
$4.96
$3.25
$4.48
$2.93
$2.40
$2.64
$2.11 $2.09
13
Region
3Q 2014
% Sales
Average
NYMEX Price
Average
Differential(2)
Average
BTU Upgrade
Hedge
Effect
Average 3Q 2014
Realized Gas Price(3)
Average
Premium/
Discount
TCO 39% $4.06 $(0.12) $0.48 $0.58 $5.00 $0.94
Dom South/TETCO 41% $4.06 $(1.83) $0.32 $1.10 $3.65 $(0.41)
Gulf Coast(1) 10% $4.06 $(0.25) $0.39 $0.01 $4.21 $0.15
Chicago 10% $4.06 $(0.07) $0.52 - $4.51 $0.45
Total Wtd. Avg. 100% $4.06 $(0.84) $0.41 $0.68 $4.31 $0.25
REALIZATIONS – HIGHEST REALIZATIONS & MARGINS
AMONG LARGE-CAP APPALACHIAN PEERS
3Q 2014 Natural Gas Realizations ($/Mcf)
3Q 2014 Natural Gas Realizations(3) 3Q 2014 Price Realization & EBITDAX Margin vs F&D(4)
$4.31
$4.12
$3.66 $3.62 $3.60
$2.98 $2.87 $2.75
$0.00
$2.00
$4.00
$6.00
AR EQT GPOR RRC CNX RICE ECR COG
$/Mcf
3Q 2014 NYMEX = $4.06/Mcf
AR Peer 1 Peer 2 Peer 3 Peer 4
DOM S
28% DOM S
22%
DOM S
8%
TETCO M2
4% TETCO M2
8%
TETCO M2
10%
TCO
43%
TCO
23%
TCO
15%
NYMEX
9%
NYMEX
7%
NYMEX
10%
Gulf Coast
18%
Gulf Coast
47%
Chicago
16% Chicago
22%
Chicago
10%
0%
10%
20%
30%
40%
50%
60%
70%
80%
90%
100%
($/Mcf) 4Q 2014E 2015E 2016E
NYMEX Strip Price(1) $4.00 $3.82 $3.83
Basis Differential to NYMEX(1) $(0.52) $(0.45) $(0.35)
BTU Upgrade(5) $0.35 $0.34 $0.35
Estimated Realized Hedge Gains $0.67 $0.63 $0.45
Realized Gas Price with Hedges $4.50 $4.34 $4.28
Premium to NYMEX +$0.50 +$0.52 +$0.45
Liquids Impact(6) +$0.54 +$0.50 +$0.58
Premium to NYMEX w/ Liquids +$1.04 +$1.02 +$1.03
Realized Gas-Equivalent Price $5.04 $4.84 $4.86
4. Represents 60,000 MMBtu/d of TCO index hedges and 205,000 MMBtu/d of TCO basis
hedges that are matched with NYMEX hedges for presentation purposes.
5. Assumes ethane rejection resulting in 1100 BTU residue sales gas.
6. Represents equivalent price upgrade associated with NGL (C3+) and oil production.
REALIZATIONS – REALIZED PRICE “ROAD MAP”
1. Based on 11/28/2014 strip pricing.
2. Differential represents contractual deduct to NYMEX-based firm sales contract.
3. Represents 120,000 MMBtu/d of TCO index hedges and 390,000 MMBtu/d of TCO basis hedges that are
matched with NYMEX hedges for presentation purposes.
4Q 2014
Basis(1)
2015
Basis(1)
2016
Basis(1)
4Q 2014
Hedges
2015
Hedges
2016
Hedges
Marketed%ofTargetResidueGasProduction
+$0.33/MMBtu
$(0.25)/MMBtu(2)
$(1.63)/MMBtu
$(0.07)/MMBtu
+$0.18/MMBtu
$(0.25)/MMBtu(2)
$(1.32)/MMBtu
$(0.29)/MMBtu
$(0.04)/MMBtu
$(0.25)/MMBtu(2)
$(1.16)/MMBtu
$(0.46)/MMBtu
$(0.10)/MMBtu
$(0.09)/MMBtu
340,000 MMBtu/d
@ $4.18/MMBtu
160,000 MMBtu/d
@ $5.27/MMBtu
210,000 MMBtu/d
@ $5.24/MMBtu
40,000 MMBtu/d
@ $4.00/MMBtu
230,000 MMBtu/d
@ $5.60/MMBtu
510,000 MMBtu/d
@ $3.87/MMBtu(3)
170,000 MMBtu/d
@ $4.09/MMBtu
272,500 MMBtu/d
@ $5.35/MMBtu
265,000 MMBtu/d
@ $3.89/MMBtu(4)
$0.56/Mcfe in estimated hedge gains(1)
70% exposure to favorable price indices
$0.67/Mcfe in estimated hedge gains(1)
68% exposure to favorable price indices
$0.43/Mcfe in estimated hedge gains(1)
82% exposure to favorable price indices
 Antero is forecasting realized gas prices including hedges at a premium to NYMEX strip prices for Q4 2014 through 2016, assuming
current strip prices and basis, existing firm transportation and hedges, and targeted 2015 and 2016 production figures
$(1.57)/MMBtu
$(1.18)/MMBtu
$(1.05)/MMBtu
Wtd. Avg.
Basis ($0.52)
770,000 MMBtu/d
@ $4.97/MMBtu
Wtd. Avg.
Basis $(0.45)
1,160,000 MMBtu/d
@ $4.34/MMBtu
Wtd. Avg.
Basis $(0.35)
942,500 MMBtu/d
@ $4.46/MMBtu
10,000 MMBtu/d
@ $3.98/MMBtu
4Q 2014E 2015E 2016E
14
380,000 MMBtu/d
@ $3.88/MMBtu
235,000 MMBtu/d
@ $4.00/MMBtu
50,000 MMBtu/d
@ $4.72/MMBtu
ASSET OVERVIEW
15
0%
20%
40%
60%
80%
248
143 87
265
254
14%
57%
76%
50%
45%
0
50
100
150
200
250
300
0%
25%
50%
75%
100%
Condensate Highly-Rich
Gas/
Condensate
Highly-Rich
Gas
Rich Gas Dry Gas
Total3PLocations
ROR
Locations ROR
MARCELLUS SSL WELL ECONOMICS(1)
727
896
633
875
55%
37%
17% 16%
0
200
400
600
800
1000
0%
25%
50%
75%
100%
Highly-Rich
Gas/
Condensate
Highly-Rich
Gas
Rich Gas Dry Gas
Total3PLlocations
ROR
Locations ROR
MULTI-YEAR DRILLING INVENTORY SUPPORTS
LOW RISK, HIGH RETURN GROWTH PROFILE
Large 3P Drilling Inventory of High Return Projects(3)
1. Pre-tax well economics based on 11/28/2014 natural gas and WTI strip pricing for 2014-2019, flat thereafter, NGLs at 55% of oil price and applicable firm transportation costs.
2. Adjusted for additional 130 gross locations acquired as of 11/3/2014.
3. Source: Credit Suisse report dated October 2014 – After-tax internal rate of return based on 10/27/2014 strip pricing.
59%
57%
71%
21%
InternalRateofReturn(%)
37%
16
UTICA WELL ECONOMICS(1)(2)
1,000
 72% of Marcellus locations are processable (1100-plus Btu)  75% of Utica locations are processable (1100-plus Btu)
3,000 Antero Liquids-Rich Locations
37%
2H 2014 / 2015
Drilling Plan
1,129 Antero Dry Gas Locations
WORLD CLASS MARCELLUS SHALE
DEVELOPMENT PROJECT
100% operated
Operating 14 drilling rigs
including 5 intermediate rigs
389,000 net acres in
Southwestern Core (73%
includes processable rich gas
assuming an 1100 Btu cutoff)
– 50% HBP with additional 27%
not expiring for 5+ years
339 horizontal wells completed
and online
– Laterals average 7,400’
– 100% drilling success rate
5 plants in-service at Sherwood
Processing Complex capable of
processing 1 Bcf/d of rich gas
− Over 800 MMcf/d being
processed currently
Net production of 937 MMcfe/d in
3Q 2014, including 17,300 Bbl/d
of liquids
3,131 future drilling locations in
the Marcellus (2,256 or 72% are
processable rich gas)
26.4 Tcfe of net 3P (18% liquids),
includes 8.5 Tcfe of proved
reserves (assuming ethane
rejection) Highly-Rich Gas
119,000 Net Acres
896 Gross Locations
Rich Gas
91,000 Net Acres
633 Gross Locations
Dry Gas
104,000 Net Acres
875 Gross Locations
Highly-Rich/Condensate
75,000 Net Acres
727 Gross Locations
HEFLIN UNIT
30-Day Rate
2H: 21.4 MMcfe/d
(21% liquids)
CONSTABLE UNIT
30-Day Rate
1H: 14.3 MMcfe/d
(26% liquids)
142 Horizontals Completed
30-Day Rate
8.1 MMcf/d
6,915’ average lateral length
Sherwood
Processing
Complex
Source: Company presentations and press releases. Antero acreage position reflects tax districts in which greater than 3,000 net acres are held. Note: Rates in ethane rejection.
NERO UNIT
30-Day Rate
1H: 18.2 MMcfe/d
(27% liquids)
BEE LEWIS PAD
30-Day Rate
4-well combined
30-Day Rate of
67 MMcfe/d
(26% liquids)
RJ SMITH PAD
30-Day Rate
4-well combined
30-Day Rate of
56 MMcfe/d
(21% liquids)
17
MHR COLLINS UNIT
30-Day Rate
4-well average
9.3 MMcfe/d
(26% liquids)
HENDERSHOT UNIT
30-Day Rate
1H: 16.3 MMcfe/d
2H: 18.1 MMcfe/d
(29% liquids)
HORNET UNIT
30-Day Rate
1H: 21.8 MMcfe/d
(26% liquids)
HINTERER UNIT
30-Day Rate
1H: 12.9 MMcfe/d
(20% liquids)
0
5
10
15
20
MMc/fd
Production from All Wells 2009 - 2014
0.0
3.0
6.0
9.0
12.0
15.0
0.0
3.0
6.0
9.0
12.0
15.0
0 1 2 3 4 5 6 7 8 9 10
CumulativeBcf
MMcf/d
Production Year
Non-SSL Type Curve (1.5 Bcf/1,000') Non-SSL Actual Production Non-SSL Type Curve Cumulative Production
SSL Type Curve (1.7 Bcf/1,000') SSL Actual Production SSL Type Curve Cumulative Production
 Antero has five years of production history to support its Non-SSL type curve
 Antero has over one year of production history to support its SSL type curve: 1.7 Bcf/1,000’ with only 10% to 15% higher well costs vs. Non-SSL
 Lack of faulting and contiguous acreage position allows for drilling of long laterals ~ 7,400’ average since inception
− Drives down cost per 1,000’ of lateral resulting in best in class development costs
ANTERO’S MARCELLUS SHALE TYPE CURVE
1. 198 Antero Marcellus Non-SSL wells normalized to time zero, production for each well normalized to 7,000’ lateral length.
2. 141 Antero Marcellus SSL wells normalized to time zero, production for each well normalized to 7,000’ lateral length.
Marcellus Type Curves – Normalized to 7,000’ Lateral
(1)
EURs Increase With Lateral Length Well Cost / 1,000’ Decreases with Lateral Length Wellhead 30-day Rates - 320 Wells
2009-2012 – 7.9 MMcf/d
(2)
2013 – 8.4 MMcf/d
2014 YTD – 11.4 MMcf/d
Actual Rates
24-Hour
Peak Rate
30-Day
Avg. Rate
90-Day
Avg. Rate
180-Day
Avg. Rate
One-Year
Avg. Rate
Two-Year
Avg. Rate
Three-Year
Avg. Rate
Four-Year
Avg. Rate
Wellhead Gas (MMcf/d) 15.2 9.1 7.0 5.7 4.2 3.2 2.5 2.0
# of Antero Wells 339 320 313 268 222 113 60 20
18
0
5
10
15
20
25
2,000 4,000 6,000 8,000 10,000
EUR,BCF
Lateral Length, ft
$0.0
$0.5
$1.0
$1.5
$2.0
$2.5
$3.0
2,000 4,000 6,000 8,000 10,000
$MM/1,000'
Lateral length, ft
0.0%
25.0%
50.0%
75.0%
100.0%
125.0%
150.0%
$3.00 $3.50 $4.00 $4.50 $5.00 $5.50 $6.00
Pre-TaxROR(%)
Highly-Rich Gas/Condensate Highly-Rich Gas Rich Gas Dry Gas
MARCELLUS ROR% AND GAS PRICE SENSITIVITY
191. Assumes 11/28/2014 strip pricing, market differentials and relevant transportation cost.
 Large portfolio of Highly-Rich Gas/Condensate to Dry Gas locations
 Focused on drilling highly economic rich gas locations – rig symbols represent current rig location by Btu regime
 Assumes 11/28/2014 WTI strip pricing for 2014-2019, flat thereafter; NGL price of 55% of WTI
NYMEX Price Sensitivity(1)
ROR% at 5-Year Strip
Highly-Rich Gas/Condensate: 55%
Highly-Rich Gas: 37%
Rich Gas: 17%
Dry Gas: 16%
727 Locations
896 Locations
633 Locations
875 Locations
Antero Rigs Employed
2H 2014 / 2015
Drilling Plan
Source: Company presentations and press releases. Note: Antero acreage position reflects townships in which greater than 3,000 net acres are held.
Note: Third party peak rates assume ethane recovery; Antero 30-day rates in ethane rejection.
1. For non-Antero wells, Antero has converted rich gas rates where BTU has been disclosed to NGLs, assuming ethane recovery. Where BTU has not been disclosed, Antero has estimated BTU and gas
composition.
2. 30-day rate reflects restricted choke regime.
 100% operated
 Operating 7 rigs including 2 intermediate rigs
 135,000 net acres in the core rich gas/
condensate window (76% includes processable
rich gas assuming an 1100 Btu cutoff)
– 20% HBP with additional 79% not expiring
for 5+ years
 44 operated horizontal wells completed and
online in Antero core areas
− 100% drilling success rate
3 plants at Seneca Processing Complex capable
of processing 600 MMcf/d of rich gas
− Over 500 MMcf/d being processed currently,
including third party production
 Net production of 143 MMcfe/d in 3Q 2014
including 7,700 Bbl/d of liquids
− Seneca 3 processing plant online in July
2014
− Fourth third party compressor station
expected in-service December 2014 with a
capacity of 120 MMcf/d
 997 future gross drilling locations (743 or 75%
are processable gas)
 6.4 Tcfe of net 3P (13% liquids), includes
537 Bcfe of proved reserves (assuming ethane
rejection)
LEADING UTICA SHALE CORE POSITION DELIVERS
CONDENSATE AND NGLS
20
Utica Shale Industry Activity(1)
Cadiz
Processing
Plant
NORMAN UNIT
30-Day Rate
2 wells average
17.2 MMcfe/d
(17% liquids)
RUBEL UNIT
30-Day Rate
3 wells average
17.3 MMcfe/d
(22% liquids)
GULFPORT
24-Hour IP
McCort1-28H, 2-28H,
Stutzman 1-14H
Average 13.1 MMcf/d
+ 922 Bbl/d NGL
+ 21 Bbl/d Oil
GULFPORT
24-Hour IP
Wagner 1-28H,
Shugert 1-1H, 1-12H
Average 21.0 MMcf/d
+ 2,270 Bbl/d NGL
+ 292 Bbl/d Oil
Utica
Core
Area
GARY UNIT
30-Day Rate
3 wells average
24.3 MMcfe/d
(22% liquids)
Highly-Rich/Cond
19,000 Net Acres
143 Gross Locations
Highly-Rich Gas
20,000 Net Acres
87 Gross Locations
Rich Gas
31,000 Net Acres
265 Gross Locations
Dry Gas
32,000 Net Acres
254 Gross Locations
NEUHART UNIT 3H
30-Day Rate
16.4 MMcfe/d
(56% liquids)
Condensate
33,000 Net Acres
248 Gross Locations
DOLLISON UNIT 1H
30-Day Rate
19.0 MMcfe/d
(36% liquids)
MYRON UNIT 1H
30-Day Rate
26.0 MMcfe/d
(50% liquids)
Seneca
Processing
Complex
LAW UNIT
30-Day Rate
2 wells average
15.7 MMcfe/d
(48% liquids)
SCHAFER UNIT
30-Day Rate(2)
2 wells average
13.7 MMcfe/d
(46% liquids)
McDOUGAL UNIT
30-Day Rate
2 wells average
20.6 MMcfe/d
(14% liquids)
0.0%
50.0%
100.0%
150.0%
200.0%
$3.00 $3.50 $4.00 $4.50 $5.00 $5.50 $6.00
Condensate Highly-Rich Gas/Condensate Highly-Rich Gas Rich Gas Dry Gas Antero Rigs Employed
UTICA ROR% AND GAS PRICE SENSITIVITY
21
NYMEX Price Sensitivity(1)
87 Locations
ROR% at 5-Year Strip
Condensate: 14%
Highly-Rich Gas/Condensate: 57%
Highly-Rich Gas: 76%
Rich Gas: 50%
Dry Gas: 45%
 Large portfolio of Condensate to Dry Gas locations
 Focused on drilling highly economic rich gas locations – rig symbols represent current rig location by Btu regime
 Assumes 11/28/2014 WTI strip pricing for 2014-2019, flat thereafter; NGL price of 55% of WTI
1. Assumes 11/28/2014 strip pricing, market differentials and relevant transportation cost.
265 Locations
143 Locations
254 Locations
248 Locations
2H 2014 / 2015
Drilling Plan
LARGE UTICA SHALE DRY GAS POSITION
22
 Antero has ≈200,000 net acres of exposure to Utica dry gas
play
− 32,000 net acres in Ohio with net 3P reserves of 1.9 Tcf as of
6/30/2014
− 167,000 net acres in West Virginia and Pennsylvania with net
resource of 9.5 Tcf as of 6/30/2014 (not included in 37.5 Tcfe
of net 3P reserves)
− 1,390 locations underlying current Marcellus Shale leasehold
in West Virginia and Pennsylvania as of 9/30/2014
 Expect to drill and complete a Utica Shale dry gas well in West
Virginia in 2015
 Other operators have reported strong Utica Shale dry gas
results including the following wells:
Chesapeake
Hubbard BRK #3H
3,550’ Lateral
IP 11.1 MMcf/d
Hess
Porterfield 1H-17
5,000’ Lateral
IP 17.2 MMcf/d
Gulfport
Irons #1-4H
5,714’ Lateral
IP 30.3 MMcf/d
Eclipse
Tippens #6H
5,858’ Lateral
IP 23.2 MMcf/d
Magnum Hunter
Stalder #3UH
5,050’ Lateral
IP 32.5 MMcf/d
Antero
Planned
Utica Well
2015Well Operator
IP
(MMcf/d)
Lateral
Length (Ft)
Stewart Winland 1300U Magnum Hunter 46.5 5,289
Bigfoot 9H Rice Energy 41.7 6,957
Stalder #3UH Magnum Hunter 32.5 5,050
Irons #1-4H Gulfport 30.3 5,714
Simms U-5H Gastar 29.4 4,447
Conner 6H Chevron 25.0 6,451
Tippens #6H Eclipse 23.2 5,858
Porterfield 1H-17 Hess 17.2 5,000
Hubbard BRK #3H Chesapeake 11.1 3,550
1. Antero acreage position reflects tax districts in which greater than 3,000 net acres are held in OH, WV and PA.
Magnum Hunter
Stewart Winland 1300U
5,289’ Lateral
IP 46.5 MMcf/d
Range
Utica Well
Flow Testing
Chevron
Conner 6H
6,451’ Lateral
IP 25.0 MMcf/d
Gastar
Simms U-5H
4,447’ Lateral
IP 29.4 MMcf/d
Utica Shale Dry Gas Acreage in OH/WV/PA(1)
Rice
Bigfoot 9H
6,957’ Lateral
IP 41.7 MMcf/d
Utica Shale Dry Gas
WV/PA
Net Resource
9.5 Tcf
1,390 Gross Locations
167,000 Net Acres
Utica Shale Dry Gas
Ohio
3P Reserves
1.9 Tcf
226 Gross Locations
32,000 Net Acres
Utica Shale Dry Gas
Total OH/WV/PA
Net Resource
11.4 Tcf
1,616 Gross Locations
≈200,000 Net Acres
Stone Energy
Utica Well
Drilling
Chesapeake
Utica Well
Drilling
Rice
Blue Thunder
10H, 12H
≈9,000’ Lateral
FRESH WATER DISTRIBUTION SYSTEMS
23
Marcellus Fresh Water Distribution System
• Provides fresh water to support Marcellus well completions
• Year-round water supply sources: Ohio River and local rivers
• Significant growth projected over the next twelve months as summarized
below:
Note: Antero acreage position reflects tax districts in which greater than 3,000 net acres are owned.
1. Represents inception to date actuals as of 6/30/2014 and 2014 guidance.
2. Estimated fee of $3.50 per barrel at an average of 200,000 Bbls of water per well.
Utica Fresh Water Distribution System
• Provides fresh water to support Utica well completions
• Year-round water supply sources: local reservoirs and rivers
• Significant growth projected over the next twelve months as summarized
below:
Marcellus Water System YE 2014
Buried Water Pipeline (Miles) 107
Fresh Water Storage Impoundments 26
Water Fees per Well ($)(2) $600K -
$800K
Utica Water System YE 2014
Buried Water Pipeline (Miles) 48
Fresh Water Storage Impoundments 8
Water Fees per Well ($)(2) $600K -
$800K
OHIO
Projected Midstream Infrastructure(1)
Marcellus
Shale
Utica
Shale Total
YE 2014E Cumulative
Fresh Water System Capex ($MM) $300 $100 $400
Water Pipelines (Miles) 107 48 155
Water Storage Facilities 26 8 34
-
500,000
1,000,000
1,500,000
2,000,000
2,500,000
3,000,000
3,500,000
4,000,000
4,500,000
FIRM TRANSPORTATION AND FIRM SALES PORTFOLIO
24
MMBtu/d
Columbia
7/26/2009 – 9/30/2025
Firm Sales #1
10/1/2011– 10/31/2019
Firm Sales #2
10/1/2011 – 5/31/2017
Firm Sales #3
1/1/2013 – 5/31/2022
Momentum III
9/1/2012 – 12/31/2023
EQT
8/1/2012 – 6/30/2025
REX/MGT/ANR
7/1/2014 – 12/31/2034
Tennessee
11/1/2015– 9/30/2030
Mid-Atlantic/NYMEX
Gulf Coast
Appalachia or Gulf Coast
Appalachia
Appalachia
ANR
3/1/2015– 2/28/2045
Midwest
Local Distribution
11/1/2015 – 9/30/2037
Gulf Coast
$0.14 $0.17
$0.23
$0.33
$0.11
$0.11
$0.12
$0.13
$0.00
$0.10
$0.20
$0.30
$0.40
$0.50
$0.60
$0.70
2013A 2014E 2015E 2016E
($/MMBtu)
Wtd. Avg. FT Demand ($/MMBtu) Wtd. Avg. FT Commodity/Fuel ($/MMBtu)
All-in Firm Transportation Costs(1)
FIRM TRANSPORTATION REDUCES APPALACHIAN
BASIS EXPOSURE
Appalachia
49%
Gulf Coast
51%
2013 Firm
Transportation(1)(2)
2013 Firm Transportation – 647 MMcf/d
Average All-in FT Cost $0.25/MMBtu
2016 Firm Transportation – 3.1 Bcf/d
Average All-in FT Cost $0.46/MMBtu
+ $0.18/MMBtu
 Antero’s firm transportation (FT) portfolio increases visibility on production growth and increases exposure to Gulf Coast and Midwest
pricing, with little incremental cost per Mcf
 Reduces weighted average basis by $0.27 per MMBtu compared to 2014 basis and by $0.14 per MMBtu applying 2014 portfolio to
2016 basis prices(3) – while significantly reducing Appalachian basis exposure
Utilized portion included
in cash production
expense
(fixed cost)
1. Assumes full utilization of firm transportation capacity; page 14 assumes Antero targeted production figures.
2. Represents accessible firm transportation and sales agreements.
3. Based on current strip pricing as at 11/28/2014.
Included in cash
production expense
(variable cost)
$0.25
$0.28
$0.35
$0.46
2016 Basis(3)
TCO – $(0.47)/MMBtu
DOM S – $(1.16)/MMBtu
2016 Basis(3)
Chicago – $(0.04)/MMBtu
2016 Basis(3)
CGTLA – $(0.09)/MMBtu
25
Appalachia
35%
Midwest
20%
Gulf Coast
45%
0
500
1,000
1,500
2,000
2,500
3,000
3,500
Firm Transportation / Firm Sales (BBtu/d)
Marketable FT (BBtu/d) (3)
Risked Gross Gas Production Target (Bbtu/d)
ANTERO FIRM TRANSPORTATION APPROPRIATELY
DESIGNED TO ACCOMMODATE GROWTH
261. Based on midpoint of production guidance of 990-1,010 MMcfe/d for 2014 and 45-50% production growth targets for 2015 and 2016.
2. Assumes 1100 BTU residue sales gas.
3. Represents excess firm transportation that is deemed marketable to 3rd parties based on a positive differential between the receipt and delivery points of the FT capacity, less variable transport cost.
% FT Utilization
(including
marketable FT):
(BBtu/d)
4Q 2014 2015 2016
Net Production Target (MMcfe/d) (1) 1,237 1,500 2,200
Net Gas Production Target (MMcf/d) 1,050 1,225 1,775
Net Revenue Interest Gross-up 81% 80% 80%
Gross Gas Production Target (MMcf/d) 1,293 1,525 2,223
BTU Upgrade (2) x1.100 x1.100 x1.100
Gross Gas Production Target (BBtu/d) 1,422 1,678 2,446
Firm Transportation / Firm Sales (BBtu/d) 1,775 2,225 3,150
Estimated % Utilization of FT/FS 80% 75% 78%
Marketable Firm Transport (BBtu/d) (3) 225 325 325
Estimated % Utilization of FT/FS (Including Marketable FT) 92% 88% 87%
Cost of Unutilized / Unmarketable FT ($MM) $1.8 $10.8 $21.1
$ / Mcfe of Net Production Target $0.02 $0.02 $0.03
% FT Utilization
(including
marketable FT):
% FT Utilization
(including
marketable FT):• Antero’s firm transport (FT) is
well utilized during the
forecast period (75% - 80%)
− Excess FT for acquisitions
and well productivity
improvements
• A portion of the excess FT is
highly marketable, further
increasing utilization to the
87% - 92% range
• Cost of remaining unutilized
FT is immaterial ($0.02 -
$0.03/Mcfe assuming net
production target)
• Expect to fully utilize FT
portfolio by 2018
92% 88% 87%
Keys to Execution
Local Presence
 Antero has more than 4,500 employees and contract personnel working full-time
for Antero in West Virginia. 79% of these personnel are West Virginia residents.
 Land office in Ellenboro, WV
 District office in Bridgeport, WV
 192 (44%) of Antero’s 433 employees are located in West Virginia and Ohio
Safety & Environmental
 Five company safety representatives and 56 safety consultants cover all
material field operations 24/7 including drilling, completion, construction and
pipelining
 41 person environmental staff plus outside consultants monitor all operations
and perform baseline water well testing
Central Fresh Water
System & Water
Recycling
 Numerous sources of water – built central water system to source fresh water
for completions
 Antero recycled over 80% of its flowback and produced water through the first 9
months of 2014 – no discharge to water treatment plants in West Virginia
Natural Gas
Vehicles (NGV)
 Antero supported the first natural gas fueling station in West Virginia
 Antero has 30 NGV trucks and plans to continue to convert its truck fleet to NGV
Pad Impact Mitigation
 Closed loop mud system – no mud pits
 Protective liners or mats on all well pads in addition to berms
Natural Gas Powered
Drilling Rigs & Frac
Equipment
 11 of Antero’s contracted drilling rigs are currently running on natural gas
 First natural gas powered clean fleet frac crew began operations this summer
Green Completion Units
 All Antero well completions use green completion units for completion flowback,
essentially eliminating methane emissions (full compliance with EPA 2015
requirements)
LEED Gold Headquarters
Building
 Recently moved into new corporate headquarters in Denver, Colorado that has
been LEED Gold Certified
HEALTH, SAFETY, ENVIRONMENT & COMMUNITY
Antero Core Values: Protect Our People, Communities And The Environment
Strong West Virginia
Presence
 79% of all Antero Marcellus
employees and contract
workers are West Virginia
residents
 Antero named Business of
the Year for 2013 in
Harrison County, West
Virginia “For outstanding
corporate citizenship and
community involvement”
 Antero representatives
recently participated in a
ribbon cutting with the
Governor of West Virginia
for the grand opening of
the first natural gas fueling
station in the state; Antero
supported the station with
volume commitments for
its NGV truck fleet
27
CLEAN FLEET & CNG TECHNOLOGY LEADER
● Antero has contracted for two clean completion
fleets to enhance the economics of its completion
operations and reduce the environmental impact
● Replaces diesel engines (for pressure pumping)
with electric motors powered by natural gas-fired
electric generators
● A clean fleet allows Antero to fuel part of its
completion operations from field gas instead of
more expensive diesel fuel. Benefits of using a
clean fleet include:
− Reduce fuel costs by up to 80%
representing cost savings of up to
$40,000/day
− Reduces NOx and CO emissions by 99%
− Eliminates 25 diesel trucks from the roads
for an average well completion
− Reduces silica dust to levels 90% below
OSHA permissible exposure limits resulting
in a safer and cleaner work environment
− Significantly reduces noise pollution from a
well site
− Is the most environmentally responsible
completion solution in the oil and gas
industry
• Additionally, Antero utilizes compressed natural
gas (CNG) to fuel its truck fleet in Appalachia
− Antero supported the first natural gas fueling
station in West Virginia
− Antero has 30 NGV trucks and plans to
continue to convert its truck fleet to NGV
28
29
Antero Midstream (NYSE: AM)
Asset Overview
1. Represents inception to date actuals as of 6/30/2014 and 2H 2014 and next twelve months (NTM) guidance.
2. Includes $14.7 million of maintenance capex. 30
• Gathering and compression assets in core of rapidly
growing Marcellus and Utica Shale plays
– Acreage dedication of ~390,000 net leasehold
acres for gathering and compression services
– 100% fixed fee long term contracts
Utica
Shale
Marcellus
Shale
Projected Midstream Infrastructure(1)
Marcellus
Shale
Utica
Shale Total
YE 2014E Cumulative Gathering/
Compression Capex ($MM) $850 $350 $1,200
Gathering Pipelines
(Miles) 180 85 265
Compression Capacity
(MMcf/d) 370 - 370
Condensate Gathering Pipelines
(Miles) - 20 20
NTM (9/30/2015) Gathering/
Compression Capex ($MM)(2) $473 $129 $602
Gathering Pipelines
(Miles) 219 108 327
Compression Capacity
(MMcf/d) 835 - 835
Condensate Gathering Pipelines
(Miles) - 27 27
Midstream Assets
SUBSTANTIAL INVESTMENT IN MIDSTREAM MLP
(NYSE: AM)
ANTERO MIDSTREAM ASSETS – RICH GAS MARCELLUS
31
• Provides Marcellus gathering and compression
services
− Liquids-rich gas is delivered to MWE’s Sherwood
Complex for processing
• Significant growth projected over the next twelve
months as set out below:
• Antero sold the Harrison County portion of its gathering
system to a 3rd party midstream company in 2012,
which is now recognized as the 3rd Party Gathering and
Compression Dedication area
• Development upside as AR continues to drill, step-out
and add acreage
Marcellus Gathering & Compression
Note: Antero acreage position reflects tax districts in which greater than 3,000 net acres are owned.
YE 2014 9/30/2015
Gathering Pipelines (Miles) 180 219
Compression Capacity (MMcf/d) 370 835
WV/PA Utica Dry Gas Gathering & Compression
• Further development upside in 167,000 net acres of
Utica deep rights beneath the Marcellus Shale
− Will require a separate dry gas gathering system
32
• Provides Utica natural gas and condensate gathering
services
− Liquids-rich gas delivered into MWE’s Seneca
Complex for processing
− Condensate delivered to centralized stabilization
and truck loading facilities
• Significant growth projected over the next twelve
months as set out below:
• Development upside as AR continues to drill, step-out
and add acreage
Utica Gathering
Note: Antero acreage position reflects tax districts in which greater than 3,000 net acres are owned.
ANTERO MIDSTREAM ASSETS – RICH & DRY GAS UTICA
YE 2014 9/30/2015
Gathering Pipelines (Miles) 85 108
Condensate Pipelines (Miles) 20 27
Utica Compression
• Opportunity to build up to ten new compressor stations
that are planned to support AR development over the
next several years
− Compressor stations are not included in AM NTM
forecast
33
APPENDIX
33
PRO FORMA CAPITALIZATION($ in millions) 9/30/2014
Pro Forma $1.15 Bn AM IPO(4)
9/30/2014
Cash $6 $256
Senior Secured Revolving Credit Facility 1,505 662
6.00% Senior Notes Due 2020 525 525
5.375% Senior Notes Due 2021 1,000 1,000
5.125% Senior Notes Due 2022 1,100 1,100
Net Unamortized Premium 8 8
Total Debt $4,138 $3,295
Net Debt $4,132 $3,039
Minority Interest - $326
Shareholders' Equity $3,751 $4,372
Net Book Capitalization $7,883 $7,737
Enterprise Value(1) $15,992 $15,225
Financial & Operating Statistics
LTM EBITDAX $1,047 $1,047
LQA EBITDAX $1,109 $1,109
LTM Interest Expense(2) $155 $138
Proved Reserves (Bcfe) (6/30/2014) 9,107 9,107
Proved Developed Reserves (Bcfe) (6/30/2014) 2,772 2,772
Credit Statistics
Net Debt / LTM EBITDAX 3.9x 2.9x
Net Debt / LQA EBITDAX 3.7x 2.7x
LTM EBITDAX / Interest Expense 6.8x 7.6x
Net Debt / Net Book Capitalization 52.4% 39.3%
Net Debt / Proved Developed Reserves ($/Mcfe) $1.49 $1.10
Net Debt / Proved Reserves ($/Mcfe) $0.45 $0.33
Liquidity
Credit Facility Commitments(3)(4) $3,000 $4,000
Less: Borrowings (1,505) (662)
Less: Letters of Credit (332) (332)
Plus: Cash 6 256
Liquidity (Undrawn Credit Facility + Cash) $1,169 $3,262
1. Equity valuation based on 262.0 million shares outstanding and a share price of $45.26 as of 12/2/2014. Enterprise value includes net debt plus minority interest.
2. LTM interest expense adjusted for $1,578 million net proceeds from IPO priced on 10/14/2013 and $1,000 million 5.375% Senior Notes priced on 10/24/2013 net of fees; assumes $525 million 9.375%
Senior Notes, $25 million 9.00% Senior Notes, $140 million 7.25% Senior Notes repaid at 10/31/2013 with residual cash used to repay bank debt. Adjusted for $600 million 5.125% Senior Notes priced
on 4/23/2014 net of fees; $260 million of 7.25% Senior Notes and $315 million of bank debt repaid. Adjusted for $500 million 5.125% Senior Notes add-on priced on 9/4/2014 at 100.5 net of fees; $496
million of bank debt repaid.
3. AR lender commitments under the facility increased to $3.0 billion from $2.5 billion on 10/16/2014; commitments can be expanded to the full $4.0 billion borrowing base upon bank approval. AM credit
facility of $1 billion as of 11/4/2014.
4. Pro forma for $1,150 million IPO of 70% post-offering owned Antero Midstream; $843 million of debt repaid, $250 million of cash left at AM and $57 million of transaction expenses. AM $1 billion credit
facility currently undrawn.
34
ANTERO RESOURCES – 2014 GUIDANCE
35
Key Variable 2014 Guidance Range
Natural Gas Realized Price Differential to NYMEX ($/Mcf)(2) $(0.15) – $(0.25)
Oil Realized Price Differential to WTI ($/Bbl) $(10.00) – $(12.00)
NGL Realized Price (% of WTI) 53% – 57%
Net Production (MMcfe/d) 990 – 1,010
Net Natural Gas Production (MMcf/d) 840 – 850
Net Liquids Production (Bbl/d) 25,000 – 26,000
Cash Production Expense ($/Mcfe)(3) $1.50 – $1.60
Marketing Expense, Net ($/Mcfe) $0.10 – $0.20
G&A Expense ($/Mcfe) $0.25 - $0.30
Total Wells Spud 215
Capital Expenditure ($MM)
Drilling & Completion $2,400
Midstream $850
Land $450
Total Capex ($MM) $3,700
1. Financial assumptions per Company press release dated 8/26/2014.
2. Antero’s processed tailgate and unprocessed dry gas production is greater than 1000 BTU on average.
3. Includes lease operating expenses, gathering, compression and transportation expenses and production taxes. Excludes net marketing expense.
Key 2014 Operating & Financial Assumptions(1)
118 118 118
162
189
214
285
371
420
450
485
Marcellus Net Acres Utica Net Acres
0
25
50
75
100
125
150
175
200
225
250
275
300
325
0
100
200
300
400
500
600
700
800
900
1,000
Jun-09 Dec-09 Jun-10 Dec-10 Jun-11 Dec-11 Jun-12 Dec-12 Jun-13 Dec-13 Jun-14
Net Production (MMcfe/d) (left axis) Gross Operated Horizontal Well Count (right axis)
36
AR “NAV” GROWTH
(MMcfe/d)
(# of Gross Wells)
Initial Antero
Marcellus Wells
Initial Antero
Utica Wells
 Land acquisitions and drill bit drive NAV growth
Added 35,000 net acres in
1H 2014 for ~$240 million,
which resulted in 2.0 Tcfe
of 3P reserves and $1.5
billion of PV-10 value (1)
1. Assuming June 30, 2014 SEC Pricing.
Average Rig Count
20 Rigs
1 Rig
LOWEST FINDING & DEVELOPMENT COST
AMONG U.S. PRODUCERS
37
3-Year All-In F&D Cost – Excluding Revisions ($/Mcfe) through 2013
Source: Credit Suisse research dated 4/28/2014.
 Antero ranks as the most efficient finder and developer of reserves, on a per Mcfe basis, based on a 2011-2013 average all-in F&D cost
analysis prepared by Credit Suisse
$10.24
$7.14
$6.68
$5.74
$4.66
$4.66
$4.54
$4.23
$4.01
$3.70
$3.63
$3.28
$3.12
$3.07
$3.05
$3.05
$2.91
$2.91
$2.88
$2.87
$2.78
$2.66
$2.57
$2.40
$2.06
$1.94
$1.74
$1.60
$1.53
$1.26
$1.04
$0.84
$0.79
$0.58
$0 $2 $4 $6 $8 $10 $12
MHR
APC
GPOR
MUR
APA
MRO
WLL
FANG
KOG
CRK
EXXI
EOX
PVA
CXO
DVN
KWK
FST
DNR
NBL
EOG
CRZO
PXD
BCEI
SD
CHK
ROSE
SFY
ATHL
EPE
REXX
SWN
PDCE
RRC
AR
MARCELLUS SINGLE WELL ECONOMICS
– IN ETHANE REJECTION
38
DRY GAS LOCATIONS RICH GAS LOCATIONS
HIGHLY
RICH GAS
LOCATIONS
Assumptions
 Natural Gas – 11/28/2014 strip
 Oil – 11/28/2014 strip
 NGLs – 55% of Oil Price
NYMEX
($/MMBtu)
WTI
($/Bbl)
C3+ NGL(2)
($/Bbl)
2015 $3.82 $67 $37
2016 $3.83 $70 $38
2017 $3.96 $73 $40
2018 $4.09 $76 $41
2019+ $4.21 $77 $42
Marcellus SSL Well Economics and Total Gross Locations(1)
Classification
Highly-Rich Gas/
Condensate
Highly-Rich
Gas Rich Gas Dry Gas
Modeled BTU 1313 1250 1150 1050
EUR (Bcfe): 16.1 14.6 13.1 11.9
EUR (MMBoe): 2.7 2.4 2.2 2.0
% Liquids: 33% 24% 12% 0%
Lateral Length (ft): 7,000 7,000 7,000 7,000
Stage Length (ft): 225 225 225 225
Well Cost ($MM): $9.5 $9.5 $9.5 $9.5
Bcfe/1,000’: 2.3 2.1 1.9 1.7
Pre-Tax NPV10 ($MM): $13.1 $8.5 $2.2 $1.7
Pre-Tax ROR: 55% 37% 17% 16%
Net F&D ($/Mcfe): $0.69 $0.76 $0.86 $0.94
Payout (Years): 1.6 2.3 4.8 5.2
Gross 3P Locations(3): 727 896 633 875
1. Well economics are based on 11/28/2014 strip differential pricing and related transportation costs. Includes gathering, compression and processing fees.
2. Pricing for a 1225 BTU y-grade ethane rejection barrel.
3. Undeveloped well locations as of 9/30/2014.
727
896
633
875
55% 37%
17% 16%
0
200
400
600
800
1,000
0%
25%
50%
75%
100%
Highly-Rich Gas/
Condensate
Highly-Rich Gas Rich Gas Dry Gas
Total3PLocations
ROR
Locations ROR
2H 2014 /
2015
Drilling Plan
248
143
87
265 254
14%
57%
76%
50%
45%
0
50
100
150
200
250
300
0%
20%
40%
60%
80%
100%
Condensate Highly-Rich Gas/
Condensate
Highly-Rich Gas Rich Gas Dry Gas
Total3PLocations
ROR
Locations ROR
UTICA SINGLE WELL ECONOMICS
– IN ETHANE REJECTION
39
DRY GAS LOCATIONS RICH GAS LOCATIONS
HIGHLY
RICH GAS
LOCATIONS
Utica Well Economics and Gross Locations(1)
Classification Condensate
Highly-Rich Gas/
Condensate
Highly-Rich
Gas Rich Gas Dry Gas
Modeled BTU 1275 1235 1215 1175 1050
EUR (Bcfe): 7.4 13.3 19.9 18.5 16.6
EUR (MMBoe): 1.2 2.2 3.3 3.1 2.8
% Liquids 35% 26% 21% 14% 0%
Lateral Length (ft): 7,000 7,000 7,000 7,000 7,000
Stage Length (ft): 240 240 240 240 240
Well Cost ($MM): $11.0 $11.0 $11.0 $11.0 $11.0
Bcfe/1,000’: 1.1 1.9 2.8 2.7 2.4
Pre-Tax NPV10 ($MM): $1.2 $9.6 $16.6 $11.5 $10.0
Pre-Tax ROR: 14% 57% 76% 50% 45%
Net F&D ($/Mcfe): $1.84 $1.02 $0.68 $0.73 $0.82
Payout (Years): 5.5 1.5 1.1 1.5 1.5
Gross 3P Locations(3): 248 143 87 265 254
1. Well economics are based on 11/28/2014 strip differential pricing and related transportation costs. Includes gathering, compression and processing fees.
2. Pricing for a 1225 BTU y-grade ethane rejection barrel.
3. Undeveloped well locations as of 9/30/2014, adjusted for subsequent 130 gross locations acquired as of 11/3/2014. 3P locations representative of BTU regime; EUR and economics within regime
will vary based on BTU content.
2H 2014 / 2015
Drilling Plan
Assumptions
 Natural Gas – 11/28/2014 strip
 Oil – 11/28/2014 strip
 NGLs – 55% of Oil Price
NYMEX
($/MMBtu)
WTI
($/Bbl)
C3+ NGL(2)
($/Bbl)
2015 $3.82 $67 $37
2016 $3.83 $70 $38
2017 $3.96 $73 $40
2018 $4.09 $76 $41
2019+ $4.21 $77 $42
3-Year Average Growth – Adjusted Recycle Ratio through 2013
0.0x
2.0x
4.0x
6.0x
4.8x
3.3x3.5x
2.4x
$0.00
$1.00
$2.00
$3.00
$4.00
$5.00
$6.00
$1.15 $1.18 $1.21
$1.60
Other Peers
LOW DEVELOPMENT COST DRIVES BEST IN CLASS
RECYCLE RATIOS
40
Source: Proved developed F&D industry data based on company presentations, 10-Ks and press releases. Defined as total drilling and completion capital expenditures for the period divided by PDP and
PDNP volumes added after adding back production for the period. Includes all drilling and completion costs but excludes land and acquisition costs for all companies.
1. Antero data pro forma for Arkoma and Piceance divestitures in 2012.
3-Year Proved Development Costs ($/Mcfe) through 2013
Antero Appalachia-Focused Peers
Source: Wall Street research. Defined as 2011-2013 average (Cash Operating Netback / PD F&D costs) x (1 + 2013-2015 consensus production CAGR). Antero’s production CAGR based on guidance
targets. PD F&D Costs defined as total drilling and completion capital expenditures for the period divided by PDP and PDNP volumes added after adding back production for the period Includes all drilling
and completion costs but excludes land and acquisition costs for all companies.
1. Antero data pro forma for Arkoma and Piceance divestitures in 2012.
Antero Appalachia-Focused Peers
$/Mcfe
Other Peers
-
5.0
10.0
15.0
20.0
25.0
30.0
30-DayRate(MMcfe/d)
Liquids Gas
51% Avg. Liquids
7,201’ Avg. Lateral
Condensate
Highly-Rich Gas /
Condensate
Highly-Rich Gas Rich Gas
ANTERO UTICA SHALE WELLS – 30-DAY RATES
Outstanding 30-day average rates with high liquids content
– Antero’s wells produced against 1,100 psi line pressure until late January 2014 due to lack of compression facilities
– First 120 MMcf/d compressor station started up in late January 2014, a second 120 MMcf/d station was placed online in late
March 2014 and a third 100 MMcf/d station was placed online in early July 2014
37% Avg. Liquids
5,993’ Avg. Lateral
22% Avg. Liquids
7,481’ Avg. Lateral
14% Avg. Liquids
6,790’ Avg.
Lateral
Type Curve Regimes (1)
1. Excludes wells under choke management program.
2. Normalized for 7,000’ lateral.
3. In ethane rejection.
14.3 MMcfe/d
or
2,383 Boe/d 14.6 MMcfe/d
20.9 MMcfe/d
18.4 MMcfe/d
13.9 MMcfe/d
Normalized(2)
17.0 MMcfe/d
Normalized(2)
19.5 MMcfe/d
Normalized(2)
19.0 MMcfe/d
Normalized(2)
Average 30-Day Production Rate(3)
41
CONSIDERABLE RESERVE BASE WITH
ETHANE OPTIONALITY
 30 year proved reserve life based on 1H 2014 production annualized
 Reserve base provides significant exposure to liquids-rich projects
– 3P reserves of over 2.3 BBbl of NGLs and condensate in ethane recovery mode; 33% liquids
1. Ethane rejection occurs when ethane is left in the wellhead gas stream as the gas is processed, rather than being separated out and sold as a liquid after fractionation. When ethane is left in the gas
stream, the BTU content of the residue gas at the outlet of the processing plant is higher. Producers will elect to “reject” ethane when the price received for the higher BTU residue gas is greater than the
price received for the ethane being sold as a liquid after fractionation. When ethane is recovered, the BTU content of the residue gas is lower, but a producer is then able to recover the value of the
ethane sold as a separate NGL product.
ETHANE REJECTION(1) ETHANE RECOVERY(1)
42
Marcellus – 26.4 Tcfe
Utica – 6.4 Tcfe
Upper Devonian – 4.6 Tcfe
37.5
Tcfe
Gas – 31.7 Tcf
Oil – 86 MMBbls
NGLs – 880 MMBbls
Marcellus – 31.3 Tcfe
Utica – 7.3 Tcfe
Upper Devonian – 5.1 Tcfe
43.7
Tcfe
Gas – 29.3 Tcf
Oil – 86 MMBbls
NGLs – 2,305 MMBbls
15%
Liquids
33%
Liquids
Moody's S&P
POSITIVE RATINGS MOMENTUM
Moody’s / S&P Historical Corporate Credit Ratings
“We could raise the ratings due to our assessment of an improvement in
the company's financial profile. An improvement in the financial profile
would include maintaining FFO to debt of greater than 45% and
narrowing the amount that the company outspends its cash flows by.”
- S&P Credit Research, September 2014
“An upgrade could be considered if debt / average daily production is
sustained below $20,000 per boe and debt / proved-developed
reserves is sustained below $8.00 per boe. An upgrade would also be
contingent on Antero maintaining unleveraged cash margins greater
than $25.00 per boe and retained cash flow to debt over 40%.”
- Moody’s Credit Research, September 2014
Credit Rating
(Moody’s / S&P)
Ba3 / BB-
B1 / B+
B2 / B
B3 / B-
9/1/2010 2/24/2011 10/21/2013 9/4/20145/31/13
Ba2 / BB
Ba1 / BB+
Caa1 / CCC+
(1)
___________________________
1. Represents corporate credit rating of Antero Resources Corporation / Antero Resources LLC.
Baa3 / BBB-
Moody’s Upgrade Criteria S&P Upgrade Criteria
43
9/30/2014
PRO FORMA OFFERING – BALANCE SHEET POSITIONED
FOR LONG-TERM GROWTH
PRO FORMA DEBT MATURITY PROFILE (1)
PRO FORMA WEIGHTED AVERAGE INTEREST RATE AND MATURITY(1)
44
1. As of 9/30/2014 per 10-Q; pro forma for $1,150 million AM IPO priced on 11/4/2014; net proceeds of $843 million used to repay the credit facility.
2. Current yields of senior notes tranches represent the current yield-to-worst per Bloomberg.
3. Represents weighted average interest rate under the revolving credit facility as of 9/30/2014.
Senior Secured Revolving Credit Facility Senior Notes
($ in millions) As At Interest Current Maturity Maturity
09/30/14 Rate Yield
(2)
(Years) (Date)
Senior Secured Revolving Credit Facility $662 2.440%
(3)
2.440%
(3)
4.6 May-19
6.0% Senior Notes due 2020 525 6.000% 4.836% 6.2 Dec-20
5.375% Senior Notes due 2021 1,000 5.375% 4.918% 7.1 Nov-21
5.125% Senior Notes due 2022 1,100 5.125% 5.162% 8.2 Dec-22
Total Long-Term Debt $3,287
Weighted Average: 4.800% 4.487% 6.8 Jul-21
 The recent bond offerings, at progressively lower coupons, have allowed Antero to reduce its cost of debt to approximately 5.0% and
enhance liquidity while extending the pro forma average debt maturity to June 2021
 Current cost of debt 4.8%, average debt maturity 6.8 years
$662
$525
$1,000
$1,100
$0
$200
$400
$600
$800
$1,000
$1,200
2014 2015 2016 2017 2018 2019 2020 2021 2022
($inMillions)
Needed to make up
for base declines in
conventional and
GOM production
? ??
3,000 Antero
Drilling Locations
Permian
Niobrara
GraniteWash
Barnett
Haynesville
U.S. INCREMENTAL GAS SUPPLY BREAK-EVEN PRICE CURVE(1)
45
 Low cost, liquids-rich Utica and Marcellus Shales will remain attractive in most commodity price environments
Utica
Shale
SW (Rich)
Marcellus
Shale
1. Source: Credit Suisse report dated January 2014 – Break even price for 15% after tax rate-of-return; assumes $90.00/Bbl WTI
NE (Dry)
Marcellus
Shale
Eagle Ford
Shale
MARCELLUS & UTICA – ADVANTAGED ECONOMICS
MARCELLUS/UTICA HAS DRIVEN GAS SUPPLY GROWTH
 Of the 23 Bcf/d of expected incremental gas
supply from 2009 to 2015, ~18 Bcf/d, or 78%,
is expected to be generated from Marcellus
and Utica production
 Marcellus and Utica gross gas production in
2015 is expected to grow 3.6 Bcf/d, which
represents the total expected growth in overall
supply from all areas for 2015(1)
46
Gas Supply Growth by Area: 2009 – 2015E
Lower 48 Gas Supply by Area
Source: Simmons & Company International, “2015 US Natural Gas Outlook and Updated Long Term Demand Forecast,” September 2014; EIA.
1. Other contributing areas to growth include the Permian (+0.5 Bcf/d), Eagle Ford (+0.6 Bcf/d), Williston (+0.3 Bcf/d) and DJ (+0.2 Bcf/d), offset by declines in the Barnett (-0.3 Bcf/d)
and Haynesville (-0.6 Bcf/d).
Sherwood 7
Marcellus &
Utica
78%
Eagle Ford
22%
(MMcf/d)
0
2,000
4,000
6,000
8,000
10,000
12,000
14,000
16,000
18,000
Nov-12 Nov-13 Nov-14
Marcellus production
has driven U.S. gas
supply growth
LNG Exports
48%
Mexico/Canada
Exports
18%
Power
Generation
17%
Transportation
1%
Industrial
16%
20 Bcf/d OF INCREMENTAL GAS DEMAND BY 2020
 More than 65% of the 20 Bcf/d in incremental
gas demand forecast by 2020 is expected to
be generated from exports:
− LNG: 9.5 Bcf/d (~48%)
− Mexico/Canada: 3.5 Bcf/d (~18%)
 Of the 9.5 Bcf/d of expected incremental
demand from LNG export projects, 5.8 Bcf/d
(or 61%) of the projects have secured the
necessary DOE and FERC permits
47
Incremental Demand Growth Through 2020 by Category
Projected Incremental Gas Demand Through 2020
Source: Simmons & Company International, “2015 US Natural Gas Outlook and Updated Long Term Demand Forecast,” September 2014.
Sherwood 7
2
5
9
13
17
20
0
4
8
12
16
20
2015 2016 2017 2018 2019 2020
Mexico/Canada Exports Power Generation
Transportation Petrochem
LNG Exports
9.5 Bcf/d of the 20 Bcf/d of
incremental demand is
expected to come from
LNG exports
(Bcf/d)
LNG
Exports
Power Gen
Petrochem
LNG EXPORTS BY PROJECT – EXPECTED START UP
 Assuming 9.5 Bcf/d of LNG exports by 2020,
the U.S. would be the world’s 3rd largest LNG
exporter (behind Qatar and Australia)
− 7.7 Bcf/d (81%) of the 9.5 Bcf/d of expected LNG
exports have secured US DOE non-FTA (free
trade agreement) permit approval
− 6.7 Bcf/d (four projects, 70%) have been
awarded FERC construction permits (see next
page for more detail)
 The first LNG export project, Sabine Pass LNG
Train 1 is expected to commence operations in
early 2016
− Antero has committed to 50 MMcf/d on each of
Sabine Pass Trains 1-4
 In addition to the LNG projects to the right,
other potential LNG projects beyond 2020
include Lake Charles (Trains 2-3), Excelerate
(Lavaca) and Golden Pass (Exxon)
48
LNG Exports by Project Through 2020
(in Bcf/d)
2015 2016 2017 2018 2019 2020
Sabine Pass 1 - 0.6 - - - -
Sabine Pass 2 - 0.6 - - - -
Sabine Pass 3 - - 0.6 - - -
Sabine Pass 4 - - 0.6 - - -
Sabine Pass 5 - - - - 0.6 -
Cove Point 1 - - 0.4 - - -
Cove Point 2 - - - 0.4 - -
Cameron 1 - - - 0.6 - -
Cameron 2 - - - 0.6 - -
Cameron 3 - - - - 0.6 -
Freeport 1 - - - 0.5 - -
Freeport 2 - - - - 0.5 -
Freeport 3 - - - - 0.5 -
Freeport 4 - - - - - 0.4
Corpus Christi 1 - - - - 0.6 -
Corpus Christi 2 - - - - - 0.6
Lake Charles 1 - - - - - 0.6
LNG Incremental Exports - 1.2 1.6 2.2 2.9 1.7
LNG Cumulative Exports - 1.2 2.8 5.0 7.9 9.5
Antero Supply Agreements
for Portion of Capacity
Source: Simmons & Company International, “2015 US Natural Gas Outlook and Updated Long Term Demand Forecast,” September 2014.
Data updated for recent announcements subsequent to Simmons report.
LNG EXPORTS BY PROJECT – CURRENT STATUS
49
LNG Exports by Project – Current Status
Sherwood 7
Dates of Key Milestones Send Out Non-
DOE Non-FTA FERC FTA Permit Underlying
Permit Construction Capacity Gas Demand
Project Awarded Approval (Bcf/d) (Bcf/d) Contracts Offtakers
Sabine Pass 1-4 05/20/11 04/16/12 2.20 2.42 Fully Subscribed BG, GasNatural Fenosa,
Kogas, GAIL
Cove Point 09/11/13 09/29/14 0.77 0.85 Fully Subscribed Sumitomo, GAIL, Tokyo Gas
Cameron 02/11/14 06/19/14 1.70 1.87 Fully Subscribed Sempra, Misui, Mitsubishi,
GDF Suez
Freeport 05/17/13 07/30/14 1.40 1.54 Fully Subscribed Osaka Gas, Chubu Electric,
BP, Toshiba, SK E&S
Lake Charles 08/07/13 Expected 2015 2.00 2.20 Fully Subscribed BG
Subtotal 8.07 8.88
Freeport Phase II 11/15/13 Pending 0.40 0.44 Not Subscribed N/A
Total 8.47 9.32
Source: Simmons & Company International, “2015 US Natural Gas Outlook and Updated Long Term Demand Forecast,” September 2014.
Data updated for recent announcements subsequent to Simmons report.
CAUTIONARY NOTE
The SEC permits oil and gas companies, in their filings with the SEC, to disclose only proved, probable and possible reserve estimates
(collectively, “3P”). Antero has provided internally generated estimates for proved, probable and possible reserves in this presentation in
accordance with SEC guidelines and definitions. The estimates of proved, probable and possible reserves as of June 30, 2014 included in this
presentation have been audited by Antero’s third-party engineers. Unless otherwise noted, reserve estimates as of June 30, 2014 assume ethane
rejection and strip pricing.
Actual quantities that may be ultimately recovered from Antero’s interests may differ substantially from the estimates in this presentation. Factors
affecting ultimate recovery include the scope of Antero’s ongoing drilling program, which will be directly affected by commodity prices, the
availability of capital, drilling and production costs, availability of drilling services and equipment, drilling results, lease expirations, transportation
constraints, regulatory approvals and other factors; and actual drilling results, including geological and mechanical factors affecting recovery rates.
In this presentation:
 “3P reserves” refer to Antero’s estimated aggregate proved, probable and possible reserves as of June 30, 2014. The SEC prohibits
companies from aggregating proved, probable and possible reserves in filings with the SEC due to the different levels of certainty associated
with each reserve category.
 “EUR,” or “Estimated Ultimate Recovery,” refers to Antero’s internal estimates of per well hydrocarbon quantities that may be potentially
recovered from a hypothetical future well completed as a producer in the area. These quantities do not necessarily constitute or represent
reserves within the meaning of the Society of Petroleum Engineer’s Petroleum Resource Management System or the SEC’s oil and natural gas
disclosure rules.
 “Condensate” refers to gas having a heat content between 1250 BTU and 1300 BTU in the Utica Shale.
 “Highly-Rich Gas/Condensate” refers to gas having a heat content between 1275 BTU and 1350 BTU in the Marcellus Shale and 1225 BTU
and 1250 BTU in the Utica Shale.
 “Highly-Rich Gas” refers to gas having a heat content between 1200 BTU and 1275 BTU in the Marcellus Shale and 1200 BTU and 1225 BTU
in the Utica Shale.
 “Rich Gas” refers to gas having a heat content of between 1100 BTU and 1200 BTU.
 “Dry Gas” refers to gas containing insufficient quantities of hydrocarbons heavier than methane to allow their commercial extraction or to
require their removal in order to render the gas suitable for fuel use.
Regarding Hydrocarbon Quantities
50

More Related Content

What's hot

Company website presentation March 2014
Company website presentation March 2014Company website presentation March 2014
Company website presentation March 2014AnteroResources
 
Company website presentation january 2014
Company website presentation   january 2014Company website presentation   january 2014
Company website presentation january 2014AnteroResources
 
Company website presentation october 2014
Company website presentation   october 2014Company website presentation   october 2014
Company website presentation october 2014
AnteroResources
 
Company Presentation October 2014
Company Presentation October 2014Company Presentation October 2014
Company Presentation October 2014
AnteroResources
 
Company website presentation - december 2013
Company website presentation - december 2013Company website presentation - december 2013
Company website presentation - december 2013AnteroResources
 
Company Website Presentation January 2014
Company Website Presentation January 2014Company Website Presentation January 2014
Company Website Presentation January 2014AnteroResources
 
Company Website Presentation - April 2014 (C)
Company Website Presentation - April 2014 (C)Company Website Presentation - April 2014 (C)
Company Website Presentation - April 2014 (C)AnteroResources
 
Company website presentation (b) January 2014
Company website presentation (b)  January 2014Company website presentation (b)  January 2014
Company website presentation (b) January 2014AnteroResources
 
Company Overview December 2014
Company Overview December 2014Company Overview December 2014
Company Overview December 2014
AnteroResources
 
Company website presentation february 2014 (b)
Company website presentation   february 2014 (b)Company website presentation   february 2014 (b)
Company website presentation february 2014 (b)AnteroResources
 
Company Overview November 2013
Company Overview November 2013Company Overview November 2013
Company Overview November 2013
AnteroResources
 
Company website presentation april 2014
Company website presentation   april 2014Company website presentation   april 2014
Company website presentation april 2014AnteroResources
 
Company website presentation (b) november 2015
Company website presentation (b)   november 2015Company website presentation (b)   november 2015
Company website presentation (b) november 2015
AnteroResources
 
Company website presentation may 2014 (b)
Company website presentation   may 2014 (b)Company website presentation   may 2014 (b)
Company website presentation may 2014 (b)AnteroResources
 
Company website presentation november 2015
Company website presentation   november 2015Company website presentation   november 2015
Company website presentation november 2015
AnteroResources
 
Company Website Presentation November 2015
Company Website Presentation November 2015Company Website Presentation November 2015
Company Website Presentation November 2015
AnteroResources
 
Company website presentation may 2014
Company website presentation   may 2014Company website presentation   may 2014
Company website presentation may 2014AnteroResources
 
Company Presentation - October 2014
Company Presentation - October 2014Company Presentation - October 2014
Company Presentation - October 2014
AnteroResources
 
Company website presentation (a) january 2016
Company website presentation (a)   january 2016Company website presentation (a)   january 2016
Company website presentation (a) january 2016
AnteroResources
 

What's hot (19)

Company website presentation March 2014
Company website presentation March 2014Company website presentation March 2014
Company website presentation March 2014
 
Company website presentation january 2014
Company website presentation   january 2014Company website presentation   january 2014
Company website presentation january 2014
 
Company website presentation october 2014
Company website presentation   october 2014Company website presentation   october 2014
Company website presentation october 2014
 
Company Presentation October 2014
Company Presentation October 2014Company Presentation October 2014
Company Presentation October 2014
 
Company website presentation - december 2013
Company website presentation - december 2013Company website presentation - december 2013
Company website presentation - december 2013
 
Company Website Presentation January 2014
Company Website Presentation January 2014Company Website Presentation January 2014
Company Website Presentation January 2014
 
Company Website Presentation - April 2014 (C)
Company Website Presentation - April 2014 (C)Company Website Presentation - April 2014 (C)
Company Website Presentation - April 2014 (C)
 
Company website presentation (b) January 2014
Company website presentation (b)  January 2014Company website presentation (b)  January 2014
Company website presentation (b) January 2014
 
Company Overview December 2014
Company Overview December 2014Company Overview December 2014
Company Overview December 2014
 
Company website presentation february 2014 (b)
Company website presentation   february 2014 (b)Company website presentation   february 2014 (b)
Company website presentation february 2014 (b)
 
Company Overview November 2013
Company Overview November 2013Company Overview November 2013
Company Overview November 2013
 
Company website presentation april 2014
Company website presentation   april 2014Company website presentation   april 2014
Company website presentation april 2014
 
Company website presentation (b) november 2015
Company website presentation (b)   november 2015Company website presentation (b)   november 2015
Company website presentation (b) november 2015
 
Company website presentation may 2014 (b)
Company website presentation   may 2014 (b)Company website presentation   may 2014 (b)
Company website presentation may 2014 (b)
 
Company website presentation november 2015
Company website presentation   november 2015Company website presentation   november 2015
Company website presentation november 2015
 
Company Website Presentation November 2015
Company Website Presentation November 2015Company Website Presentation November 2015
Company Website Presentation November 2015
 
Company website presentation may 2014
Company website presentation   may 2014Company website presentation   may 2014
Company website presentation may 2014
 
Company Presentation - October 2014
Company Presentation - October 2014Company Presentation - October 2014
Company Presentation - October 2014
 
Company website presentation (a) january 2016
Company website presentation (a)   january 2016Company website presentation (a)   january 2016
Company website presentation (a) january 2016
 

Viewers also liked

Company Overview - March 2015
Company Overview - March 2015Company Overview - March 2015
Company Overview - March 2015
AnteroResources
 
Company Overview September 2013
Company Overview September 2013Company Overview September 2013
Company Overview September 2013AnteroResources
 
Company Overview September 2013
Company Overview September 2013Company Overview September 2013
Company Overview September 2013
AnteroResources
 
Company website presentation (a) april 2015
Company website presentation (a)   april 2015Company website presentation (a)   april 2015
Company website presentation (a) april 2015
AnteroResources
 
Company website presentation (a) may 2016
Company website presentation (a)   may 2016Company website presentation (a)   may 2016
Company website presentation (a) may 2016
AnteroResources
 
4Q 2015 Earnings Call Presentation
4Q 2015 Earnings Call Presentation 4Q 2015 Earnings Call Presentation
4Q 2015 Earnings Call Presentation
AnteroResources
 
Company website presentation december 2015
Company website presentation   december 2015Company website presentation   december 2015
Company website presentation december 2015
AnteroResources
 
Company Overview November 2014
Company Overview November 2014Company Overview November 2014
Company Overview November 2014
AnteroResources
 
Company website presentation september 2016
Company website presentation   september 2016Company website presentation   september 2016
Company website presentation september 2016
AnteroResources
 
Company website presentation (c) october 2014
Company website presentation (c)   october 2014Company website presentation (c)   october 2014
Company website presentation (c) october 2014AnteroResources
 
Company website presentation (b) january 2016
Company website presentation (b)   january 2016Company website presentation (b)   january 2016
Company website presentation (b) january 2016
AnteroResources
 
Company website presentation february 2015
Company website presentation february 2015Company website presentation february 2015
Company website presentation february 2015
AnteroResources
 
Company Overview - April 2015
Company Overview - April 2015Company Overview - April 2015
Company Overview - April 2015
AnteroResources
 
1 q 2016 earnings call presentation 04.28.16_vf2
1 q 2016 earnings call presentation 04.28.16_vf21 q 2016 earnings call presentation 04.28.16_vf2
1 q 2016 earnings call presentation 04.28.16_vf2
AnteroResources
 
Company website presentation (a) november 2014(2)
Company website presentation (a)   november 2014(2)Company website presentation (a)   november 2014(2)
Company website presentation (a) november 2014(2)
AnteroResources
 
Company website presentation september 2015
Company website presentation   september 2015Company website presentation   september 2015
Company website presentation september 2015
AnteroResources
 
Company Overview - May 2015
Company Overview - May 2015Company Overview - May 2015
Company Overview - May 2015
AnteroResources
 
Barclays conference presentation (website) september 2016 v5
Barclays conference presentation (website)   september 2016 v5Barclays conference presentation (website)   september 2016 v5
Barclays conference presentation (website) september 2016 v5
AnteroResources
 
Company website presentation final april 2016
Company website presentation final   april 2016Company website presentation final   april 2016
Company website presentation final april 2016
AnteroResources
 
Company website presentation march 2014v2
Company website presentation   march 2014v2Company website presentation   march 2014v2
Company website presentation march 2014v2AnteroResources
 

Viewers also liked (20)

Company Overview - March 2015
Company Overview - March 2015Company Overview - March 2015
Company Overview - March 2015
 
Company Overview September 2013
Company Overview September 2013Company Overview September 2013
Company Overview September 2013
 
Company Overview September 2013
Company Overview September 2013Company Overview September 2013
Company Overview September 2013
 
Company website presentation (a) april 2015
Company website presentation (a)   april 2015Company website presentation (a)   april 2015
Company website presentation (a) april 2015
 
Company website presentation (a) may 2016
Company website presentation (a)   may 2016Company website presentation (a)   may 2016
Company website presentation (a) may 2016
 
4Q 2015 Earnings Call Presentation
4Q 2015 Earnings Call Presentation 4Q 2015 Earnings Call Presentation
4Q 2015 Earnings Call Presentation
 
Company website presentation december 2015
Company website presentation   december 2015Company website presentation   december 2015
Company website presentation december 2015
 
Company Overview November 2014
Company Overview November 2014Company Overview November 2014
Company Overview November 2014
 
Company website presentation september 2016
Company website presentation   september 2016Company website presentation   september 2016
Company website presentation september 2016
 
Company website presentation (c) october 2014
Company website presentation (c)   october 2014Company website presentation (c)   october 2014
Company website presentation (c) october 2014
 
Company website presentation (b) january 2016
Company website presentation (b)   january 2016Company website presentation (b)   january 2016
Company website presentation (b) january 2016
 
Company website presentation february 2015
Company website presentation february 2015Company website presentation february 2015
Company website presentation february 2015
 
Company Overview - April 2015
Company Overview - April 2015Company Overview - April 2015
Company Overview - April 2015
 
1 q 2016 earnings call presentation 04.28.16_vf2
1 q 2016 earnings call presentation 04.28.16_vf21 q 2016 earnings call presentation 04.28.16_vf2
1 q 2016 earnings call presentation 04.28.16_vf2
 
Company website presentation (a) november 2014(2)
Company website presentation (a)   november 2014(2)Company website presentation (a)   november 2014(2)
Company website presentation (a) november 2014(2)
 
Company website presentation september 2015
Company website presentation   september 2015Company website presentation   september 2015
Company website presentation september 2015
 
Company Overview - May 2015
Company Overview - May 2015Company Overview - May 2015
Company Overview - May 2015
 
Barclays conference presentation (website) september 2016 v5
Barclays conference presentation (website)   september 2016 v5Barclays conference presentation (website)   september 2016 v5
Barclays conference presentation (website) september 2016 v5
 
Company website presentation final april 2016
Company website presentation final   april 2016Company website presentation final   april 2016
Company website presentation final april 2016
 
Company website presentation march 2014v2
Company website presentation   march 2014v2Company website presentation   march 2014v2
Company website presentation march 2014v2
 

Similar to Company website presentation (a) december 2014

Antero Resources Company Presentation - Updated Jan 14, 2015
Antero Resources Company Presentation - Updated Jan 14, 2015Antero Resources Company Presentation - Updated Jan 14, 2015
Antero Resources Company Presentation - Updated Jan 14, 2015
Marcellus Drilling News
 
Antero Resources Company Overview Presentation - August 2014
Antero Resources Company Overview Presentation - August 2014Antero Resources Company Overview Presentation - August 2014
Antero Resources Company Overview Presentation - August 2014
Marcellus Drilling News
 
Company website presentation march 2015
Company website presentation   march 2015Company website presentation   march 2015
Company website presentation march 2015
AnteroResources
 
Company website-presentation-january-2015
Company website-presentation-january-2015Company website-presentation-january-2015
Company website-presentation-january-2015
anteromidstream
 
Antero Resources Company Presentation - Nov 2015
Antero Resources Company Presentation - Nov 2015Antero Resources Company Presentation - Nov 2015
Antero Resources Company Presentation - Nov 2015
Marcellus Drilling News
 
Company website presentation (c) october 2014
Company website presentation (c)   october 2014Company website presentation (c)   october 2014
Company website presentation (c) october 2014
AnteroResources
 
Company website presentation (a) january 2015
Company website presentation (a)   january 2015Company website presentation (a)   january 2015
Company website presentation (a) january 2015
AnteroResources
 
Company website presentation (a) february 2015
Company website presentation (a) february 2015Company website presentation (a) february 2015
Company website presentation (a) february 2015
AnteroResources
 
Company website presentation (b) january 2015
Company website presentation (b)   january 2015Company website presentation (b)   january 2015
Company website presentation (b) january 2015
AnteroResources
 
Company website presentation (b) january 2015
Company website presentation (b)   january 2015Company website presentation (b)   january 2015
Company website presentation (b) january 2015
AnteroResources
 
Company website presentation (a) november 2014
Company website presentation (a)   november 2014Company website presentation (a)   november 2014
Company website presentation (a) november 2014
AnteroResources
 

Similar to Company website presentation (a) december 2014 (11)

Antero Resources Company Presentation - Updated Jan 14, 2015
Antero Resources Company Presentation - Updated Jan 14, 2015Antero Resources Company Presentation - Updated Jan 14, 2015
Antero Resources Company Presentation - Updated Jan 14, 2015
 
Antero Resources Company Overview Presentation - August 2014
Antero Resources Company Overview Presentation - August 2014Antero Resources Company Overview Presentation - August 2014
Antero Resources Company Overview Presentation - August 2014
 
Company website presentation march 2015
Company website presentation   march 2015Company website presentation   march 2015
Company website presentation march 2015
 
Company website-presentation-january-2015
Company website-presentation-january-2015Company website-presentation-january-2015
Company website-presentation-january-2015
 
Antero Resources Company Presentation - Nov 2015
Antero Resources Company Presentation - Nov 2015Antero Resources Company Presentation - Nov 2015
Antero Resources Company Presentation - Nov 2015
 
Company website presentation (c) october 2014
Company website presentation (c)   october 2014Company website presentation (c)   october 2014
Company website presentation (c) october 2014
 
Company website presentation (a) january 2015
Company website presentation (a)   january 2015Company website presentation (a)   january 2015
Company website presentation (a) january 2015
 
Company website presentation (a) february 2015
Company website presentation (a) february 2015Company website presentation (a) february 2015
Company website presentation (a) february 2015
 
Company website presentation (b) january 2015
Company website presentation (b)   january 2015Company website presentation (b)   january 2015
Company website presentation (b) january 2015
 
Company website presentation (b) january 2015
Company website presentation (b)   january 2015Company website presentation (b)   january 2015
Company website presentation (b) january 2015
 
Company website presentation (a) november 2014
Company website presentation (a)   november 2014Company website presentation (a)   november 2014
Company website presentation (a) november 2014
 

More from AnteroResources

Company website presentation april 2017
Company website presentation   april 2017Company website presentation   april 2017
Company website presentation april 2017
AnteroResources
 
Howard weil conference presentation march 2017 v-f (small)
Howard weil conference presentation   march 2017 v-f (small)Howard weil conference presentation   march 2017 v-f (small)
Howard weil conference presentation march 2017 v-f (small)
AnteroResources
 
Company website presentation (b) march 2017
Company website presentation (b)   march 2017Company website presentation (b)   march 2017
Company website presentation (b) march 2017
AnteroResources
 
Company website presentation march 2017
Company website presentation   march 2017Company website presentation   march 2017
Company website presentation march 2017
AnteroResources
 
Credit suisse conference presentation february 2017 v-f
Credit suisse conference presentation   february 2017 v-fCredit suisse conference presentation   february 2017 v-f
Credit suisse conference presentation february 2017 v-f
AnteroResources
 
Company website presentation (c) february 2017
Company website presentation (c)   february 2017Company website presentation (c)   february 2017
Company website presentation (c) february 2017
AnteroResources
 
Company website presentation (b) february 2017
Company website presentation (b)   february 2017Company website presentation (b)   february 2017
Company website presentation (b) february 2017
AnteroResources
 
Company website presentation (a) february 2017
Company website presentation (a)   february 2017Company website presentation (a)   february 2017
Company website presentation (a) february 2017
AnteroResources
 
Company website presentation february 2017
Company website presentation   february 2017Company website presentation   february 2017
Company website presentation february 2017
AnteroResources
 
Goldman Sachs Global Energy Conference
Goldman Sachs Global Energy ConferenceGoldman Sachs Global Energy Conference
Goldman Sachs Global Energy Conference
AnteroResources
 
Company website presentation (a) december 2016
Company website presentation (a)   december 2016Company website presentation (a)   december 2016
Company website presentation (a) december 2016
AnteroResources
 
Company website presentation december 2016
Company website presentation   december 2016Company website presentation   december 2016
Company website presentation december 2016
AnteroResources
 
Company website presentation november 2016
Company website presentation   november 2016Company website presentation   november 2016
Company website presentation november 2016
AnteroResources
 
Company website presentation (b) october 2016
Company website presentation (b)   october 2016Company website presentation (b)   october 2016
Company website presentation (b) october 2016
AnteroResources
 
Company website presentation October 2016
Company website presentation October 2016Company website presentation October 2016
Company website presentation October 2016
AnteroResources
 
Company website presentation october 2016
Company website presentation   october 2016Company website presentation   october 2016
Company website presentation october 2016
AnteroResources
 
Company website presentation (b) september 2016
Company website presentation (b)   september 2016Company website presentation (b)   september 2016
Company website presentation (b) september 2016
AnteroResources
 
Company website presentation (a) september 2016
Company website presentation (a)   september 2016Company website presentation (a)   september 2016
Company website presentation (a) september 2016
AnteroResources
 
Company website presentation august 2016
Company website presentation   august 2016Company website presentation   august 2016
Company website presentation august 2016
AnteroResources
 
Company website presentation (a) july 2016
Company website presentation (a)   july 2016Company website presentation (a)   july 2016
Company website presentation (a) july 2016
AnteroResources
 

More from AnteroResources (20)

Company website presentation april 2017
Company website presentation   april 2017Company website presentation   april 2017
Company website presentation april 2017
 
Howard weil conference presentation march 2017 v-f (small)
Howard weil conference presentation   march 2017 v-f (small)Howard weil conference presentation   march 2017 v-f (small)
Howard weil conference presentation march 2017 v-f (small)
 
Company website presentation (b) march 2017
Company website presentation (b)   march 2017Company website presentation (b)   march 2017
Company website presentation (b) march 2017
 
Company website presentation march 2017
Company website presentation   march 2017Company website presentation   march 2017
Company website presentation march 2017
 
Credit suisse conference presentation february 2017 v-f
Credit suisse conference presentation   february 2017 v-fCredit suisse conference presentation   february 2017 v-f
Credit suisse conference presentation february 2017 v-f
 
Company website presentation (c) february 2017
Company website presentation (c)   february 2017Company website presentation (c)   february 2017
Company website presentation (c) february 2017
 
Company website presentation (b) february 2017
Company website presentation (b)   february 2017Company website presentation (b)   february 2017
Company website presentation (b) february 2017
 
Company website presentation (a) february 2017
Company website presentation (a)   february 2017Company website presentation (a)   february 2017
Company website presentation (a) february 2017
 
Company website presentation february 2017
Company website presentation   february 2017Company website presentation   february 2017
Company website presentation february 2017
 
Goldman Sachs Global Energy Conference
Goldman Sachs Global Energy ConferenceGoldman Sachs Global Energy Conference
Goldman Sachs Global Energy Conference
 
Company website presentation (a) december 2016
Company website presentation (a)   december 2016Company website presentation (a)   december 2016
Company website presentation (a) december 2016
 
Company website presentation december 2016
Company website presentation   december 2016Company website presentation   december 2016
Company website presentation december 2016
 
Company website presentation november 2016
Company website presentation   november 2016Company website presentation   november 2016
Company website presentation november 2016
 
Company website presentation (b) october 2016
Company website presentation (b)   october 2016Company website presentation (b)   october 2016
Company website presentation (b) october 2016
 
Company website presentation October 2016
Company website presentation October 2016Company website presentation October 2016
Company website presentation October 2016
 
Company website presentation october 2016
Company website presentation   october 2016Company website presentation   october 2016
Company website presentation october 2016
 
Company website presentation (b) september 2016
Company website presentation (b)   september 2016Company website presentation (b)   september 2016
Company website presentation (b) september 2016
 
Company website presentation (a) september 2016
Company website presentation (a)   september 2016Company website presentation (a)   september 2016
Company website presentation (a) september 2016
 
Company website presentation august 2016
Company website presentation   august 2016Company website presentation   august 2016
Company website presentation august 2016
 
Company website presentation (a) july 2016
Company website presentation (a)   july 2016Company website presentation (a)   july 2016
Company website presentation (a) july 2016
 

Recently uploaded

Affordable Stationery Printing Services in Jaipur | Navpack n Print
Affordable Stationery Printing Services in Jaipur | Navpack n PrintAffordable Stationery Printing Services in Jaipur | Navpack n Print
Affordable Stationery Printing Services in Jaipur | Navpack n Print
Navpack & Print
 
RMD24 | Debunking the non-endemic revenue myth Marvin Vacquier Droop | First ...
RMD24 | Debunking the non-endemic revenue myth Marvin Vacquier Droop | First ...RMD24 | Debunking the non-endemic revenue myth Marvin Vacquier Droop | First ...
RMD24 | Debunking the non-endemic revenue myth Marvin Vacquier Droop | First ...
BBPMedia1
 
April 2024 Nostalgia Products Newsletter
April 2024 Nostalgia Products NewsletterApril 2024 Nostalgia Products Newsletter
April 2024 Nostalgia Products Newsletter
NathanBaughman3
 
falcon-invoice-discounting-a-premier-platform-for-investors-in-india
falcon-invoice-discounting-a-premier-platform-for-investors-in-indiafalcon-invoice-discounting-a-premier-platform-for-investors-in-india
falcon-invoice-discounting-a-premier-platform-for-investors-in-india
Falcon Invoice Discounting
 
India Orthopedic Devices Market: Unlocking Growth Secrets, Trends and Develop...
India Orthopedic Devices Market: Unlocking Growth Secrets, Trends and Develop...India Orthopedic Devices Market: Unlocking Growth Secrets, Trends and Develop...
India Orthopedic Devices Market: Unlocking Growth Secrets, Trends and Develop...
Kumar Satyam
 
Skye Residences | Extended Stay Residences Near Toronto Airport
Skye Residences | Extended Stay Residences Near Toronto AirportSkye Residences | Extended Stay Residences Near Toronto Airport
Skye Residences | Extended Stay Residences Near Toronto Airport
marketingjdass
 
Attending a job Interview for B1 and B2 Englsih learners
Attending a job Interview for B1 and B2 Englsih learnersAttending a job Interview for B1 and B2 Englsih learners
Attending a job Interview for B1 and B2 Englsih learners
Erika906060
 
Improving profitability for small business
Improving profitability for small businessImproving profitability for small business
Improving profitability for small business
Ben Wann
 
Project File Report BBA 6th semester.pdf
Project File Report BBA 6th semester.pdfProject File Report BBA 6th semester.pdf
Project File Report BBA 6th semester.pdf
RajPriye
 
Meas_Dylan_DMBS_PB1_2024-05XX_Revised.pdf
Meas_Dylan_DMBS_PB1_2024-05XX_Revised.pdfMeas_Dylan_DMBS_PB1_2024-05XX_Revised.pdf
Meas_Dylan_DMBS_PB1_2024-05XX_Revised.pdf
dylandmeas
 
Pitch Deck Teardown: RAW Dating App's $3M Angel deck
Pitch Deck Teardown: RAW Dating App's $3M Angel deckPitch Deck Teardown: RAW Dating App's $3M Angel deck
Pitch Deck Teardown: RAW Dating App's $3M Angel deck
HajeJanKamps
 
Lookback Analysis
Lookback AnalysisLookback Analysis
Lookback Analysis
Safe PaaS
 
Business Valuation Principles for Entrepreneurs
Business Valuation Principles for EntrepreneursBusiness Valuation Principles for Entrepreneurs
Business Valuation Principles for Entrepreneurs
Ben Wann
 
The-McKinsey-7S-Framework. strategic management
The-McKinsey-7S-Framework. strategic managementThe-McKinsey-7S-Framework. strategic management
The-McKinsey-7S-Framework. strategic management
Bojamma2
 
Buy Verified PayPal Account | Buy Google 5 Star Reviews
Buy Verified PayPal Account | Buy Google 5 Star ReviewsBuy Verified PayPal Account | Buy Google 5 Star Reviews
Buy Verified PayPal Account | Buy Google 5 Star Reviews
usawebmarket
 
5 Things You Need To Know Before Hiring a Videographer
5 Things You Need To Know Before Hiring a Videographer5 Things You Need To Know Before Hiring a Videographer
5 Things You Need To Know Before Hiring a Videographer
ofm712785
 
Unveiling the Secrets How Does Generative AI Work.pdf
Unveiling the Secrets How Does Generative AI Work.pdfUnveiling the Secrets How Does Generative AI Work.pdf
Unveiling the Secrets How Does Generative AI Work.pdf
Sam H
 
Accpac to QuickBooks Conversion Navigating the Transition with Online Account...
Accpac to QuickBooks Conversion Navigating the Transition with Online Account...Accpac to QuickBooks Conversion Navigating the Transition with Online Account...
Accpac to QuickBooks Conversion Navigating the Transition with Online Account...
PaulBryant58
 
RMD24 | Retail media: hoe zet je dit in als je geen AH of Unilever bent? Heid...
RMD24 | Retail media: hoe zet je dit in als je geen AH of Unilever bent? Heid...RMD24 | Retail media: hoe zet je dit in als je geen AH of Unilever bent? Heid...
RMD24 | Retail media: hoe zet je dit in als je geen AH of Unilever bent? Heid...
BBPMedia1
 
Filing Your Delaware Franchise Tax A Detailed Guide
Filing Your Delaware Franchise Tax A Detailed GuideFiling Your Delaware Franchise Tax A Detailed Guide
Filing Your Delaware Franchise Tax A Detailed Guide
YourLegal Accounting
 

Recently uploaded (20)

Affordable Stationery Printing Services in Jaipur | Navpack n Print
Affordable Stationery Printing Services in Jaipur | Navpack n PrintAffordable Stationery Printing Services in Jaipur | Navpack n Print
Affordable Stationery Printing Services in Jaipur | Navpack n Print
 
RMD24 | Debunking the non-endemic revenue myth Marvin Vacquier Droop | First ...
RMD24 | Debunking the non-endemic revenue myth Marvin Vacquier Droop | First ...RMD24 | Debunking the non-endemic revenue myth Marvin Vacquier Droop | First ...
RMD24 | Debunking the non-endemic revenue myth Marvin Vacquier Droop | First ...
 
April 2024 Nostalgia Products Newsletter
April 2024 Nostalgia Products NewsletterApril 2024 Nostalgia Products Newsletter
April 2024 Nostalgia Products Newsletter
 
falcon-invoice-discounting-a-premier-platform-for-investors-in-india
falcon-invoice-discounting-a-premier-platform-for-investors-in-indiafalcon-invoice-discounting-a-premier-platform-for-investors-in-india
falcon-invoice-discounting-a-premier-platform-for-investors-in-india
 
India Orthopedic Devices Market: Unlocking Growth Secrets, Trends and Develop...
India Orthopedic Devices Market: Unlocking Growth Secrets, Trends and Develop...India Orthopedic Devices Market: Unlocking Growth Secrets, Trends and Develop...
India Orthopedic Devices Market: Unlocking Growth Secrets, Trends and Develop...
 
Skye Residences | Extended Stay Residences Near Toronto Airport
Skye Residences | Extended Stay Residences Near Toronto AirportSkye Residences | Extended Stay Residences Near Toronto Airport
Skye Residences | Extended Stay Residences Near Toronto Airport
 
Attending a job Interview for B1 and B2 Englsih learners
Attending a job Interview for B1 and B2 Englsih learnersAttending a job Interview for B1 and B2 Englsih learners
Attending a job Interview for B1 and B2 Englsih learners
 
Improving profitability for small business
Improving profitability for small businessImproving profitability for small business
Improving profitability for small business
 
Project File Report BBA 6th semester.pdf
Project File Report BBA 6th semester.pdfProject File Report BBA 6th semester.pdf
Project File Report BBA 6th semester.pdf
 
Meas_Dylan_DMBS_PB1_2024-05XX_Revised.pdf
Meas_Dylan_DMBS_PB1_2024-05XX_Revised.pdfMeas_Dylan_DMBS_PB1_2024-05XX_Revised.pdf
Meas_Dylan_DMBS_PB1_2024-05XX_Revised.pdf
 
Pitch Deck Teardown: RAW Dating App's $3M Angel deck
Pitch Deck Teardown: RAW Dating App's $3M Angel deckPitch Deck Teardown: RAW Dating App's $3M Angel deck
Pitch Deck Teardown: RAW Dating App's $3M Angel deck
 
Lookback Analysis
Lookback AnalysisLookback Analysis
Lookback Analysis
 
Business Valuation Principles for Entrepreneurs
Business Valuation Principles for EntrepreneursBusiness Valuation Principles for Entrepreneurs
Business Valuation Principles for Entrepreneurs
 
The-McKinsey-7S-Framework. strategic management
The-McKinsey-7S-Framework. strategic managementThe-McKinsey-7S-Framework. strategic management
The-McKinsey-7S-Framework. strategic management
 
Buy Verified PayPal Account | Buy Google 5 Star Reviews
Buy Verified PayPal Account | Buy Google 5 Star ReviewsBuy Verified PayPal Account | Buy Google 5 Star Reviews
Buy Verified PayPal Account | Buy Google 5 Star Reviews
 
5 Things You Need To Know Before Hiring a Videographer
5 Things You Need To Know Before Hiring a Videographer5 Things You Need To Know Before Hiring a Videographer
5 Things You Need To Know Before Hiring a Videographer
 
Unveiling the Secrets How Does Generative AI Work.pdf
Unveiling the Secrets How Does Generative AI Work.pdfUnveiling the Secrets How Does Generative AI Work.pdf
Unveiling the Secrets How Does Generative AI Work.pdf
 
Accpac to QuickBooks Conversion Navigating the Transition with Online Account...
Accpac to QuickBooks Conversion Navigating the Transition with Online Account...Accpac to QuickBooks Conversion Navigating the Transition with Online Account...
Accpac to QuickBooks Conversion Navigating the Transition with Online Account...
 
RMD24 | Retail media: hoe zet je dit in als je geen AH of Unilever bent? Heid...
RMD24 | Retail media: hoe zet je dit in als je geen AH of Unilever bent? Heid...RMD24 | Retail media: hoe zet je dit in als je geen AH of Unilever bent? Heid...
RMD24 | Retail media: hoe zet je dit in als je geen AH of Unilever bent? Heid...
 
Filing Your Delaware Franchise Tax A Detailed Guide
Filing Your Delaware Franchise Tax A Detailed GuideFiling Your Delaware Franchise Tax A Detailed Guide
Filing Your Delaware Franchise Tax A Detailed Guide
 

Company website presentation (a) december 2014

  • 2. FORWARD-LOOKING STATEMENTS This presentation contains forward-looking statements within the meaning of Section 27A of the Securities Act of 1933 and Section 21E of the Securities Exchange Act of 1934. All statements, other than statements of historical facts, included in this presentation that address activities, events or developments that Antero Resources Corporation and its subsidiaries (collectively, the “Company” or “Antero”) expects, believes or anticipates will or may occur in the future are forward-looking statements. The words “believe,” “expect,” “anticipate,” “plan,” “intend,” “estimate,” “project,” “foresee,” “should,” “would,” “could,” or other similar expressions are intended to identify forward-looking statements. However, the absence of these words does not mean that the statements are not forward-looking. Without limiting the generality of the foregoing, forward- looking statements contained in this presentation specifically include estimates of the Company’s reserves, expectations of plans, strategies, objectives and anticipated financial and operating results of the Company, including as to the Company’s drilling program, production, hedging activities, capital expenditure levels and other guidance included in this presentation. These statements are based on certain assumptions made by the Company based on management’s experience and perception of historical trends, current conditions, anticipated future developments and other factors believed to be appropriate. Such statements are subject to a number of assumptions, risks and uncertainties, many of which are beyond the control of the Company, which may cause actual results to differ materially from those implied or expressed by the forward-looking statements. These include the factors discussed or referenced under the heading “Item 1A. Risk Factors” in our Annual Report on Form 10-K for the year ended December 31, 2013 and in the Company’s subsequent filings with the SEC. The Company cautions you that these forward-looking statements are subject to all of the risks and uncertainties, most of which are difficult to predict and many of which are beyond our control, incident to the exploration for and development, production, gathering and sale of natural gas and oil. These risks include, but are not limited to, commodity price volatility, inflation, lack of availability of drilling and production equipment and services, environmental risks, drilling and other operating risks, regulatory changes, the uncertainty inherent in estimating natural gas and oil reserves and in projecting future rates of production, cash flow and access to capital, the timing of development expenditures, and the other risks described under the heading “Risk Factors” in our Annual Report on Form 10-K for the year ended December 31, 2013 and in the Company’s subsequent filings with the SEC. Any forward-looking statement speaks only as of the date on which such statement is made and the Company undertakes no obligation to correct or update any forward-looking statement, whether as a result of new information, future events or otherwise, except as required by applicable law. 1
  • 3. 2 CHANGES SINCE NOVEMBER 2014 PRESENTATION New and updated overview slides highlighting Antero’s integrated business model Updated single well economic returns for Marcellus and Utica at 11/28/2014 strip prices Slides 16, 19, 21, 38, 39 Substantial value in Antero Midstream Partners (NYSE: AM) Updated “Road Map” for natural gas realizations based on 11/28/2014 strip prices Expanded natural gas hedge portfolio with mark-to- market value at 11/28/2014 Slides 3 – 14 Slide 10 Slide 12 Slide 14 Updated firm transportation map for 330 MMcf/d of firm sales for LNG through Cove Point to GAIL (India) Slide 11
  • 4. 3 Most Active Operator in Appalachia Most Active Land Organization in Appalachia Largest Firm Transport and Processing Portfolio in Appalachia Largest Gas Hedge Position in U.S. E&P + Strong Financial Liquidity Highest Growth Large Cap E&P Largest Liquids-Rich Core Position in Appalachia Highest Realizations and Margins Among Large Cap Appalachian Peers Growth Land Liquidity Midstream Drilling LEADING UNCONVENTIONAL BUSINESS MODEL MLP (NYSE: AM) Highlights Substantial Value in Midstream Business Realizations Takeaway Liquids-Rich 1 2 3 4 5 67 8 Premier Appalachian E&P Company Run by Co-Founders
  • 5. Downstream LNG and NGL Sales Production and Cash Flow Growth 4 Antero has approximately 200,000 net acres of Utica dry gas adjacent to current industry activity with highly encouraging initial results CATALYSTS 45-50% production growth targeted for both 2015 and 2016 with 78% hedged at $4.38/MMBtu and 43% hedged at $4.46/MMBtu, respectively Substantial low cost core Marcellus and Utica natural gas drilling inventory with associated liquids generates attractive returns supported by long-term natural gas hedges, takeaway portfolio and downstream LNG and NGL sales agreements Pursuing additional value enhancing long-term LNG and NGL sales agreements, supported by firm takeaway Antero owns 70% of Antero Midstream Partners and thereby participates directly in its growth and value creation Midstream MLP Growth Sustainability of Antero’s Integrated Business Model Utica Dry Gas Activity Potential Water System Monetization 1 2 3 4 5 6 Contingent on receiving private letter ruling from the IRS, AM holds an option to acquire Antero’s fresh water system at fair market value
  • 6. DRILLING – MOST ACTIVE OPERATOR IN APPALACHIA 1. All net acres allocated to the WV/PA Utica Shale Dry Gas and Upper Devonian Shale are included among the net acres allocated to the Marcellus Shale as they are stacked pay formations attributable to the same leasehold. 2. Locations as of 9/30/2014 adjusted for additional 130 locations acquired through 11/3/2014. 3. Antero and industry rig locations and rig count as of 11/28/2014 per RigData. 5 COMBINED TOTAL – 6/30/14 RESERVES Assumes Ethane Rejection Net Proved Reserves 9.1 Tcfe Net 3P Reserves 37.5 Tcfe Pre-Tax 3P PV-10 $25.9 Bn Net 3P Reserves & Resource 47.0 Tcfe Net 3P Liquids 966 MMBbls % Liquids – Net 3P 15% 3Q 2014 Net Production 1,080 MMcfe/d - 3Q 2014 Net Liquids 25,000 Bbl/d Net Acres(1) 524,000 Undrilled 3P Locations(2) 5,244 UTICA SHALE CORE Net Proved Reserves 537 Bcfe Net 3P Reserves 6.4 Tcfe Pre-Tax 3P PV-10 $6.5 Bn Net Acres 135,000 Undrilled 3P Locations(2) 997 MARCELLUS SHALE CORE Net Proved Reserves 8.5 Tcfe Net 3P Reserves 26.4 Tcfe Pre-Tax 3P PV-10 $19.4 Bn Net Acres 389,000 Undrilled 3P Locations 3,131 UPPER DEVONIAN SHALE Net Proved Reserves 40 Bcfe Net 3P Reserves 4.6 Tcfe Pre-Tax 3P PV-10 NM Undrilled 3P Locations 1,116 WV/PA UTICA SHALE DRY GAS Net Resource 9.5 Tcf Net Acres 167,000 Undrilled Locations 1,390 0 5 10 15 20 25 RigCount Operators SW Marcellus + Utica Rigs(3)
  • 7. 47.5% 30.0% 26.8% 25.7% 25.4% 25.0% 24.9% 22.0% 19.5% 17.2% 10.0% 8.4% 8.4% 7.9% 6.1% 2.9% 1.8% 0% 10% 20% 30% 40% 50% (2.8%) Source: Represents median of Wall Street research estimates for 2015E production growth rates (vs. 2014 estimated production). (1) Includes all North American E&P companies with a market capitalization greater than $10.0 billion. (2) Based on midpoint of publicly announced 2015 production growth target range of 45% - 50%. 6  Antero’s 45%-50% production growth target for 2015 leads the U.S. large cap E&P industry(1) (2) GROWTH – HIGHEST GROWTH LARGE CAP E&P Appalachian Peers
  • 8. 1. 2012, 2013 and 6/30/2014 proved reserves assuming ethane rejection. 2. Midpoint of production guidance of 990-1,010 MMcfe/d for 2014. 3. Based on 45-50% production growth targets for 2015 and 2016. 4. Per current First Call median estimate from Bloomberg. 0 600 1,200 1,800 2,400 2010 2011 2012 2013 1H 2014 3Q 2014 4Q 2014 2015E 2016E Marcellus Utica Guidance 30 124 239 522 (2) 1,237 838 1,500 2,200 (3) (3) 1,080 0 2,000 4,000 6,000 8,000 10,000 2010 2011 2012 2013 6/30/2014 Marcellus Utica 677 2,844 4,283 7,632 (1) (1) (1) 9,107 7 AVERAGE NET DAILY PRODUCTION (MMcfe/d)NET PROVED SEC RESERVES (Bcfe) 0 25 50 75 100 125 150 175 200 225 2010 2011 2012 2013 2014E Marcellus Utica 29 36 86 162 215 GROWTH – STRONG TRACK RECORD OPERATED GROSS WELLS SPUD EBITDAX ($MM) $0 $200 $400 $600 $800 $1,000 $1,200 $1,400 2010 2011 2012 2013 2014E $28 $160 $285 $649 $1,145 (4) 45-50% Annual Growth Target 92% Growth – Guidance of 1,000 MMcfe/d for 2014E
  • 9.  Assembled a 524,000 net acre position in the core of the Marcellus and Utica shale plays over the past 6 years December 2008 Net Acreage 118,000 Net Production (MMcfe/d) NM 3P Reserves (Bcfe) NM 3P PV-10 ($MM) NM Rigs Running NM Dec 2008 Dec 2011 Dec 2014 December 2011(1) Net Acreage 214,000 Net Production (MMcfe/d) 167 3P Reserves (Bcfe) 18,400 3P PV-10 ($MM) $9,000 Rigs Running 5 December 2014(1) Net Acreage 524,000 Net Production (MMcfe/d) 1,080 6/30/14 3P Reserves (Bcfe) 37,500 6/30/14 3P PV-10 ($MM) $25,900 Rigs Running 21 1. Reserves and PV-10 data for December 2014 reflect data as of 6/30/2014 and for December 2011 reflects data as of 12/31/2011. Daily net production for December 2011 and December 2014 is for third quarter respectively. LAND – MOST ACTIVE LAND ORGANIZATION IN APPALACHIA 8 118,000 118,000 118,000 162,000 189,000 213,000 285,000 371,000 420,000 450,000 486,000 524,000 0 100,000 200,000 300,000 400,000 500,000 600,000 12/2008 12/2009 6/2010 12/2010 6/2011 12/2011 6/2012 12/2012 6/2013 12/2013 6/2014 12/2014 Antero Net Acreage Utica Marcellus
  • 10. 9 LIQUIDS-RICH – LARGEST CORE POSITION Source: Core outlines and peer net acreage positions based on peer presentations, news releases and 10-K/10-Qs. 1. Pending Southwestern Energy acquisition of Chesapeake southern Marcellus acreage position. (1)  Antero has the largest liquids-rich core position in Appalachia ≈366,000 net acres
  • 11. MIDSTREAM –MLP (NYSE: AM) HIGHLIGHTS SUBSTANTIAL VALUE IN MIDSTREAM BUSINESS 1. See page 34 for pro forma assumptions. Values as of 12/2/2014. 2. Based on First Call 9/30/2015 NTM EBITDA forecast of $142 million for Water Business included in preliminary AM S-1 and applying AR enterprise value to EBITDAX multiple derived from First Call AR 9/30/2015 NTM EBITDAX estimates. 3. Represents difference between AR enterprise value and Antero Midstream net market value and Water System enterprise value. 4. Based on 262.0 million AR shares outstanding. 10 Antero Resources Corporation (NYSE: AR) $15.2 Billion Enterprise Value(1) Ba3/BB Corporate Rating Antero Midstream Partners LP (NYSE: AM) $4.3 Billion Valuation(1) 70% Limited Partner Interest E&P Assets Gathering Assets Corporate Structure Overview(1) Market Valuation of AR Ownership in AM: • AR ownership: 69.7% LP Interest = 105.9 million units AM Price per Unit AM Units Owned by AR (MM) AR Value in AM LP Units ($MMs) Value Per AR Share(4) $25 106 $2,647 $10 $26 106 $2,753 $11 $27 106 $2,858 $11 $28 106 $2,964 $12 $29 106 $3,070 $12 $30 106 $3,176 $12 $31 106 $3,282 $13 Fresh Water Distribution System Compression Assets $3.0 Billion Market Valuation(1) $10.7 Billion Implied Valuation(3) $1.5 Billion Derived Valuation(2)
  • 12. TAKEAWAY – LARGEST FIRM TRANSPORTATION AND PROCESSING PORTFOLIO IN APPALACHIA Odebrecht / Braskem 30 MBbl/d Commitment Ascent Cracker (Pending Final Investment Decision) Antero Long Term Firm Processing & Takeaway Position (2018) – Accessing Favorable Markets Mariner East II 62 MBbl/d Commitment(2) Marcus Hook Export Shell 25 MBbl/d Commitment Beaver County Cracker (Pending Final Investment Decision) Sabine Pass (Trains 1-4) 50 MMcf/d per Train 1. 2015 and 2016 futures basis, respectively, provided by Wells Fargo dated 11/28/2014. Favorable gas markets shaded in green. 2. As an anchor shipper on Mariner East II, Antero has the right to expand its NGL commitment with notice to operator. Chicago(1) +$0.18 / $(0.04) CGTLA(1) $(0.10) / $(0.09) Dom South(1) $(1.32) / $(1.16) TCO(1) $(0.29) / $(0.47) 11 4 Bcf/d Firm Gas Takeaway By 2018 Cove Point
  • 13. 788 1,168 943 780 1,073 818 $4.97 $4.38 $4.46 $4.34 $4.50 $4.41 $4.07 $3.82 $3.83 $3.96 $4.09 $4.21 $0.00 $1.00 $2.00 $3.00 $4.00 $5.00 $6.00 $7.00 0 200 400 600 800 1,000 1,200 4Q 2014 2015 2016 2017 2018 2019 BBtu/d $/MMBtu 12 Average Index Hedge Price(1)Hedged Volume Current NYMEX Strip(2) COMMODITY HEDGE POSITION 1. Reflects weighted average index price per annum based on volumes hedged and 6:1 gas to oil ratio. Antero has hedged 3,000 Bbl/d of oil for 2014 and 2,000 Bbl/d of propane for 2015. 2. As of 11/28/2014. 3. Percentage of net gas equivalent production target hedged for respective years.  ~$1,109 million mark-to-market unrealized gain based on current prices  1.8 Tcfe hedged from October 1, 2014 through year-end 2019 and 256 Bcf of TCO basis hedges from 2015 to 2017 $72 MM $345 MM $349 MM $123 MM $160 MM $60 MM Mark-to-Market Value(2) LIQUIDITY – LARGEST GAS HEDGE POSITION IN U.S. E&P + STRONG FINANCIAL LIQUIDITY $3,000 $2,012 ($1,505) ($332) $6 $843 $0 $500 $1,000 $1,500 $2,000 $2,500 $3,000 Credit Facility 9/30/2014 Bank Debt 9/30/2014 L/Cs Outstanding 9/30/2014 Cash 9/30/2014 AM IPO Proceeds to AR Pro Forma Liquidity 9/30/2014 AR LIQUIDITY POSITION ($MM) AM LIQUIDITY POSITION ($MM) $1,000 $1,250 $0 $0 $0 $250 $0 $500 $1,000 $1,500 $2,000 $2,500 $3,000 Credit Facility 9/30/2014 Bank Debt 9/30/2014 L/Cs Outstanding 9/30/2014 Cash 9/30/2014 AM IPO Proceeds to AM Pro Forma Liquidity 9/30/2014 ≈ 78% of 2015E Target Production(3) ≈ 43% of 2015E Target Production(3)  Over $3 billion of combined AR and AM financial liquidity as of 9/30/2014, pro forma for AM IPO closed on 11/10/2014
  • 14. 1. Gulf Coast differential represents contractual deduct to NYMEX-based sales. 2. Includes firm sales. 3. Includes natural gas hedges. 4. Source: Public data from 3Q 2014 10-Qs. Peers include Cabot Oil & Gas, CONSOL Energy, EQT Corp. and Range Resources. 5. Includes realized hedge gains and losses. Operating costs include lease operating expenses, production taxes, gathering, processing and firm transport costs and general and administrative costs. 4-year proved reserve average all-in F&D from 2010-2013. Calculation = (Development costs + exploration costs + leasehold costs) / Total reserves added (2013 ending reserves – 2010 beginning reserves + 4-year reserve sales – 4-year reserve purchases + 4-year accumulated production). AR price realization includes $0.04 of midstream revenues. $4.16 $3.97 $0.58 $0.95 $0.74 $0.77 $0.81 $0.00 $1.00 $2.00 $3.00 $4.00 $5.00 $6.00 Antero Peer 1 Peer 2 Peer 3 Peer 4 $/Mcfe LOE Production Taxes GPT G&A EBITDAX 4-year Avg. All-in F&D ($/Mcfe) $4.96 $3.25 $4.48 $2.93 $2.40 $2.64 $2.11 $2.09 13 Region 3Q 2014 % Sales Average NYMEX Price Average Differential(2) Average BTU Upgrade Hedge Effect Average 3Q 2014 Realized Gas Price(3) Average Premium/ Discount TCO 39% $4.06 $(0.12) $0.48 $0.58 $5.00 $0.94 Dom South/TETCO 41% $4.06 $(1.83) $0.32 $1.10 $3.65 $(0.41) Gulf Coast(1) 10% $4.06 $(0.25) $0.39 $0.01 $4.21 $0.15 Chicago 10% $4.06 $(0.07) $0.52 - $4.51 $0.45 Total Wtd. Avg. 100% $4.06 $(0.84) $0.41 $0.68 $4.31 $0.25 REALIZATIONS – HIGHEST REALIZATIONS & MARGINS AMONG LARGE-CAP APPALACHIAN PEERS 3Q 2014 Natural Gas Realizations ($/Mcf) 3Q 2014 Natural Gas Realizations(3) 3Q 2014 Price Realization & EBITDAX Margin vs F&D(4) $4.31 $4.12 $3.66 $3.62 $3.60 $2.98 $2.87 $2.75 $0.00 $2.00 $4.00 $6.00 AR EQT GPOR RRC CNX RICE ECR COG $/Mcf 3Q 2014 NYMEX = $4.06/Mcf AR Peer 1 Peer 2 Peer 3 Peer 4
  • 15. DOM S 28% DOM S 22% DOM S 8% TETCO M2 4% TETCO M2 8% TETCO M2 10% TCO 43% TCO 23% TCO 15% NYMEX 9% NYMEX 7% NYMEX 10% Gulf Coast 18% Gulf Coast 47% Chicago 16% Chicago 22% Chicago 10% 0% 10% 20% 30% 40% 50% 60% 70% 80% 90% 100% ($/Mcf) 4Q 2014E 2015E 2016E NYMEX Strip Price(1) $4.00 $3.82 $3.83 Basis Differential to NYMEX(1) $(0.52) $(0.45) $(0.35) BTU Upgrade(5) $0.35 $0.34 $0.35 Estimated Realized Hedge Gains $0.67 $0.63 $0.45 Realized Gas Price with Hedges $4.50 $4.34 $4.28 Premium to NYMEX +$0.50 +$0.52 +$0.45 Liquids Impact(6) +$0.54 +$0.50 +$0.58 Premium to NYMEX w/ Liquids +$1.04 +$1.02 +$1.03 Realized Gas-Equivalent Price $5.04 $4.84 $4.86 4. Represents 60,000 MMBtu/d of TCO index hedges and 205,000 MMBtu/d of TCO basis hedges that are matched with NYMEX hedges for presentation purposes. 5. Assumes ethane rejection resulting in 1100 BTU residue sales gas. 6. Represents equivalent price upgrade associated with NGL (C3+) and oil production. REALIZATIONS – REALIZED PRICE “ROAD MAP” 1. Based on 11/28/2014 strip pricing. 2. Differential represents contractual deduct to NYMEX-based firm sales contract. 3. Represents 120,000 MMBtu/d of TCO index hedges and 390,000 MMBtu/d of TCO basis hedges that are matched with NYMEX hedges for presentation purposes. 4Q 2014 Basis(1) 2015 Basis(1) 2016 Basis(1) 4Q 2014 Hedges 2015 Hedges 2016 Hedges Marketed%ofTargetResidueGasProduction +$0.33/MMBtu $(0.25)/MMBtu(2) $(1.63)/MMBtu $(0.07)/MMBtu +$0.18/MMBtu $(0.25)/MMBtu(2) $(1.32)/MMBtu $(0.29)/MMBtu $(0.04)/MMBtu $(0.25)/MMBtu(2) $(1.16)/MMBtu $(0.46)/MMBtu $(0.10)/MMBtu $(0.09)/MMBtu 340,000 MMBtu/d @ $4.18/MMBtu 160,000 MMBtu/d @ $5.27/MMBtu 210,000 MMBtu/d @ $5.24/MMBtu 40,000 MMBtu/d @ $4.00/MMBtu 230,000 MMBtu/d @ $5.60/MMBtu 510,000 MMBtu/d @ $3.87/MMBtu(3) 170,000 MMBtu/d @ $4.09/MMBtu 272,500 MMBtu/d @ $5.35/MMBtu 265,000 MMBtu/d @ $3.89/MMBtu(4) $0.56/Mcfe in estimated hedge gains(1) 70% exposure to favorable price indices $0.67/Mcfe in estimated hedge gains(1) 68% exposure to favorable price indices $0.43/Mcfe in estimated hedge gains(1) 82% exposure to favorable price indices  Antero is forecasting realized gas prices including hedges at a premium to NYMEX strip prices for Q4 2014 through 2016, assuming current strip prices and basis, existing firm transportation and hedges, and targeted 2015 and 2016 production figures $(1.57)/MMBtu $(1.18)/MMBtu $(1.05)/MMBtu Wtd. Avg. Basis ($0.52) 770,000 MMBtu/d @ $4.97/MMBtu Wtd. Avg. Basis $(0.45) 1,160,000 MMBtu/d @ $4.34/MMBtu Wtd. Avg. Basis $(0.35) 942,500 MMBtu/d @ $4.46/MMBtu 10,000 MMBtu/d @ $3.98/MMBtu 4Q 2014E 2015E 2016E 14 380,000 MMBtu/d @ $3.88/MMBtu 235,000 MMBtu/d @ $4.00/MMBtu 50,000 MMBtu/d @ $4.72/MMBtu
  • 17. 0% 20% 40% 60% 80% 248 143 87 265 254 14% 57% 76% 50% 45% 0 50 100 150 200 250 300 0% 25% 50% 75% 100% Condensate Highly-Rich Gas/ Condensate Highly-Rich Gas Rich Gas Dry Gas Total3PLocations ROR Locations ROR MARCELLUS SSL WELL ECONOMICS(1) 727 896 633 875 55% 37% 17% 16% 0 200 400 600 800 1000 0% 25% 50% 75% 100% Highly-Rich Gas/ Condensate Highly-Rich Gas Rich Gas Dry Gas Total3PLlocations ROR Locations ROR MULTI-YEAR DRILLING INVENTORY SUPPORTS LOW RISK, HIGH RETURN GROWTH PROFILE Large 3P Drilling Inventory of High Return Projects(3) 1. Pre-tax well economics based on 11/28/2014 natural gas and WTI strip pricing for 2014-2019, flat thereafter, NGLs at 55% of oil price and applicable firm transportation costs. 2. Adjusted for additional 130 gross locations acquired as of 11/3/2014. 3. Source: Credit Suisse report dated October 2014 – After-tax internal rate of return based on 10/27/2014 strip pricing. 59% 57% 71% 21% InternalRateofReturn(%) 37% 16 UTICA WELL ECONOMICS(1)(2) 1,000  72% of Marcellus locations are processable (1100-plus Btu)  75% of Utica locations are processable (1100-plus Btu) 3,000 Antero Liquids-Rich Locations 37% 2H 2014 / 2015 Drilling Plan 1,129 Antero Dry Gas Locations
  • 18. WORLD CLASS MARCELLUS SHALE DEVELOPMENT PROJECT 100% operated Operating 14 drilling rigs including 5 intermediate rigs 389,000 net acres in Southwestern Core (73% includes processable rich gas assuming an 1100 Btu cutoff) – 50% HBP with additional 27% not expiring for 5+ years 339 horizontal wells completed and online – Laterals average 7,400’ – 100% drilling success rate 5 plants in-service at Sherwood Processing Complex capable of processing 1 Bcf/d of rich gas − Over 800 MMcf/d being processed currently Net production of 937 MMcfe/d in 3Q 2014, including 17,300 Bbl/d of liquids 3,131 future drilling locations in the Marcellus (2,256 or 72% are processable rich gas) 26.4 Tcfe of net 3P (18% liquids), includes 8.5 Tcfe of proved reserves (assuming ethane rejection) Highly-Rich Gas 119,000 Net Acres 896 Gross Locations Rich Gas 91,000 Net Acres 633 Gross Locations Dry Gas 104,000 Net Acres 875 Gross Locations Highly-Rich/Condensate 75,000 Net Acres 727 Gross Locations HEFLIN UNIT 30-Day Rate 2H: 21.4 MMcfe/d (21% liquids) CONSTABLE UNIT 30-Day Rate 1H: 14.3 MMcfe/d (26% liquids) 142 Horizontals Completed 30-Day Rate 8.1 MMcf/d 6,915’ average lateral length Sherwood Processing Complex Source: Company presentations and press releases. Antero acreage position reflects tax districts in which greater than 3,000 net acres are held. Note: Rates in ethane rejection. NERO UNIT 30-Day Rate 1H: 18.2 MMcfe/d (27% liquids) BEE LEWIS PAD 30-Day Rate 4-well combined 30-Day Rate of 67 MMcfe/d (26% liquids) RJ SMITH PAD 30-Day Rate 4-well combined 30-Day Rate of 56 MMcfe/d (21% liquids) 17 MHR COLLINS UNIT 30-Day Rate 4-well average 9.3 MMcfe/d (26% liquids) HENDERSHOT UNIT 30-Day Rate 1H: 16.3 MMcfe/d 2H: 18.1 MMcfe/d (29% liquids) HORNET UNIT 30-Day Rate 1H: 21.8 MMcfe/d (26% liquids) HINTERER UNIT 30-Day Rate 1H: 12.9 MMcfe/d (20% liquids)
  • 19. 0 5 10 15 20 MMc/fd Production from All Wells 2009 - 2014 0.0 3.0 6.0 9.0 12.0 15.0 0.0 3.0 6.0 9.0 12.0 15.0 0 1 2 3 4 5 6 7 8 9 10 CumulativeBcf MMcf/d Production Year Non-SSL Type Curve (1.5 Bcf/1,000') Non-SSL Actual Production Non-SSL Type Curve Cumulative Production SSL Type Curve (1.7 Bcf/1,000') SSL Actual Production SSL Type Curve Cumulative Production  Antero has five years of production history to support its Non-SSL type curve  Antero has over one year of production history to support its SSL type curve: 1.7 Bcf/1,000’ with only 10% to 15% higher well costs vs. Non-SSL  Lack of faulting and contiguous acreage position allows for drilling of long laterals ~ 7,400’ average since inception − Drives down cost per 1,000’ of lateral resulting in best in class development costs ANTERO’S MARCELLUS SHALE TYPE CURVE 1. 198 Antero Marcellus Non-SSL wells normalized to time zero, production for each well normalized to 7,000’ lateral length. 2. 141 Antero Marcellus SSL wells normalized to time zero, production for each well normalized to 7,000’ lateral length. Marcellus Type Curves – Normalized to 7,000’ Lateral (1) EURs Increase With Lateral Length Well Cost / 1,000’ Decreases with Lateral Length Wellhead 30-day Rates - 320 Wells 2009-2012 – 7.9 MMcf/d (2) 2013 – 8.4 MMcf/d 2014 YTD – 11.4 MMcf/d Actual Rates 24-Hour Peak Rate 30-Day Avg. Rate 90-Day Avg. Rate 180-Day Avg. Rate One-Year Avg. Rate Two-Year Avg. Rate Three-Year Avg. Rate Four-Year Avg. Rate Wellhead Gas (MMcf/d) 15.2 9.1 7.0 5.7 4.2 3.2 2.5 2.0 # of Antero Wells 339 320 313 268 222 113 60 20 18 0 5 10 15 20 25 2,000 4,000 6,000 8,000 10,000 EUR,BCF Lateral Length, ft $0.0 $0.5 $1.0 $1.5 $2.0 $2.5 $3.0 2,000 4,000 6,000 8,000 10,000 $MM/1,000' Lateral length, ft
  • 20. 0.0% 25.0% 50.0% 75.0% 100.0% 125.0% 150.0% $3.00 $3.50 $4.00 $4.50 $5.00 $5.50 $6.00 Pre-TaxROR(%) Highly-Rich Gas/Condensate Highly-Rich Gas Rich Gas Dry Gas MARCELLUS ROR% AND GAS PRICE SENSITIVITY 191. Assumes 11/28/2014 strip pricing, market differentials and relevant transportation cost.  Large portfolio of Highly-Rich Gas/Condensate to Dry Gas locations  Focused on drilling highly economic rich gas locations – rig symbols represent current rig location by Btu regime  Assumes 11/28/2014 WTI strip pricing for 2014-2019, flat thereafter; NGL price of 55% of WTI NYMEX Price Sensitivity(1) ROR% at 5-Year Strip Highly-Rich Gas/Condensate: 55% Highly-Rich Gas: 37% Rich Gas: 17% Dry Gas: 16% 727 Locations 896 Locations 633 Locations 875 Locations Antero Rigs Employed 2H 2014 / 2015 Drilling Plan
  • 21. Source: Company presentations and press releases. Note: Antero acreage position reflects townships in which greater than 3,000 net acres are held. Note: Third party peak rates assume ethane recovery; Antero 30-day rates in ethane rejection. 1. For non-Antero wells, Antero has converted rich gas rates where BTU has been disclosed to NGLs, assuming ethane recovery. Where BTU has not been disclosed, Antero has estimated BTU and gas composition. 2. 30-day rate reflects restricted choke regime.  100% operated  Operating 7 rigs including 2 intermediate rigs  135,000 net acres in the core rich gas/ condensate window (76% includes processable rich gas assuming an 1100 Btu cutoff) – 20% HBP with additional 79% not expiring for 5+ years  44 operated horizontal wells completed and online in Antero core areas − 100% drilling success rate 3 plants at Seneca Processing Complex capable of processing 600 MMcf/d of rich gas − Over 500 MMcf/d being processed currently, including third party production  Net production of 143 MMcfe/d in 3Q 2014 including 7,700 Bbl/d of liquids − Seneca 3 processing plant online in July 2014 − Fourth third party compressor station expected in-service December 2014 with a capacity of 120 MMcf/d  997 future gross drilling locations (743 or 75% are processable gas)  6.4 Tcfe of net 3P (13% liquids), includes 537 Bcfe of proved reserves (assuming ethane rejection) LEADING UTICA SHALE CORE POSITION DELIVERS CONDENSATE AND NGLS 20 Utica Shale Industry Activity(1) Cadiz Processing Plant NORMAN UNIT 30-Day Rate 2 wells average 17.2 MMcfe/d (17% liquids) RUBEL UNIT 30-Day Rate 3 wells average 17.3 MMcfe/d (22% liquids) GULFPORT 24-Hour IP McCort1-28H, 2-28H, Stutzman 1-14H Average 13.1 MMcf/d + 922 Bbl/d NGL + 21 Bbl/d Oil GULFPORT 24-Hour IP Wagner 1-28H, Shugert 1-1H, 1-12H Average 21.0 MMcf/d + 2,270 Bbl/d NGL + 292 Bbl/d Oil Utica Core Area GARY UNIT 30-Day Rate 3 wells average 24.3 MMcfe/d (22% liquids) Highly-Rich/Cond 19,000 Net Acres 143 Gross Locations Highly-Rich Gas 20,000 Net Acres 87 Gross Locations Rich Gas 31,000 Net Acres 265 Gross Locations Dry Gas 32,000 Net Acres 254 Gross Locations NEUHART UNIT 3H 30-Day Rate 16.4 MMcfe/d (56% liquids) Condensate 33,000 Net Acres 248 Gross Locations DOLLISON UNIT 1H 30-Day Rate 19.0 MMcfe/d (36% liquids) MYRON UNIT 1H 30-Day Rate 26.0 MMcfe/d (50% liquids) Seneca Processing Complex LAW UNIT 30-Day Rate 2 wells average 15.7 MMcfe/d (48% liquids) SCHAFER UNIT 30-Day Rate(2) 2 wells average 13.7 MMcfe/d (46% liquids) McDOUGAL UNIT 30-Day Rate 2 wells average 20.6 MMcfe/d (14% liquids)
  • 22. 0.0% 50.0% 100.0% 150.0% 200.0% $3.00 $3.50 $4.00 $4.50 $5.00 $5.50 $6.00 Condensate Highly-Rich Gas/Condensate Highly-Rich Gas Rich Gas Dry Gas Antero Rigs Employed UTICA ROR% AND GAS PRICE SENSITIVITY 21 NYMEX Price Sensitivity(1) 87 Locations ROR% at 5-Year Strip Condensate: 14% Highly-Rich Gas/Condensate: 57% Highly-Rich Gas: 76% Rich Gas: 50% Dry Gas: 45%  Large portfolio of Condensate to Dry Gas locations  Focused on drilling highly economic rich gas locations – rig symbols represent current rig location by Btu regime  Assumes 11/28/2014 WTI strip pricing for 2014-2019, flat thereafter; NGL price of 55% of WTI 1. Assumes 11/28/2014 strip pricing, market differentials and relevant transportation cost. 265 Locations 143 Locations 254 Locations 248 Locations 2H 2014 / 2015 Drilling Plan
  • 23. LARGE UTICA SHALE DRY GAS POSITION 22  Antero has ≈200,000 net acres of exposure to Utica dry gas play − 32,000 net acres in Ohio with net 3P reserves of 1.9 Tcf as of 6/30/2014 − 167,000 net acres in West Virginia and Pennsylvania with net resource of 9.5 Tcf as of 6/30/2014 (not included in 37.5 Tcfe of net 3P reserves) − 1,390 locations underlying current Marcellus Shale leasehold in West Virginia and Pennsylvania as of 9/30/2014  Expect to drill and complete a Utica Shale dry gas well in West Virginia in 2015  Other operators have reported strong Utica Shale dry gas results including the following wells: Chesapeake Hubbard BRK #3H 3,550’ Lateral IP 11.1 MMcf/d Hess Porterfield 1H-17 5,000’ Lateral IP 17.2 MMcf/d Gulfport Irons #1-4H 5,714’ Lateral IP 30.3 MMcf/d Eclipse Tippens #6H 5,858’ Lateral IP 23.2 MMcf/d Magnum Hunter Stalder #3UH 5,050’ Lateral IP 32.5 MMcf/d Antero Planned Utica Well 2015Well Operator IP (MMcf/d) Lateral Length (Ft) Stewart Winland 1300U Magnum Hunter 46.5 5,289 Bigfoot 9H Rice Energy 41.7 6,957 Stalder #3UH Magnum Hunter 32.5 5,050 Irons #1-4H Gulfport 30.3 5,714 Simms U-5H Gastar 29.4 4,447 Conner 6H Chevron 25.0 6,451 Tippens #6H Eclipse 23.2 5,858 Porterfield 1H-17 Hess 17.2 5,000 Hubbard BRK #3H Chesapeake 11.1 3,550 1. Antero acreage position reflects tax districts in which greater than 3,000 net acres are held in OH, WV and PA. Magnum Hunter Stewart Winland 1300U 5,289’ Lateral IP 46.5 MMcf/d Range Utica Well Flow Testing Chevron Conner 6H 6,451’ Lateral IP 25.0 MMcf/d Gastar Simms U-5H 4,447’ Lateral IP 29.4 MMcf/d Utica Shale Dry Gas Acreage in OH/WV/PA(1) Rice Bigfoot 9H 6,957’ Lateral IP 41.7 MMcf/d Utica Shale Dry Gas WV/PA Net Resource 9.5 Tcf 1,390 Gross Locations 167,000 Net Acres Utica Shale Dry Gas Ohio 3P Reserves 1.9 Tcf 226 Gross Locations 32,000 Net Acres Utica Shale Dry Gas Total OH/WV/PA Net Resource 11.4 Tcf 1,616 Gross Locations ≈200,000 Net Acres Stone Energy Utica Well Drilling Chesapeake Utica Well Drilling Rice Blue Thunder 10H, 12H ≈9,000’ Lateral
  • 24. FRESH WATER DISTRIBUTION SYSTEMS 23 Marcellus Fresh Water Distribution System • Provides fresh water to support Marcellus well completions • Year-round water supply sources: Ohio River and local rivers • Significant growth projected over the next twelve months as summarized below: Note: Antero acreage position reflects tax districts in which greater than 3,000 net acres are owned. 1. Represents inception to date actuals as of 6/30/2014 and 2014 guidance. 2. Estimated fee of $3.50 per barrel at an average of 200,000 Bbls of water per well. Utica Fresh Water Distribution System • Provides fresh water to support Utica well completions • Year-round water supply sources: local reservoirs and rivers • Significant growth projected over the next twelve months as summarized below: Marcellus Water System YE 2014 Buried Water Pipeline (Miles) 107 Fresh Water Storage Impoundments 26 Water Fees per Well ($)(2) $600K - $800K Utica Water System YE 2014 Buried Water Pipeline (Miles) 48 Fresh Water Storage Impoundments 8 Water Fees per Well ($)(2) $600K - $800K OHIO Projected Midstream Infrastructure(1) Marcellus Shale Utica Shale Total YE 2014E Cumulative Fresh Water System Capex ($MM) $300 $100 $400 Water Pipelines (Miles) 107 48 155 Water Storage Facilities 26 8 34
  • 25. - 500,000 1,000,000 1,500,000 2,000,000 2,500,000 3,000,000 3,500,000 4,000,000 4,500,000 FIRM TRANSPORTATION AND FIRM SALES PORTFOLIO 24 MMBtu/d Columbia 7/26/2009 – 9/30/2025 Firm Sales #1 10/1/2011– 10/31/2019 Firm Sales #2 10/1/2011 – 5/31/2017 Firm Sales #3 1/1/2013 – 5/31/2022 Momentum III 9/1/2012 – 12/31/2023 EQT 8/1/2012 – 6/30/2025 REX/MGT/ANR 7/1/2014 – 12/31/2034 Tennessee 11/1/2015– 9/30/2030 Mid-Atlantic/NYMEX Gulf Coast Appalachia or Gulf Coast Appalachia Appalachia ANR 3/1/2015– 2/28/2045 Midwest Local Distribution 11/1/2015 – 9/30/2037 Gulf Coast
  • 26. $0.14 $0.17 $0.23 $0.33 $0.11 $0.11 $0.12 $0.13 $0.00 $0.10 $0.20 $0.30 $0.40 $0.50 $0.60 $0.70 2013A 2014E 2015E 2016E ($/MMBtu) Wtd. Avg. FT Demand ($/MMBtu) Wtd. Avg. FT Commodity/Fuel ($/MMBtu) All-in Firm Transportation Costs(1) FIRM TRANSPORTATION REDUCES APPALACHIAN BASIS EXPOSURE Appalachia 49% Gulf Coast 51% 2013 Firm Transportation(1)(2) 2013 Firm Transportation – 647 MMcf/d Average All-in FT Cost $0.25/MMBtu 2016 Firm Transportation – 3.1 Bcf/d Average All-in FT Cost $0.46/MMBtu + $0.18/MMBtu  Antero’s firm transportation (FT) portfolio increases visibility on production growth and increases exposure to Gulf Coast and Midwest pricing, with little incremental cost per Mcf  Reduces weighted average basis by $0.27 per MMBtu compared to 2014 basis and by $0.14 per MMBtu applying 2014 portfolio to 2016 basis prices(3) – while significantly reducing Appalachian basis exposure Utilized portion included in cash production expense (fixed cost) 1. Assumes full utilization of firm transportation capacity; page 14 assumes Antero targeted production figures. 2. Represents accessible firm transportation and sales agreements. 3. Based on current strip pricing as at 11/28/2014. Included in cash production expense (variable cost) $0.25 $0.28 $0.35 $0.46 2016 Basis(3) TCO – $(0.47)/MMBtu DOM S – $(1.16)/MMBtu 2016 Basis(3) Chicago – $(0.04)/MMBtu 2016 Basis(3) CGTLA – $(0.09)/MMBtu 25 Appalachia 35% Midwest 20% Gulf Coast 45%
  • 27. 0 500 1,000 1,500 2,000 2,500 3,000 3,500 Firm Transportation / Firm Sales (BBtu/d) Marketable FT (BBtu/d) (3) Risked Gross Gas Production Target (Bbtu/d) ANTERO FIRM TRANSPORTATION APPROPRIATELY DESIGNED TO ACCOMMODATE GROWTH 261. Based on midpoint of production guidance of 990-1,010 MMcfe/d for 2014 and 45-50% production growth targets for 2015 and 2016. 2. Assumes 1100 BTU residue sales gas. 3. Represents excess firm transportation that is deemed marketable to 3rd parties based on a positive differential between the receipt and delivery points of the FT capacity, less variable transport cost. % FT Utilization (including marketable FT): (BBtu/d) 4Q 2014 2015 2016 Net Production Target (MMcfe/d) (1) 1,237 1,500 2,200 Net Gas Production Target (MMcf/d) 1,050 1,225 1,775 Net Revenue Interest Gross-up 81% 80% 80% Gross Gas Production Target (MMcf/d) 1,293 1,525 2,223 BTU Upgrade (2) x1.100 x1.100 x1.100 Gross Gas Production Target (BBtu/d) 1,422 1,678 2,446 Firm Transportation / Firm Sales (BBtu/d) 1,775 2,225 3,150 Estimated % Utilization of FT/FS 80% 75% 78% Marketable Firm Transport (BBtu/d) (3) 225 325 325 Estimated % Utilization of FT/FS (Including Marketable FT) 92% 88% 87% Cost of Unutilized / Unmarketable FT ($MM) $1.8 $10.8 $21.1 $ / Mcfe of Net Production Target $0.02 $0.02 $0.03 % FT Utilization (including marketable FT): % FT Utilization (including marketable FT):• Antero’s firm transport (FT) is well utilized during the forecast period (75% - 80%) − Excess FT for acquisitions and well productivity improvements • A portion of the excess FT is highly marketable, further increasing utilization to the 87% - 92% range • Cost of remaining unutilized FT is immaterial ($0.02 - $0.03/Mcfe assuming net production target) • Expect to fully utilize FT portfolio by 2018 92% 88% 87%
  • 28. Keys to Execution Local Presence  Antero has more than 4,500 employees and contract personnel working full-time for Antero in West Virginia. 79% of these personnel are West Virginia residents.  Land office in Ellenboro, WV  District office in Bridgeport, WV  192 (44%) of Antero’s 433 employees are located in West Virginia and Ohio Safety & Environmental  Five company safety representatives and 56 safety consultants cover all material field operations 24/7 including drilling, completion, construction and pipelining  41 person environmental staff plus outside consultants monitor all operations and perform baseline water well testing Central Fresh Water System & Water Recycling  Numerous sources of water – built central water system to source fresh water for completions  Antero recycled over 80% of its flowback and produced water through the first 9 months of 2014 – no discharge to water treatment plants in West Virginia Natural Gas Vehicles (NGV)  Antero supported the first natural gas fueling station in West Virginia  Antero has 30 NGV trucks and plans to continue to convert its truck fleet to NGV Pad Impact Mitigation  Closed loop mud system – no mud pits  Protective liners or mats on all well pads in addition to berms Natural Gas Powered Drilling Rigs & Frac Equipment  11 of Antero’s contracted drilling rigs are currently running on natural gas  First natural gas powered clean fleet frac crew began operations this summer Green Completion Units  All Antero well completions use green completion units for completion flowback, essentially eliminating methane emissions (full compliance with EPA 2015 requirements) LEED Gold Headquarters Building  Recently moved into new corporate headquarters in Denver, Colorado that has been LEED Gold Certified HEALTH, SAFETY, ENVIRONMENT & COMMUNITY Antero Core Values: Protect Our People, Communities And The Environment Strong West Virginia Presence  79% of all Antero Marcellus employees and contract workers are West Virginia residents  Antero named Business of the Year for 2013 in Harrison County, West Virginia “For outstanding corporate citizenship and community involvement”  Antero representatives recently participated in a ribbon cutting with the Governor of West Virginia for the grand opening of the first natural gas fueling station in the state; Antero supported the station with volume commitments for its NGV truck fleet 27
  • 29. CLEAN FLEET & CNG TECHNOLOGY LEADER ● Antero has contracted for two clean completion fleets to enhance the economics of its completion operations and reduce the environmental impact ● Replaces diesel engines (for pressure pumping) with electric motors powered by natural gas-fired electric generators ● A clean fleet allows Antero to fuel part of its completion operations from field gas instead of more expensive diesel fuel. Benefits of using a clean fleet include: − Reduce fuel costs by up to 80% representing cost savings of up to $40,000/day − Reduces NOx and CO emissions by 99% − Eliminates 25 diesel trucks from the roads for an average well completion − Reduces silica dust to levels 90% below OSHA permissible exposure limits resulting in a safer and cleaner work environment − Significantly reduces noise pollution from a well site − Is the most environmentally responsible completion solution in the oil and gas industry • Additionally, Antero utilizes compressed natural gas (CNG) to fuel its truck fleet in Appalachia − Antero supported the first natural gas fueling station in West Virginia − Antero has 30 NGV trucks and plans to continue to convert its truck fleet to NGV 28
  • 30. 29 Antero Midstream (NYSE: AM) Asset Overview
  • 31. 1. Represents inception to date actuals as of 6/30/2014 and 2H 2014 and next twelve months (NTM) guidance. 2. Includes $14.7 million of maintenance capex. 30 • Gathering and compression assets in core of rapidly growing Marcellus and Utica Shale plays – Acreage dedication of ~390,000 net leasehold acres for gathering and compression services – 100% fixed fee long term contracts Utica Shale Marcellus Shale Projected Midstream Infrastructure(1) Marcellus Shale Utica Shale Total YE 2014E Cumulative Gathering/ Compression Capex ($MM) $850 $350 $1,200 Gathering Pipelines (Miles) 180 85 265 Compression Capacity (MMcf/d) 370 - 370 Condensate Gathering Pipelines (Miles) - 20 20 NTM (9/30/2015) Gathering/ Compression Capex ($MM)(2) $473 $129 $602 Gathering Pipelines (Miles) 219 108 327 Compression Capacity (MMcf/d) 835 - 835 Condensate Gathering Pipelines (Miles) - 27 27 Midstream Assets SUBSTANTIAL INVESTMENT IN MIDSTREAM MLP (NYSE: AM)
  • 32. ANTERO MIDSTREAM ASSETS – RICH GAS MARCELLUS 31 • Provides Marcellus gathering and compression services − Liquids-rich gas is delivered to MWE’s Sherwood Complex for processing • Significant growth projected over the next twelve months as set out below: • Antero sold the Harrison County portion of its gathering system to a 3rd party midstream company in 2012, which is now recognized as the 3rd Party Gathering and Compression Dedication area • Development upside as AR continues to drill, step-out and add acreage Marcellus Gathering & Compression Note: Antero acreage position reflects tax districts in which greater than 3,000 net acres are owned. YE 2014 9/30/2015 Gathering Pipelines (Miles) 180 219 Compression Capacity (MMcf/d) 370 835 WV/PA Utica Dry Gas Gathering & Compression • Further development upside in 167,000 net acres of Utica deep rights beneath the Marcellus Shale − Will require a separate dry gas gathering system
  • 33. 32 • Provides Utica natural gas and condensate gathering services − Liquids-rich gas delivered into MWE’s Seneca Complex for processing − Condensate delivered to centralized stabilization and truck loading facilities • Significant growth projected over the next twelve months as set out below: • Development upside as AR continues to drill, step-out and add acreage Utica Gathering Note: Antero acreage position reflects tax districts in which greater than 3,000 net acres are owned. ANTERO MIDSTREAM ASSETS – RICH & DRY GAS UTICA YE 2014 9/30/2015 Gathering Pipelines (Miles) 85 108 Condensate Pipelines (Miles) 20 27 Utica Compression • Opportunity to build up to ten new compressor stations that are planned to support AR development over the next several years − Compressor stations are not included in AM NTM forecast
  • 35. PRO FORMA CAPITALIZATION($ in millions) 9/30/2014 Pro Forma $1.15 Bn AM IPO(4) 9/30/2014 Cash $6 $256 Senior Secured Revolving Credit Facility 1,505 662 6.00% Senior Notes Due 2020 525 525 5.375% Senior Notes Due 2021 1,000 1,000 5.125% Senior Notes Due 2022 1,100 1,100 Net Unamortized Premium 8 8 Total Debt $4,138 $3,295 Net Debt $4,132 $3,039 Minority Interest - $326 Shareholders' Equity $3,751 $4,372 Net Book Capitalization $7,883 $7,737 Enterprise Value(1) $15,992 $15,225 Financial & Operating Statistics LTM EBITDAX $1,047 $1,047 LQA EBITDAX $1,109 $1,109 LTM Interest Expense(2) $155 $138 Proved Reserves (Bcfe) (6/30/2014) 9,107 9,107 Proved Developed Reserves (Bcfe) (6/30/2014) 2,772 2,772 Credit Statistics Net Debt / LTM EBITDAX 3.9x 2.9x Net Debt / LQA EBITDAX 3.7x 2.7x LTM EBITDAX / Interest Expense 6.8x 7.6x Net Debt / Net Book Capitalization 52.4% 39.3% Net Debt / Proved Developed Reserves ($/Mcfe) $1.49 $1.10 Net Debt / Proved Reserves ($/Mcfe) $0.45 $0.33 Liquidity Credit Facility Commitments(3)(4) $3,000 $4,000 Less: Borrowings (1,505) (662) Less: Letters of Credit (332) (332) Plus: Cash 6 256 Liquidity (Undrawn Credit Facility + Cash) $1,169 $3,262 1. Equity valuation based on 262.0 million shares outstanding and a share price of $45.26 as of 12/2/2014. Enterprise value includes net debt plus minority interest. 2. LTM interest expense adjusted for $1,578 million net proceeds from IPO priced on 10/14/2013 and $1,000 million 5.375% Senior Notes priced on 10/24/2013 net of fees; assumes $525 million 9.375% Senior Notes, $25 million 9.00% Senior Notes, $140 million 7.25% Senior Notes repaid at 10/31/2013 with residual cash used to repay bank debt. Adjusted for $600 million 5.125% Senior Notes priced on 4/23/2014 net of fees; $260 million of 7.25% Senior Notes and $315 million of bank debt repaid. Adjusted for $500 million 5.125% Senior Notes add-on priced on 9/4/2014 at 100.5 net of fees; $496 million of bank debt repaid. 3. AR lender commitments under the facility increased to $3.0 billion from $2.5 billion on 10/16/2014; commitments can be expanded to the full $4.0 billion borrowing base upon bank approval. AM credit facility of $1 billion as of 11/4/2014. 4. Pro forma for $1,150 million IPO of 70% post-offering owned Antero Midstream; $843 million of debt repaid, $250 million of cash left at AM and $57 million of transaction expenses. AM $1 billion credit facility currently undrawn. 34
  • 36. ANTERO RESOURCES – 2014 GUIDANCE 35 Key Variable 2014 Guidance Range Natural Gas Realized Price Differential to NYMEX ($/Mcf)(2) $(0.15) – $(0.25) Oil Realized Price Differential to WTI ($/Bbl) $(10.00) – $(12.00) NGL Realized Price (% of WTI) 53% – 57% Net Production (MMcfe/d) 990 – 1,010 Net Natural Gas Production (MMcf/d) 840 – 850 Net Liquids Production (Bbl/d) 25,000 – 26,000 Cash Production Expense ($/Mcfe)(3) $1.50 – $1.60 Marketing Expense, Net ($/Mcfe) $0.10 – $0.20 G&A Expense ($/Mcfe) $0.25 - $0.30 Total Wells Spud 215 Capital Expenditure ($MM) Drilling & Completion $2,400 Midstream $850 Land $450 Total Capex ($MM) $3,700 1. Financial assumptions per Company press release dated 8/26/2014. 2. Antero’s processed tailgate and unprocessed dry gas production is greater than 1000 BTU on average. 3. Includes lease operating expenses, gathering, compression and transportation expenses and production taxes. Excludes net marketing expense. Key 2014 Operating & Financial Assumptions(1)
  • 37. 118 118 118 162 189 214 285 371 420 450 485 Marcellus Net Acres Utica Net Acres 0 25 50 75 100 125 150 175 200 225 250 275 300 325 0 100 200 300 400 500 600 700 800 900 1,000 Jun-09 Dec-09 Jun-10 Dec-10 Jun-11 Dec-11 Jun-12 Dec-12 Jun-13 Dec-13 Jun-14 Net Production (MMcfe/d) (left axis) Gross Operated Horizontal Well Count (right axis) 36 AR “NAV” GROWTH (MMcfe/d) (# of Gross Wells) Initial Antero Marcellus Wells Initial Antero Utica Wells  Land acquisitions and drill bit drive NAV growth Added 35,000 net acres in 1H 2014 for ~$240 million, which resulted in 2.0 Tcfe of 3P reserves and $1.5 billion of PV-10 value (1) 1. Assuming June 30, 2014 SEC Pricing. Average Rig Count 20 Rigs 1 Rig
  • 38. LOWEST FINDING & DEVELOPMENT COST AMONG U.S. PRODUCERS 37 3-Year All-In F&D Cost – Excluding Revisions ($/Mcfe) through 2013 Source: Credit Suisse research dated 4/28/2014.  Antero ranks as the most efficient finder and developer of reserves, on a per Mcfe basis, based on a 2011-2013 average all-in F&D cost analysis prepared by Credit Suisse $10.24 $7.14 $6.68 $5.74 $4.66 $4.66 $4.54 $4.23 $4.01 $3.70 $3.63 $3.28 $3.12 $3.07 $3.05 $3.05 $2.91 $2.91 $2.88 $2.87 $2.78 $2.66 $2.57 $2.40 $2.06 $1.94 $1.74 $1.60 $1.53 $1.26 $1.04 $0.84 $0.79 $0.58 $0 $2 $4 $6 $8 $10 $12 MHR APC GPOR MUR APA MRO WLL FANG KOG CRK EXXI EOX PVA CXO DVN KWK FST DNR NBL EOG CRZO PXD BCEI SD CHK ROSE SFY ATHL EPE REXX SWN PDCE RRC AR
  • 39. MARCELLUS SINGLE WELL ECONOMICS – IN ETHANE REJECTION 38 DRY GAS LOCATIONS RICH GAS LOCATIONS HIGHLY RICH GAS LOCATIONS Assumptions  Natural Gas – 11/28/2014 strip  Oil – 11/28/2014 strip  NGLs – 55% of Oil Price NYMEX ($/MMBtu) WTI ($/Bbl) C3+ NGL(2) ($/Bbl) 2015 $3.82 $67 $37 2016 $3.83 $70 $38 2017 $3.96 $73 $40 2018 $4.09 $76 $41 2019+ $4.21 $77 $42 Marcellus SSL Well Economics and Total Gross Locations(1) Classification Highly-Rich Gas/ Condensate Highly-Rich Gas Rich Gas Dry Gas Modeled BTU 1313 1250 1150 1050 EUR (Bcfe): 16.1 14.6 13.1 11.9 EUR (MMBoe): 2.7 2.4 2.2 2.0 % Liquids: 33% 24% 12% 0% Lateral Length (ft): 7,000 7,000 7,000 7,000 Stage Length (ft): 225 225 225 225 Well Cost ($MM): $9.5 $9.5 $9.5 $9.5 Bcfe/1,000’: 2.3 2.1 1.9 1.7 Pre-Tax NPV10 ($MM): $13.1 $8.5 $2.2 $1.7 Pre-Tax ROR: 55% 37% 17% 16% Net F&D ($/Mcfe): $0.69 $0.76 $0.86 $0.94 Payout (Years): 1.6 2.3 4.8 5.2 Gross 3P Locations(3): 727 896 633 875 1. Well economics are based on 11/28/2014 strip differential pricing and related transportation costs. Includes gathering, compression and processing fees. 2. Pricing for a 1225 BTU y-grade ethane rejection barrel. 3. Undeveloped well locations as of 9/30/2014. 727 896 633 875 55% 37% 17% 16% 0 200 400 600 800 1,000 0% 25% 50% 75% 100% Highly-Rich Gas/ Condensate Highly-Rich Gas Rich Gas Dry Gas Total3PLocations ROR Locations ROR 2H 2014 / 2015 Drilling Plan
  • 40. 248 143 87 265 254 14% 57% 76% 50% 45% 0 50 100 150 200 250 300 0% 20% 40% 60% 80% 100% Condensate Highly-Rich Gas/ Condensate Highly-Rich Gas Rich Gas Dry Gas Total3PLocations ROR Locations ROR UTICA SINGLE WELL ECONOMICS – IN ETHANE REJECTION 39 DRY GAS LOCATIONS RICH GAS LOCATIONS HIGHLY RICH GAS LOCATIONS Utica Well Economics and Gross Locations(1) Classification Condensate Highly-Rich Gas/ Condensate Highly-Rich Gas Rich Gas Dry Gas Modeled BTU 1275 1235 1215 1175 1050 EUR (Bcfe): 7.4 13.3 19.9 18.5 16.6 EUR (MMBoe): 1.2 2.2 3.3 3.1 2.8 % Liquids 35% 26% 21% 14% 0% Lateral Length (ft): 7,000 7,000 7,000 7,000 7,000 Stage Length (ft): 240 240 240 240 240 Well Cost ($MM): $11.0 $11.0 $11.0 $11.0 $11.0 Bcfe/1,000’: 1.1 1.9 2.8 2.7 2.4 Pre-Tax NPV10 ($MM): $1.2 $9.6 $16.6 $11.5 $10.0 Pre-Tax ROR: 14% 57% 76% 50% 45% Net F&D ($/Mcfe): $1.84 $1.02 $0.68 $0.73 $0.82 Payout (Years): 5.5 1.5 1.1 1.5 1.5 Gross 3P Locations(3): 248 143 87 265 254 1. Well economics are based on 11/28/2014 strip differential pricing and related transportation costs. Includes gathering, compression and processing fees. 2. Pricing for a 1225 BTU y-grade ethane rejection barrel. 3. Undeveloped well locations as of 9/30/2014, adjusted for subsequent 130 gross locations acquired as of 11/3/2014. 3P locations representative of BTU regime; EUR and economics within regime will vary based on BTU content. 2H 2014 / 2015 Drilling Plan Assumptions  Natural Gas – 11/28/2014 strip  Oil – 11/28/2014 strip  NGLs – 55% of Oil Price NYMEX ($/MMBtu) WTI ($/Bbl) C3+ NGL(2) ($/Bbl) 2015 $3.82 $67 $37 2016 $3.83 $70 $38 2017 $3.96 $73 $40 2018 $4.09 $76 $41 2019+ $4.21 $77 $42
  • 41. 3-Year Average Growth – Adjusted Recycle Ratio through 2013 0.0x 2.0x 4.0x 6.0x 4.8x 3.3x3.5x 2.4x $0.00 $1.00 $2.00 $3.00 $4.00 $5.00 $6.00 $1.15 $1.18 $1.21 $1.60 Other Peers LOW DEVELOPMENT COST DRIVES BEST IN CLASS RECYCLE RATIOS 40 Source: Proved developed F&D industry data based on company presentations, 10-Ks and press releases. Defined as total drilling and completion capital expenditures for the period divided by PDP and PDNP volumes added after adding back production for the period. Includes all drilling and completion costs but excludes land and acquisition costs for all companies. 1. Antero data pro forma for Arkoma and Piceance divestitures in 2012. 3-Year Proved Development Costs ($/Mcfe) through 2013 Antero Appalachia-Focused Peers Source: Wall Street research. Defined as 2011-2013 average (Cash Operating Netback / PD F&D costs) x (1 + 2013-2015 consensus production CAGR). Antero’s production CAGR based on guidance targets. PD F&D Costs defined as total drilling and completion capital expenditures for the period divided by PDP and PDNP volumes added after adding back production for the period Includes all drilling and completion costs but excludes land and acquisition costs for all companies. 1. Antero data pro forma for Arkoma and Piceance divestitures in 2012. Antero Appalachia-Focused Peers $/Mcfe Other Peers
  • 42. - 5.0 10.0 15.0 20.0 25.0 30.0 30-DayRate(MMcfe/d) Liquids Gas 51% Avg. Liquids 7,201’ Avg. Lateral Condensate Highly-Rich Gas / Condensate Highly-Rich Gas Rich Gas ANTERO UTICA SHALE WELLS – 30-DAY RATES Outstanding 30-day average rates with high liquids content – Antero’s wells produced against 1,100 psi line pressure until late January 2014 due to lack of compression facilities – First 120 MMcf/d compressor station started up in late January 2014, a second 120 MMcf/d station was placed online in late March 2014 and a third 100 MMcf/d station was placed online in early July 2014 37% Avg. Liquids 5,993’ Avg. Lateral 22% Avg. Liquids 7,481’ Avg. Lateral 14% Avg. Liquids 6,790’ Avg. Lateral Type Curve Regimes (1) 1. Excludes wells under choke management program. 2. Normalized for 7,000’ lateral. 3. In ethane rejection. 14.3 MMcfe/d or 2,383 Boe/d 14.6 MMcfe/d 20.9 MMcfe/d 18.4 MMcfe/d 13.9 MMcfe/d Normalized(2) 17.0 MMcfe/d Normalized(2) 19.5 MMcfe/d Normalized(2) 19.0 MMcfe/d Normalized(2) Average 30-Day Production Rate(3) 41
  • 43. CONSIDERABLE RESERVE BASE WITH ETHANE OPTIONALITY  30 year proved reserve life based on 1H 2014 production annualized  Reserve base provides significant exposure to liquids-rich projects – 3P reserves of over 2.3 BBbl of NGLs and condensate in ethane recovery mode; 33% liquids 1. Ethane rejection occurs when ethane is left in the wellhead gas stream as the gas is processed, rather than being separated out and sold as a liquid after fractionation. When ethane is left in the gas stream, the BTU content of the residue gas at the outlet of the processing plant is higher. Producers will elect to “reject” ethane when the price received for the higher BTU residue gas is greater than the price received for the ethane being sold as a liquid after fractionation. When ethane is recovered, the BTU content of the residue gas is lower, but a producer is then able to recover the value of the ethane sold as a separate NGL product. ETHANE REJECTION(1) ETHANE RECOVERY(1) 42 Marcellus – 26.4 Tcfe Utica – 6.4 Tcfe Upper Devonian – 4.6 Tcfe 37.5 Tcfe Gas – 31.7 Tcf Oil – 86 MMBbls NGLs – 880 MMBbls Marcellus – 31.3 Tcfe Utica – 7.3 Tcfe Upper Devonian – 5.1 Tcfe 43.7 Tcfe Gas – 29.3 Tcf Oil – 86 MMBbls NGLs – 2,305 MMBbls 15% Liquids 33% Liquids
  • 44. Moody's S&P POSITIVE RATINGS MOMENTUM Moody’s / S&P Historical Corporate Credit Ratings “We could raise the ratings due to our assessment of an improvement in the company's financial profile. An improvement in the financial profile would include maintaining FFO to debt of greater than 45% and narrowing the amount that the company outspends its cash flows by.” - S&P Credit Research, September 2014 “An upgrade could be considered if debt / average daily production is sustained below $20,000 per boe and debt / proved-developed reserves is sustained below $8.00 per boe. An upgrade would also be contingent on Antero maintaining unleveraged cash margins greater than $25.00 per boe and retained cash flow to debt over 40%.” - Moody’s Credit Research, September 2014 Credit Rating (Moody’s / S&P) Ba3 / BB- B1 / B+ B2 / B B3 / B- 9/1/2010 2/24/2011 10/21/2013 9/4/20145/31/13 Ba2 / BB Ba1 / BB+ Caa1 / CCC+ (1) ___________________________ 1. Represents corporate credit rating of Antero Resources Corporation / Antero Resources LLC. Baa3 / BBB- Moody’s Upgrade Criteria S&P Upgrade Criteria 43 9/30/2014
  • 45. PRO FORMA OFFERING – BALANCE SHEET POSITIONED FOR LONG-TERM GROWTH PRO FORMA DEBT MATURITY PROFILE (1) PRO FORMA WEIGHTED AVERAGE INTEREST RATE AND MATURITY(1) 44 1. As of 9/30/2014 per 10-Q; pro forma for $1,150 million AM IPO priced on 11/4/2014; net proceeds of $843 million used to repay the credit facility. 2. Current yields of senior notes tranches represent the current yield-to-worst per Bloomberg. 3. Represents weighted average interest rate under the revolving credit facility as of 9/30/2014. Senior Secured Revolving Credit Facility Senior Notes ($ in millions) As At Interest Current Maturity Maturity 09/30/14 Rate Yield (2) (Years) (Date) Senior Secured Revolving Credit Facility $662 2.440% (3) 2.440% (3) 4.6 May-19 6.0% Senior Notes due 2020 525 6.000% 4.836% 6.2 Dec-20 5.375% Senior Notes due 2021 1,000 5.375% 4.918% 7.1 Nov-21 5.125% Senior Notes due 2022 1,100 5.125% 5.162% 8.2 Dec-22 Total Long-Term Debt $3,287 Weighted Average: 4.800% 4.487% 6.8 Jul-21  The recent bond offerings, at progressively lower coupons, have allowed Antero to reduce its cost of debt to approximately 5.0% and enhance liquidity while extending the pro forma average debt maturity to June 2021  Current cost of debt 4.8%, average debt maturity 6.8 years $662 $525 $1,000 $1,100 $0 $200 $400 $600 $800 $1,000 $1,200 2014 2015 2016 2017 2018 2019 2020 2021 2022 ($inMillions)
  • 46. Needed to make up for base declines in conventional and GOM production ? ?? 3,000 Antero Drilling Locations Permian Niobrara GraniteWash Barnett Haynesville U.S. INCREMENTAL GAS SUPPLY BREAK-EVEN PRICE CURVE(1) 45  Low cost, liquids-rich Utica and Marcellus Shales will remain attractive in most commodity price environments Utica Shale SW (Rich) Marcellus Shale 1. Source: Credit Suisse report dated January 2014 – Break even price for 15% after tax rate-of-return; assumes $90.00/Bbl WTI NE (Dry) Marcellus Shale Eagle Ford Shale MARCELLUS & UTICA – ADVANTAGED ECONOMICS
  • 47. MARCELLUS/UTICA HAS DRIVEN GAS SUPPLY GROWTH  Of the 23 Bcf/d of expected incremental gas supply from 2009 to 2015, ~18 Bcf/d, or 78%, is expected to be generated from Marcellus and Utica production  Marcellus and Utica gross gas production in 2015 is expected to grow 3.6 Bcf/d, which represents the total expected growth in overall supply from all areas for 2015(1) 46 Gas Supply Growth by Area: 2009 – 2015E Lower 48 Gas Supply by Area Source: Simmons & Company International, “2015 US Natural Gas Outlook and Updated Long Term Demand Forecast,” September 2014; EIA. 1. Other contributing areas to growth include the Permian (+0.5 Bcf/d), Eagle Ford (+0.6 Bcf/d), Williston (+0.3 Bcf/d) and DJ (+0.2 Bcf/d), offset by declines in the Barnett (-0.3 Bcf/d) and Haynesville (-0.6 Bcf/d). Sherwood 7 Marcellus & Utica 78% Eagle Ford 22% (MMcf/d) 0 2,000 4,000 6,000 8,000 10,000 12,000 14,000 16,000 18,000 Nov-12 Nov-13 Nov-14 Marcellus production has driven U.S. gas supply growth
  • 48. LNG Exports 48% Mexico/Canada Exports 18% Power Generation 17% Transportation 1% Industrial 16% 20 Bcf/d OF INCREMENTAL GAS DEMAND BY 2020  More than 65% of the 20 Bcf/d in incremental gas demand forecast by 2020 is expected to be generated from exports: − LNG: 9.5 Bcf/d (~48%) − Mexico/Canada: 3.5 Bcf/d (~18%)  Of the 9.5 Bcf/d of expected incremental demand from LNG export projects, 5.8 Bcf/d (or 61%) of the projects have secured the necessary DOE and FERC permits 47 Incremental Demand Growth Through 2020 by Category Projected Incremental Gas Demand Through 2020 Source: Simmons & Company International, “2015 US Natural Gas Outlook and Updated Long Term Demand Forecast,” September 2014. Sherwood 7 2 5 9 13 17 20 0 4 8 12 16 20 2015 2016 2017 2018 2019 2020 Mexico/Canada Exports Power Generation Transportation Petrochem LNG Exports 9.5 Bcf/d of the 20 Bcf/d of incremental demand is expected to come from LNG exports (Bcf/d) LNG Exports Power Gen Petrochem
  • 49. LNG EXPORTS BY PROJECT – EXPECTED START UP  Assuming 9.5 Bcf/d of LNG exports by 2020, the U.S. would be the world’s 3rd largest LNG exporter (behind Qatar and Australia) − 7.7 Bcf/d (81%) of the 9.5 Bcf/d of expected LNG exports have secured US DOE non-FTA (free trade agreement) permit approval − 6.7 Bcf/d (four projects, 70%) have been awarded FERC construction permits (see next page for more detail)  The first LNG export project, Sabine Pass LNG Train 1 is expected to commence operations in early 2016 − Antero has committed to 50 MMcf/d on each of Sabine Pass Trains 1-4  In addition to the LNG projects to the right, other potential LNG projects beyond 2020 include Lake Charles (Trains 2-3), Excelerate (Lavaca) and Golden Pass (Exxon) 48 LNG Exports by Project Through 2020 (in Bcf/d) 2015 2016 2017 2018 2019 2020 Sabine Pass 1 - 0.6 - - - - Sabine Pass 2 - 0.6 - - - - Sabine Pass 3 - - 0.6 - - - Sabine Pass 4 - - 0.6 - - - Sabine Pass 5 - - - - 0.6 - Cove Point 1 - - 0.4 - - - Cove Point 2 - - - 0.4 - - Cameron 1 - - - 0.6 - - Cameron 2 - - - 0.6 - - Cameron 3 - - - - 0.6 - Freeport 1 - - - 0.5 - - Freeport 2 - - - - 0.5 - Freeport 3 - - - - 0.5 - Freeport 4 - - - - - 0.4 Corpus Christi 1 - - - - 0.6 - Corpus Christi 2 - - - - - 0.6 Lake Charles 1 - - - - - 0.6 LNG Incremental Exports - 1.2 1.6 2.2 2.9 1.7 LNG Cumulative Exports - 1.2 2.8 5.0 7.9 9.5 Antero Supply Agreements for Portion of Capacity Source: Simmons & Company International, “2015 US Natural Gas Outlook and Updated Long Term Demand Forecast,” September 2014. Data updated for recent announcements subsequent to Simmons report.
  • 50. LNG EXPORTS BY PROJECT – CURRENT STATUS 49 LNG Exports by Project – Current Status Sherwood 7 Dates of Key Milestones Send Out Non- DOE Non-FTA FERC FTA Permit Underlying Permit Construction Capacity Gas Demand Project Awarded Approval (Bcf/d) (Bcf/d) Contracts Offtakers Sabine Pass 1-4 05/20/11 04/16/12 2.20 2.42 Fully Subscribed BG, GasNatural Fenosa, Kogas, GAIL Cove Point 09/11/13 09/29/14 0.77 0.85 Fully Subscribed Sumitomo, GAIL, Tokyo Gas Cameron 02/11/14 06/19/14 1.70 1.87 Fully Subscribed Sempra, Misui, Mitsubishi, GDF Suez Freeport 05/17/13 07/30/14 1.40 1.54 Fully Subscribed Osaka Gas, Chubu Electric, BP, Toshiba, SK E&S Lake Charles 08/07/13 Expected 2015 2.00 2.20 Fully Subscribed BG Subtotal 8.07 8.88 Freeport Phase II 11/15/13 Pending 0.40 0.44 Not Subscribed N/A Total 8.47 9.32 Source: Simmons & Company International, “2015 US Natural Gas Outlook and Updated Long Term Demand Forecast,” September 2014. Data updated for recent announcements subsequent to Simmons report.
  • 51. CAUTIONARY NOTE The SEC permits oil and gas companies, in their filings with the SEC, to disclose only proved, probable and possible reserve estimates (collectively, “3P”). Antero has provided internally generated estimates for proved, probable and possible reserves in this presentation in accordance with SEC guidelines and definitions. The estimates of proved, probable and possible reserves as of June 30, 2014 included in this presentation have been audited by Antero’s third-party engineers. Unless otherwise noted, reserve estimates as of June 30, 2014 assume ethane rejection and strip pricing. Actual quantities that may be ultimately recovered from Antero’s interests may differ substantially from the estimates in this presentation. Factors affecting ultimate recovery include the scope of Antero’s ongoing drilling program, which will be directly affected by commodity prices, the availability of capital, drilling and production costs, availability of drilling services and equipment, drilling results, lease expirations, transportation constraints, regulatory approvals and other factors; and actual drilling results, including geological and mechanical factors affecting recovery rates. In this presentation:  “3P reserves” refer to Antero’s estimated aggregate proved, probable and possible reserves as of June 30, 2014. The SEC prohibits companies from aggregating proved, probable and possible reserves in filings with the SEC due to the different levels of certainty associated with each reserve category.  “EUR,” or “Estimated Ultimate Recovery,” refers to Antero’s internal estimates of per well hydrocarbon quantities that may be potentially recovered from a hypothetical future well completed as a producer in the area. These quantities do not necessarily constitute or represent reserves within the meaning of the Society of Petroleum Engineer’s Petroleum Resource Management System or the SEC’s oil and natural gas disclosure rules.  “Condensate” refers to gas having a heat content between 1250 BTU and 1300 BTU in the Utica Shale.  “Highly-Rich Gas/Condensate” refers to gas having a heat content between 1275 BTU and 1350 BTU in the Marcellus Shale and 1225 BTU and 1250 BTU in the Utica Shale.  “Highly-Rich Gas” refers to gas having a heat content between 1200 BTU and 1275 BTU in the Marcellus Shale and 1200 BTU and 1225 BTU in the Utica Shale.  “Rich Gas” refers to gas having a heat content of between 1100 BTU and 1200 BTU.  “Dry Gas” refers to gas containing insufficient quantities of hydrocarbons heavier than methane to allow their commercial extraction or to require their removal in order to render the gas suitable for fuel use. Regarding Hydrocarbon Quantities 50