Downloaded 293 times


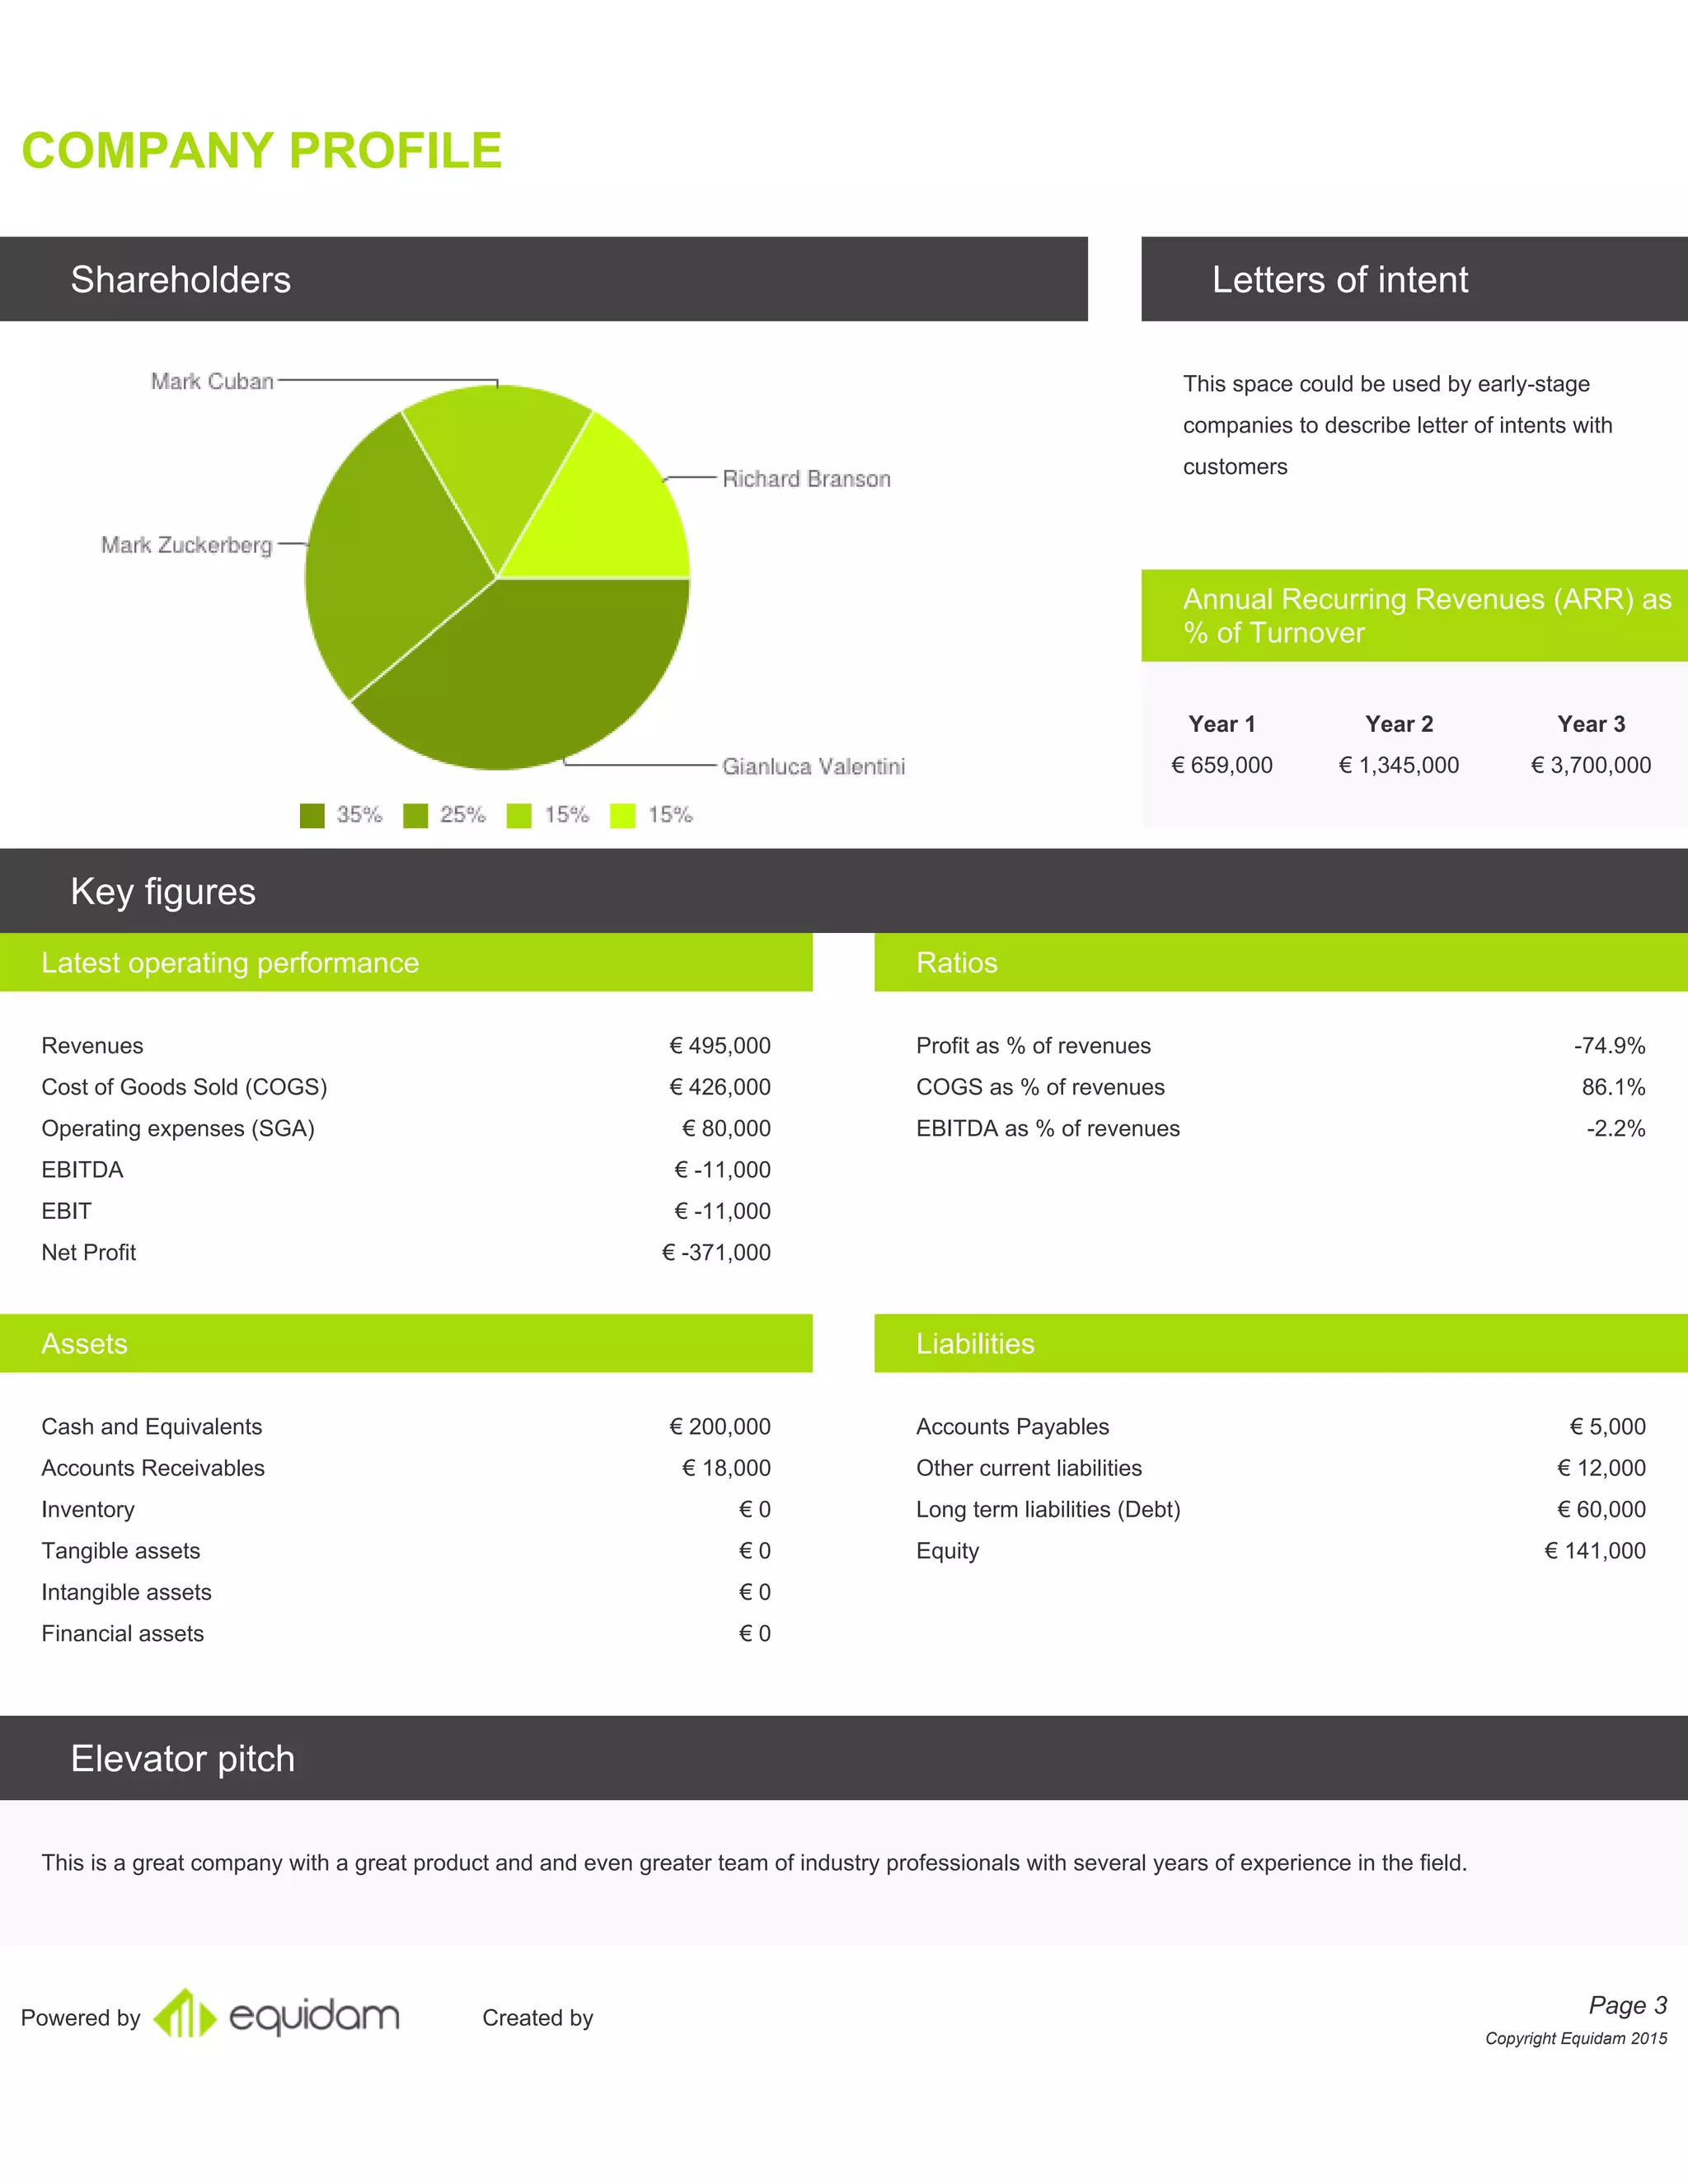
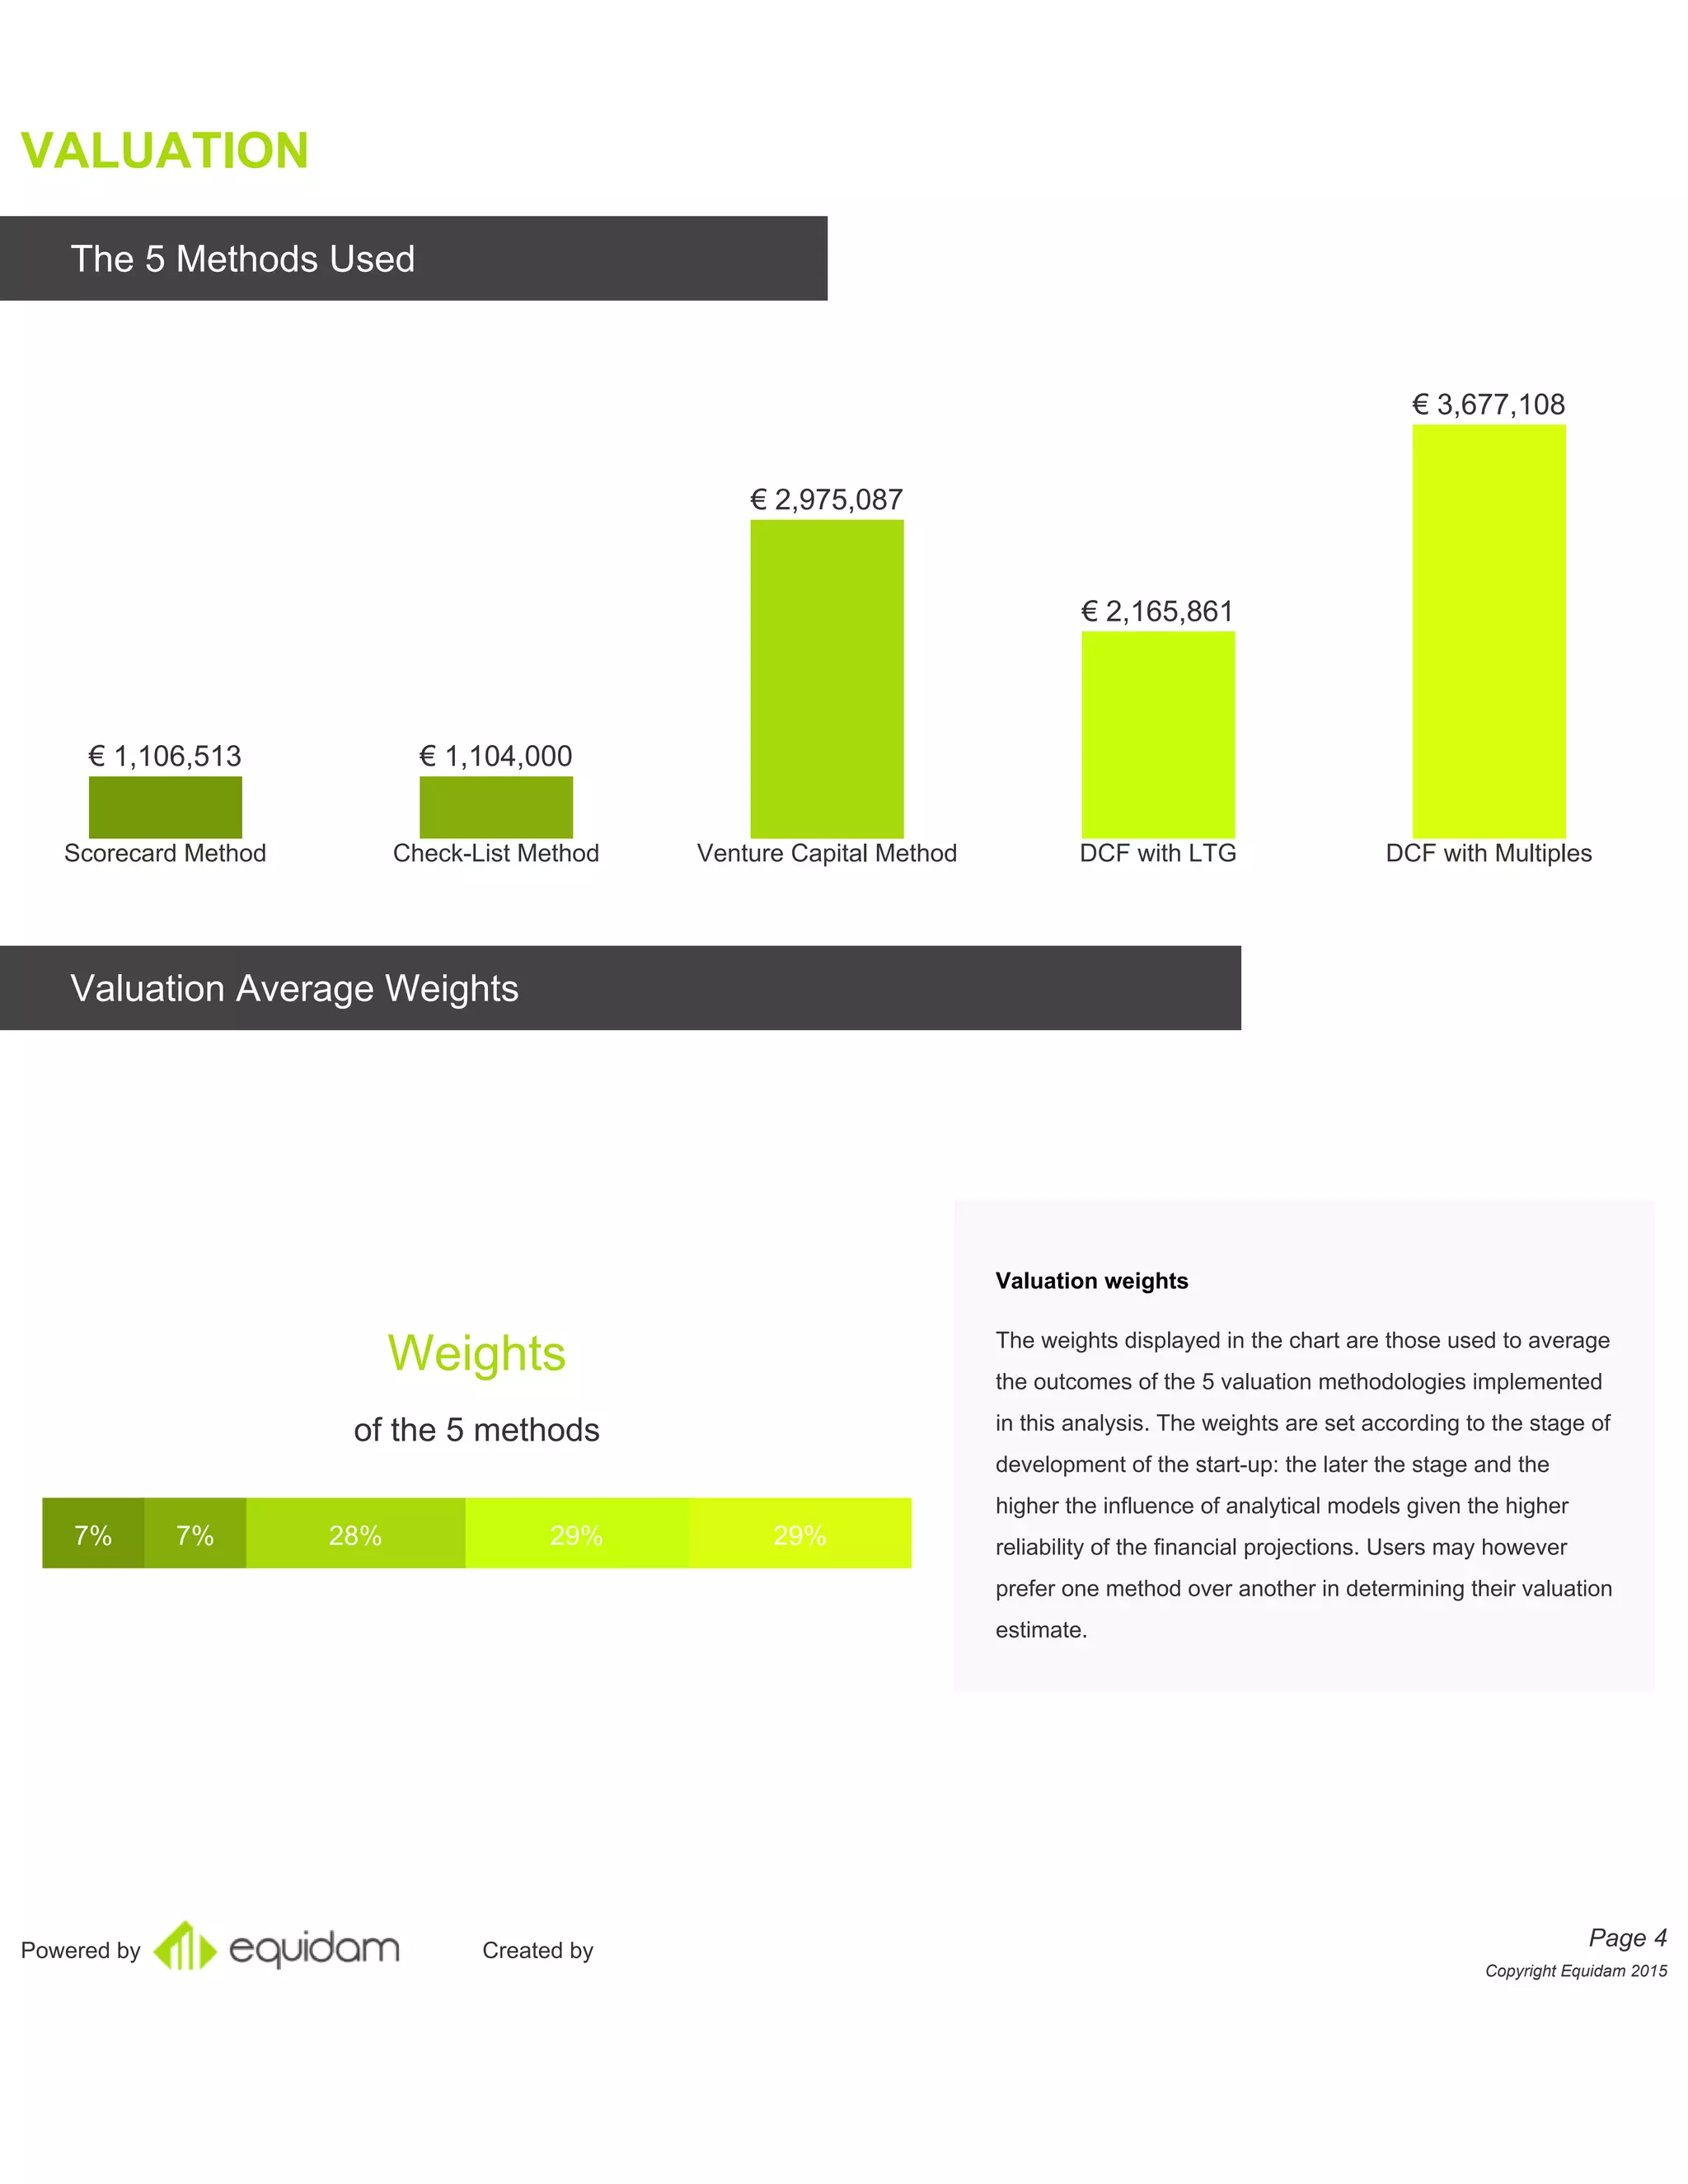
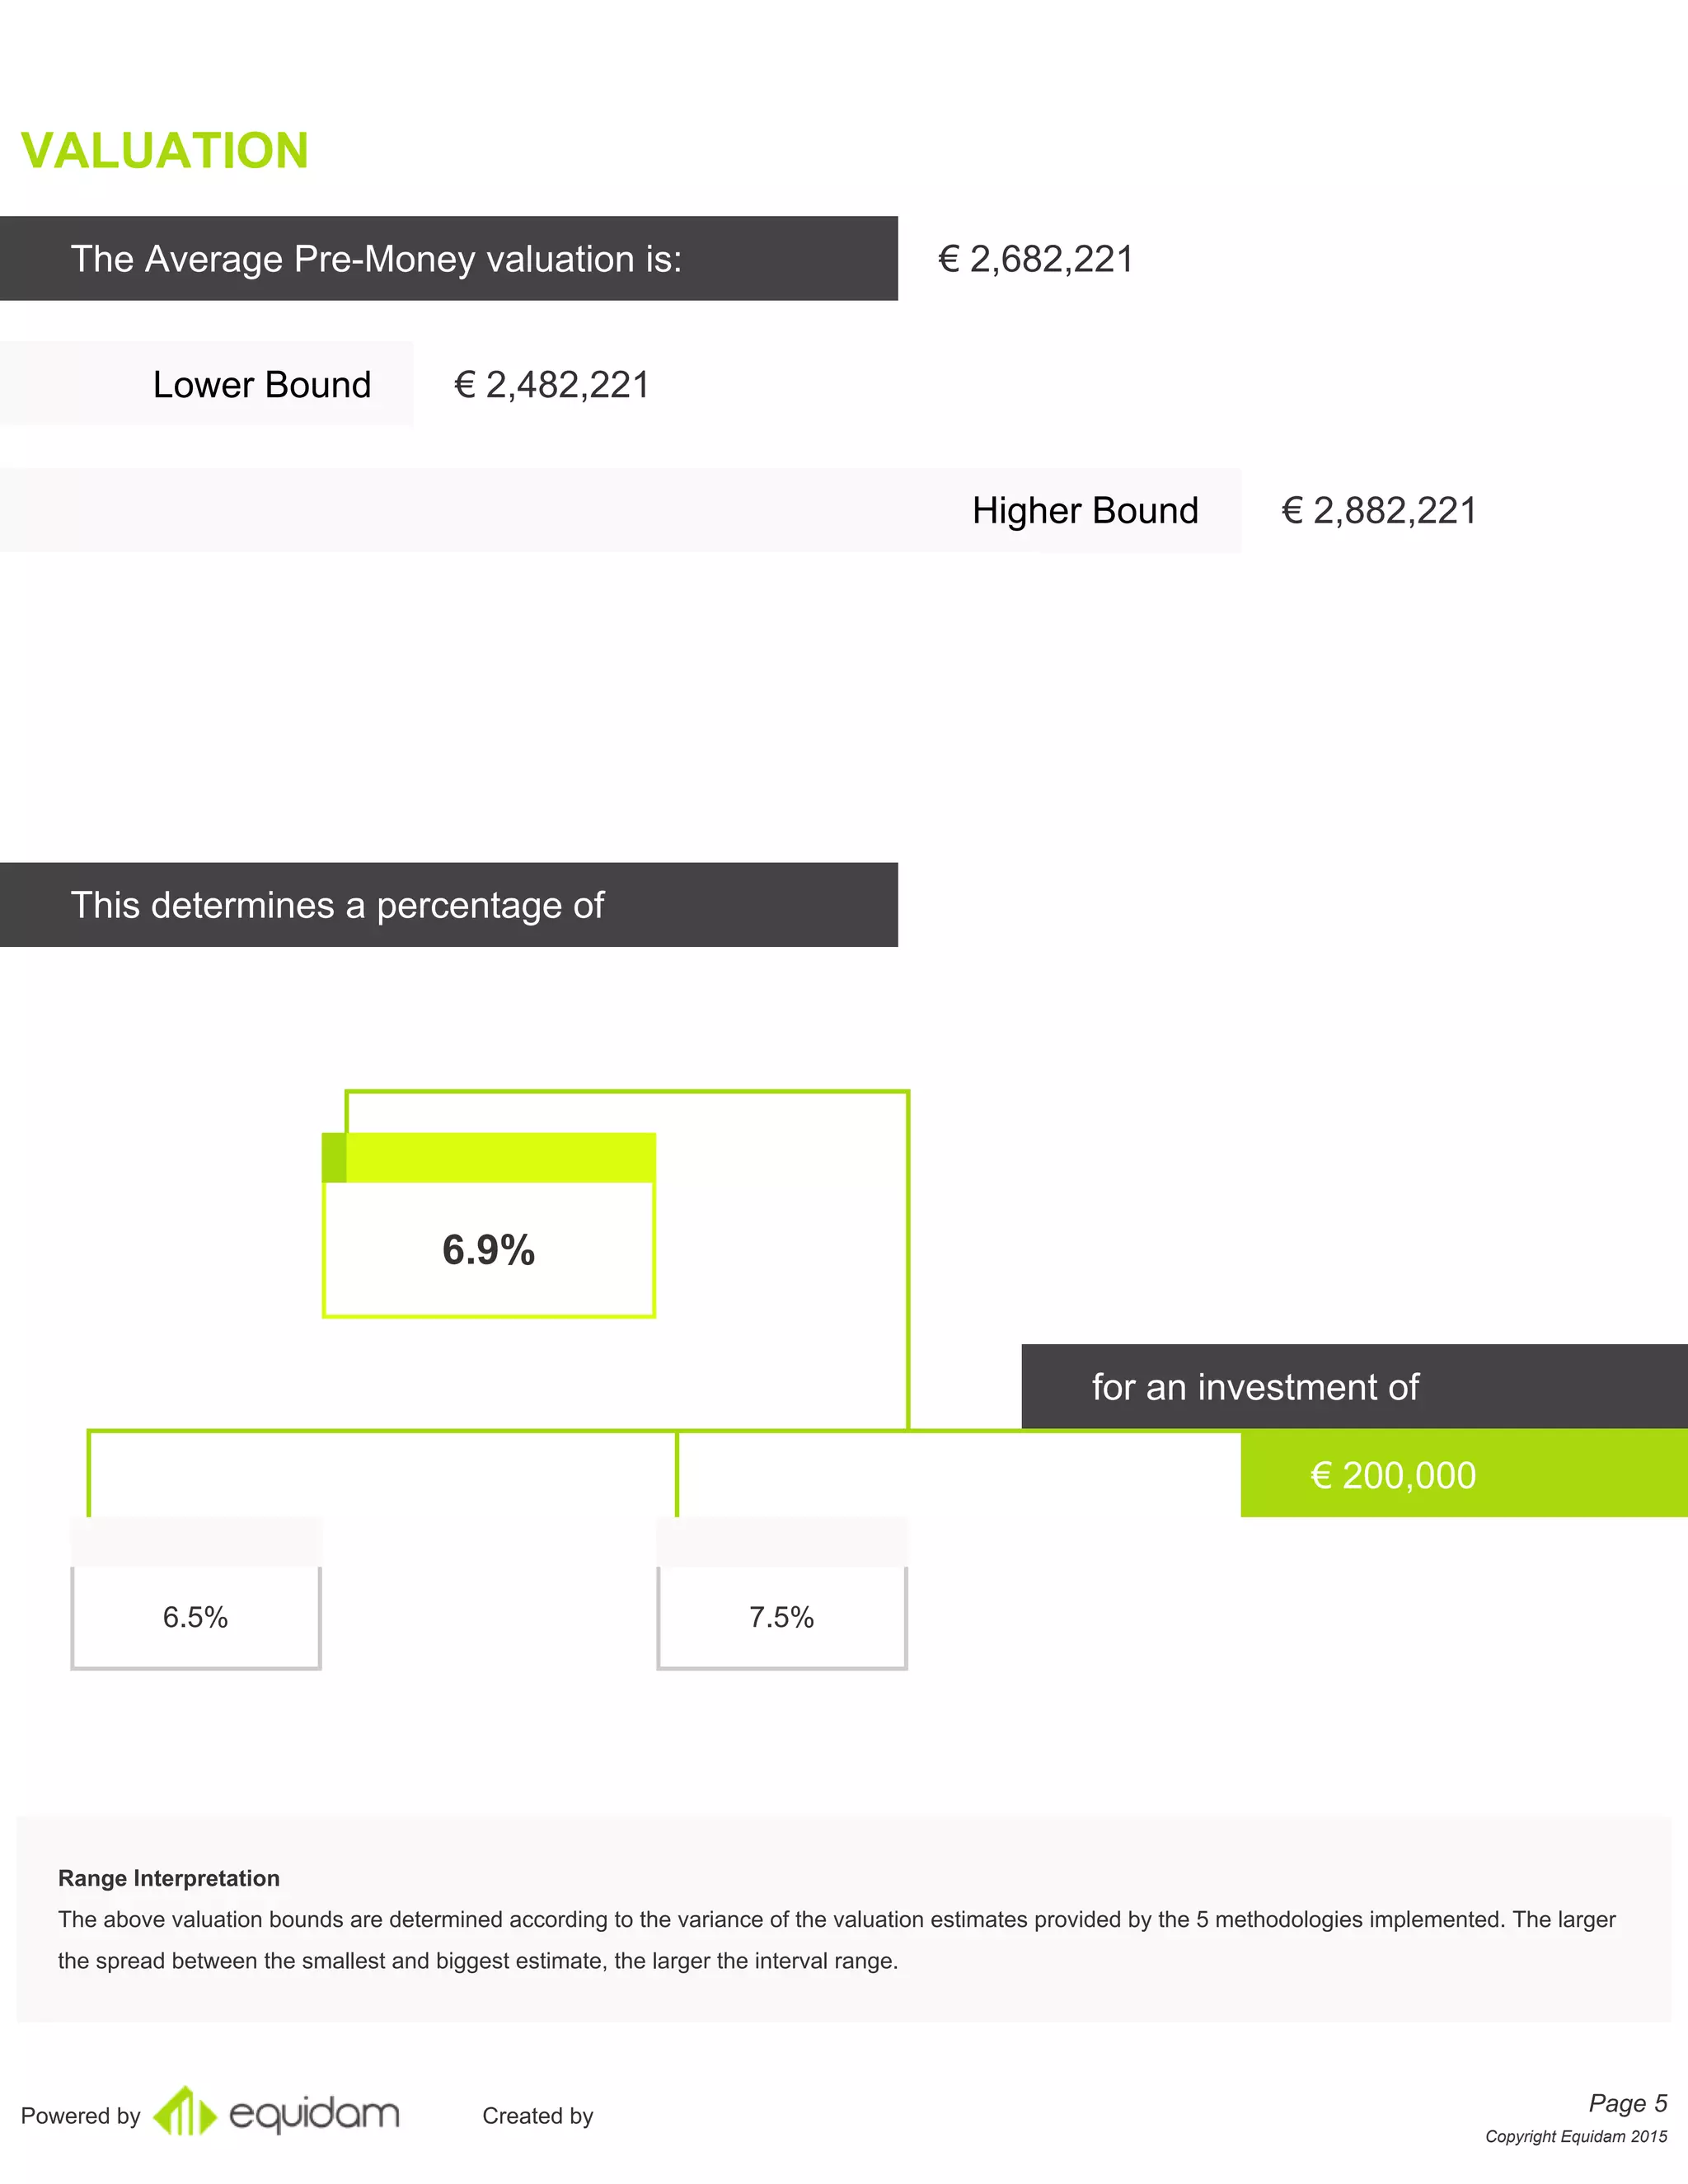
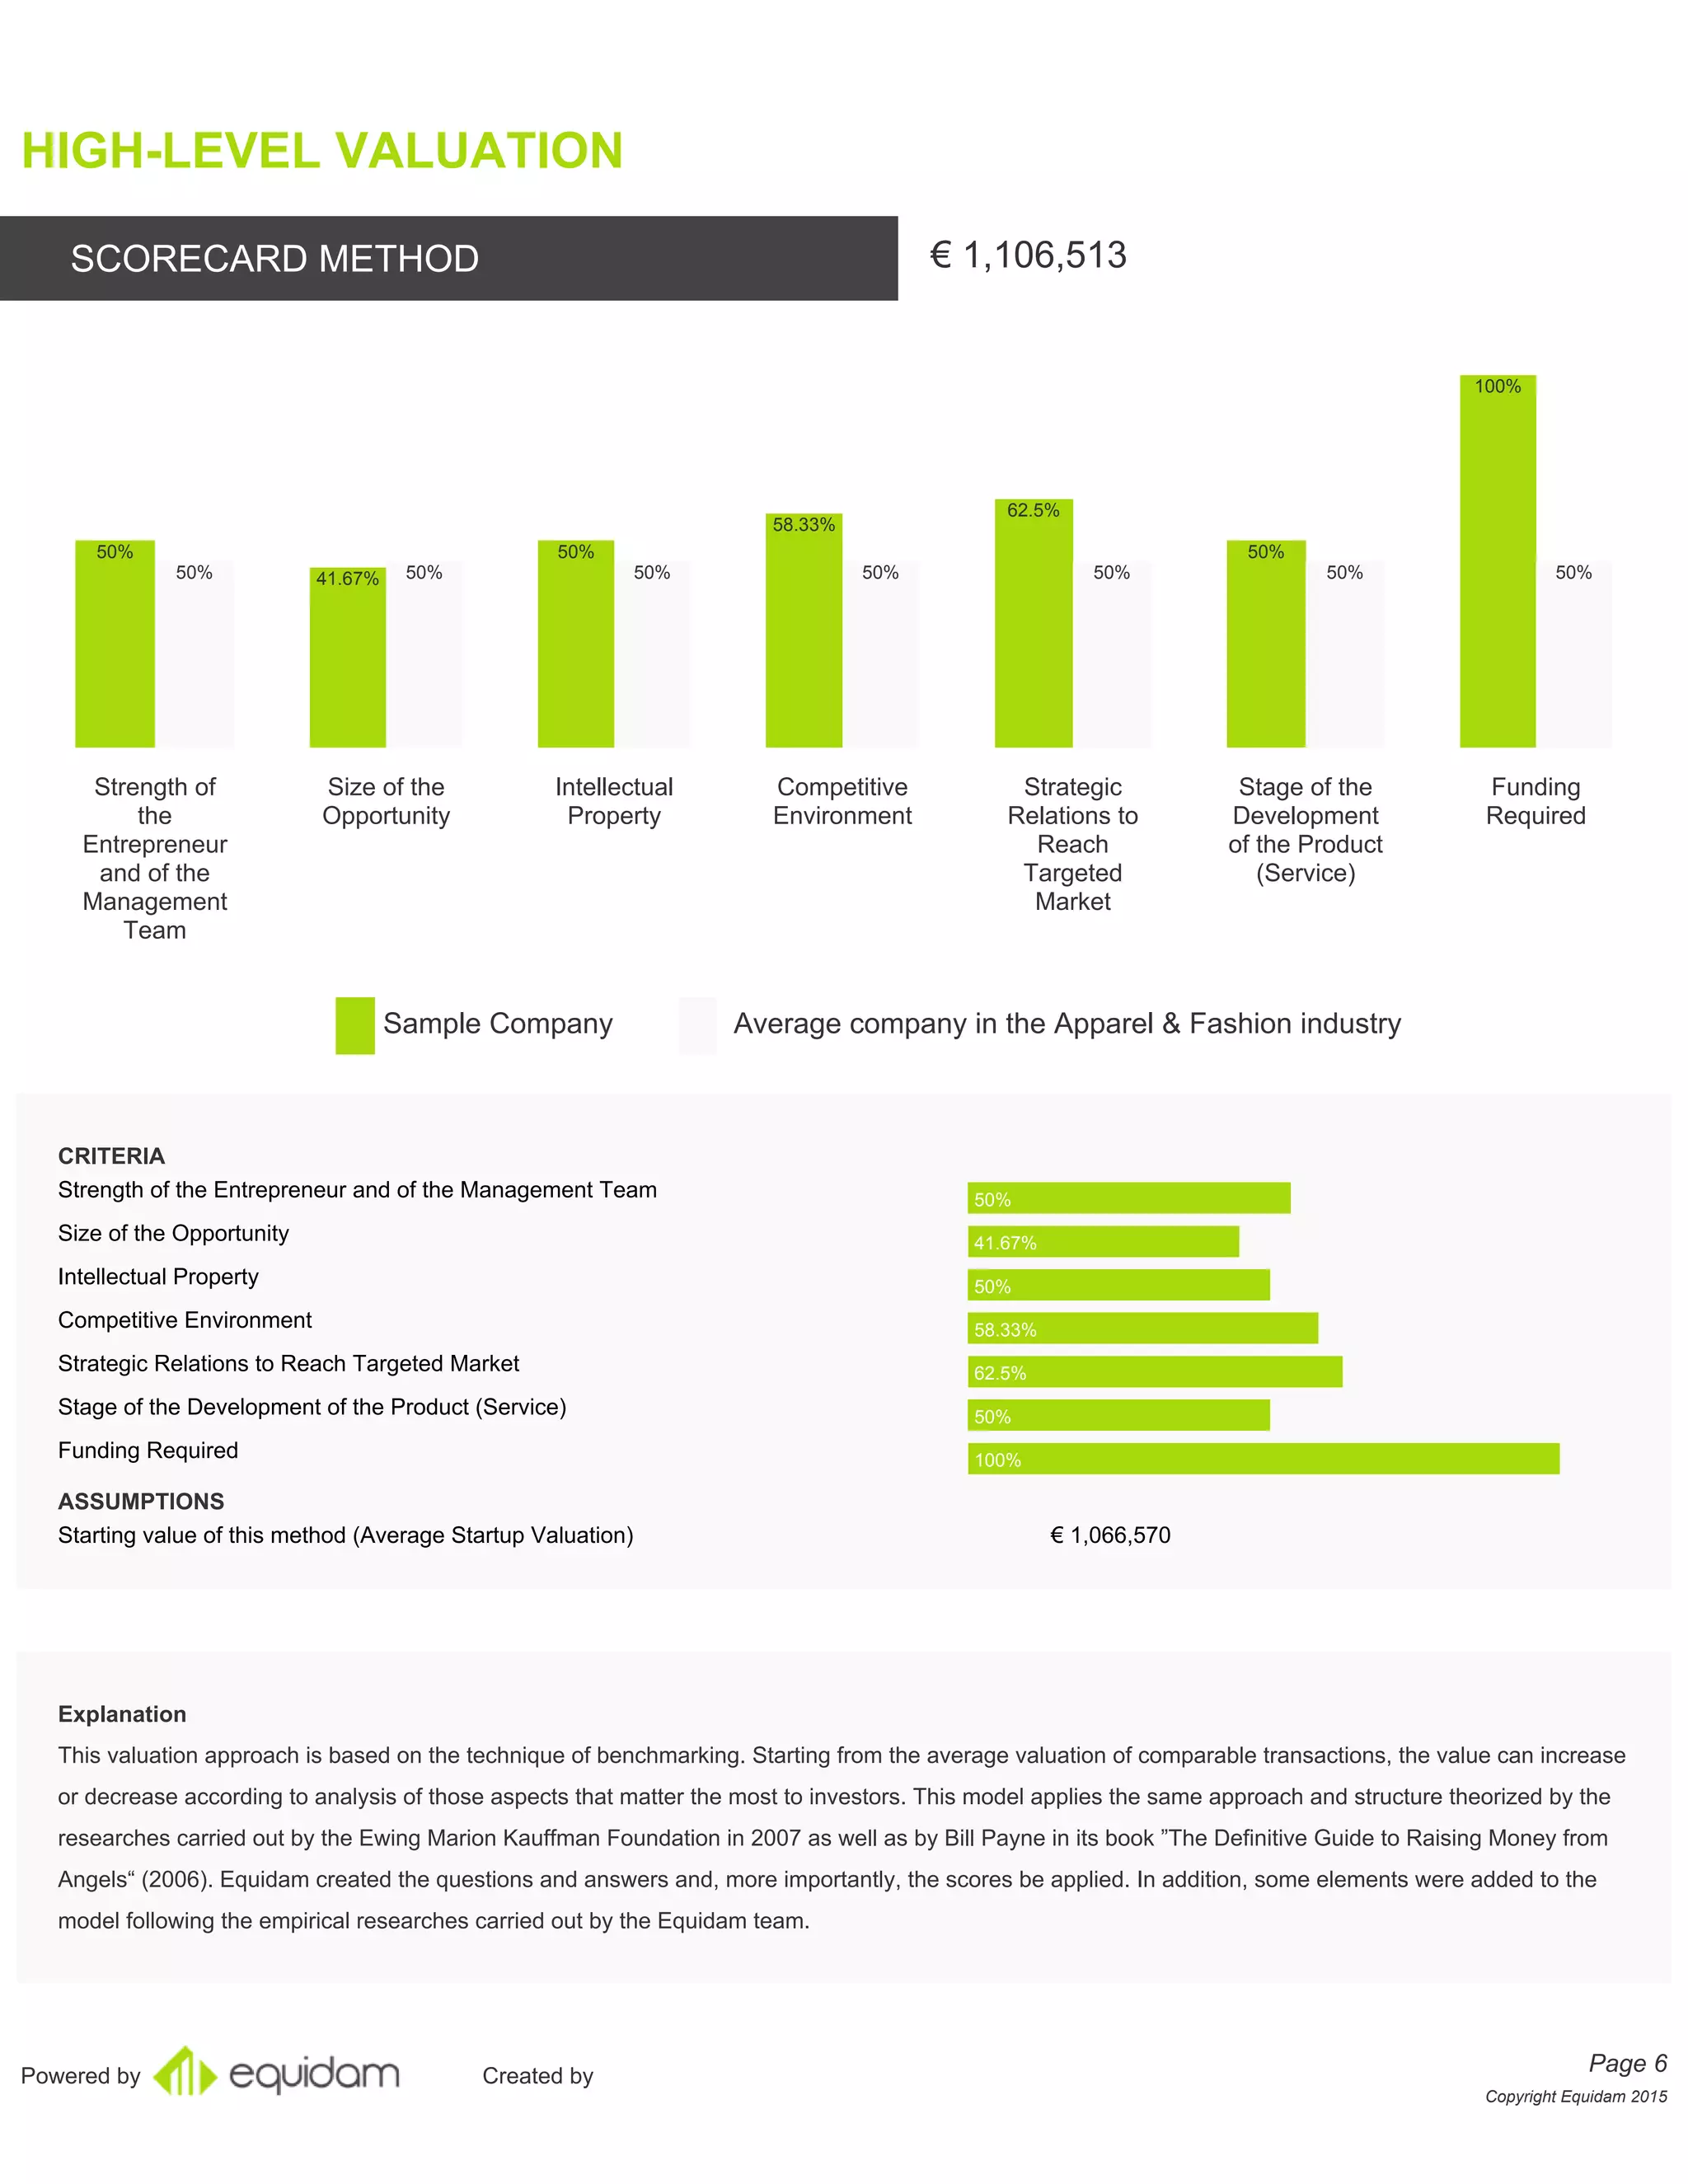
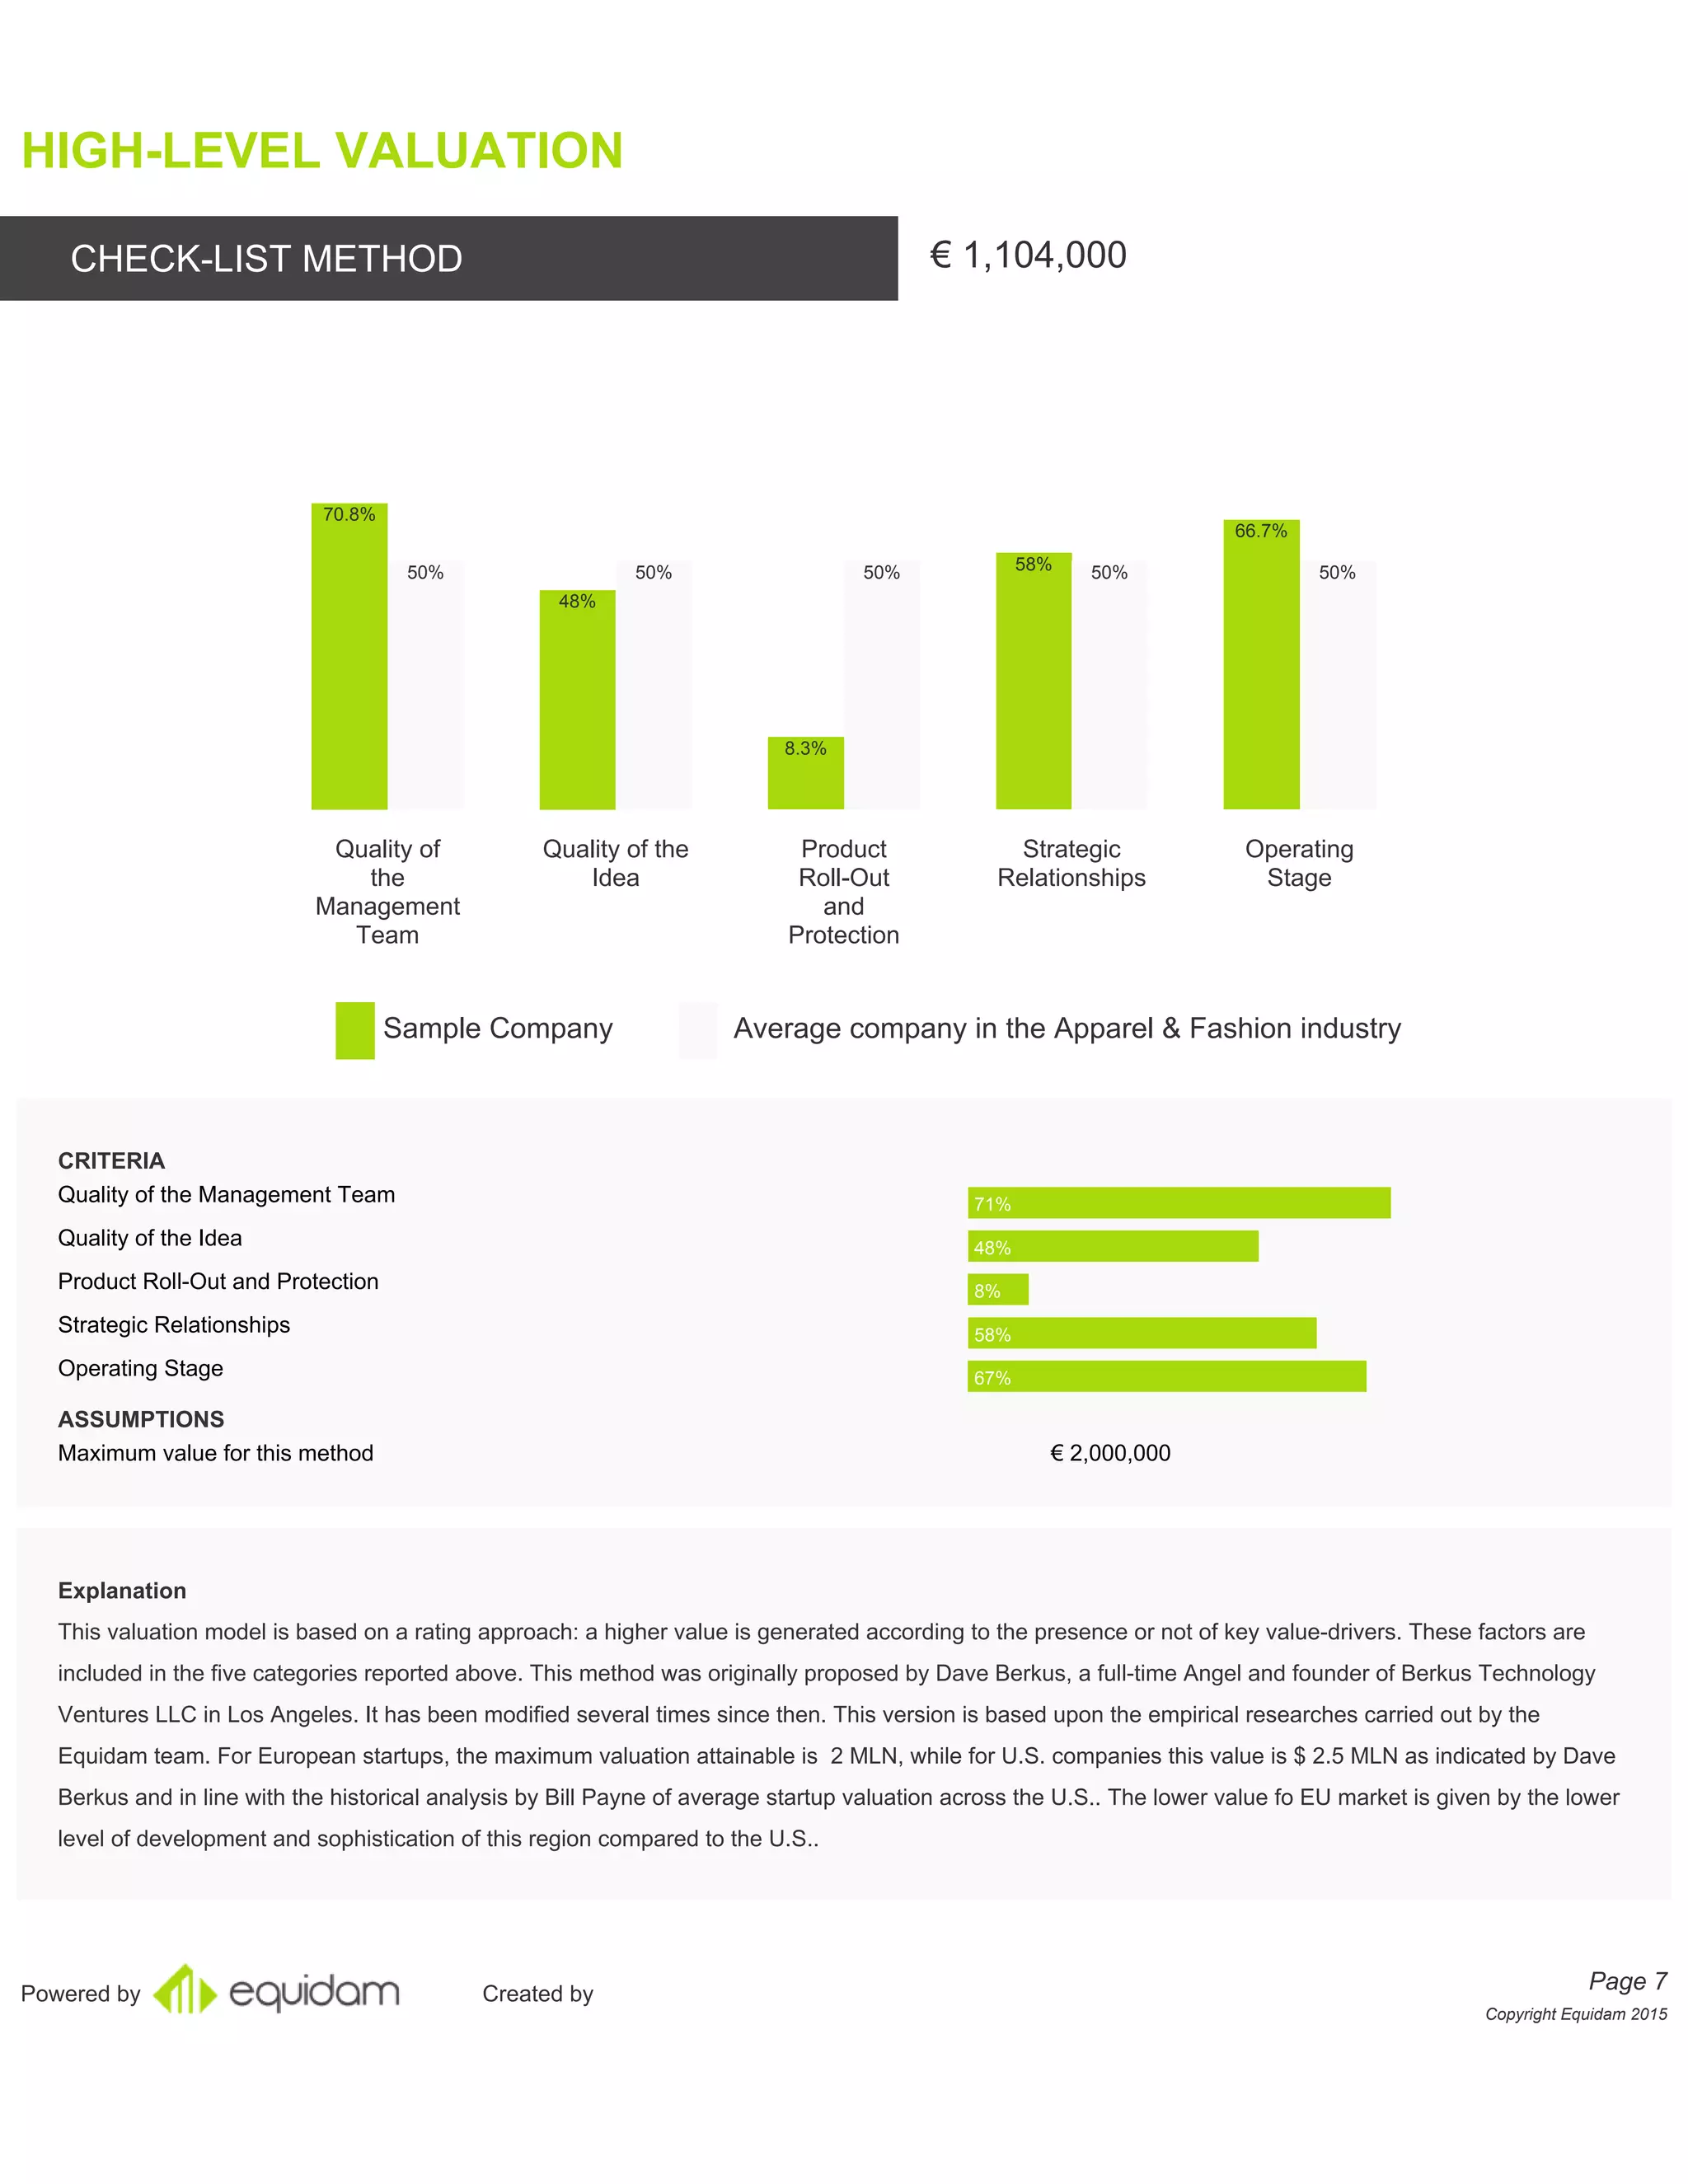


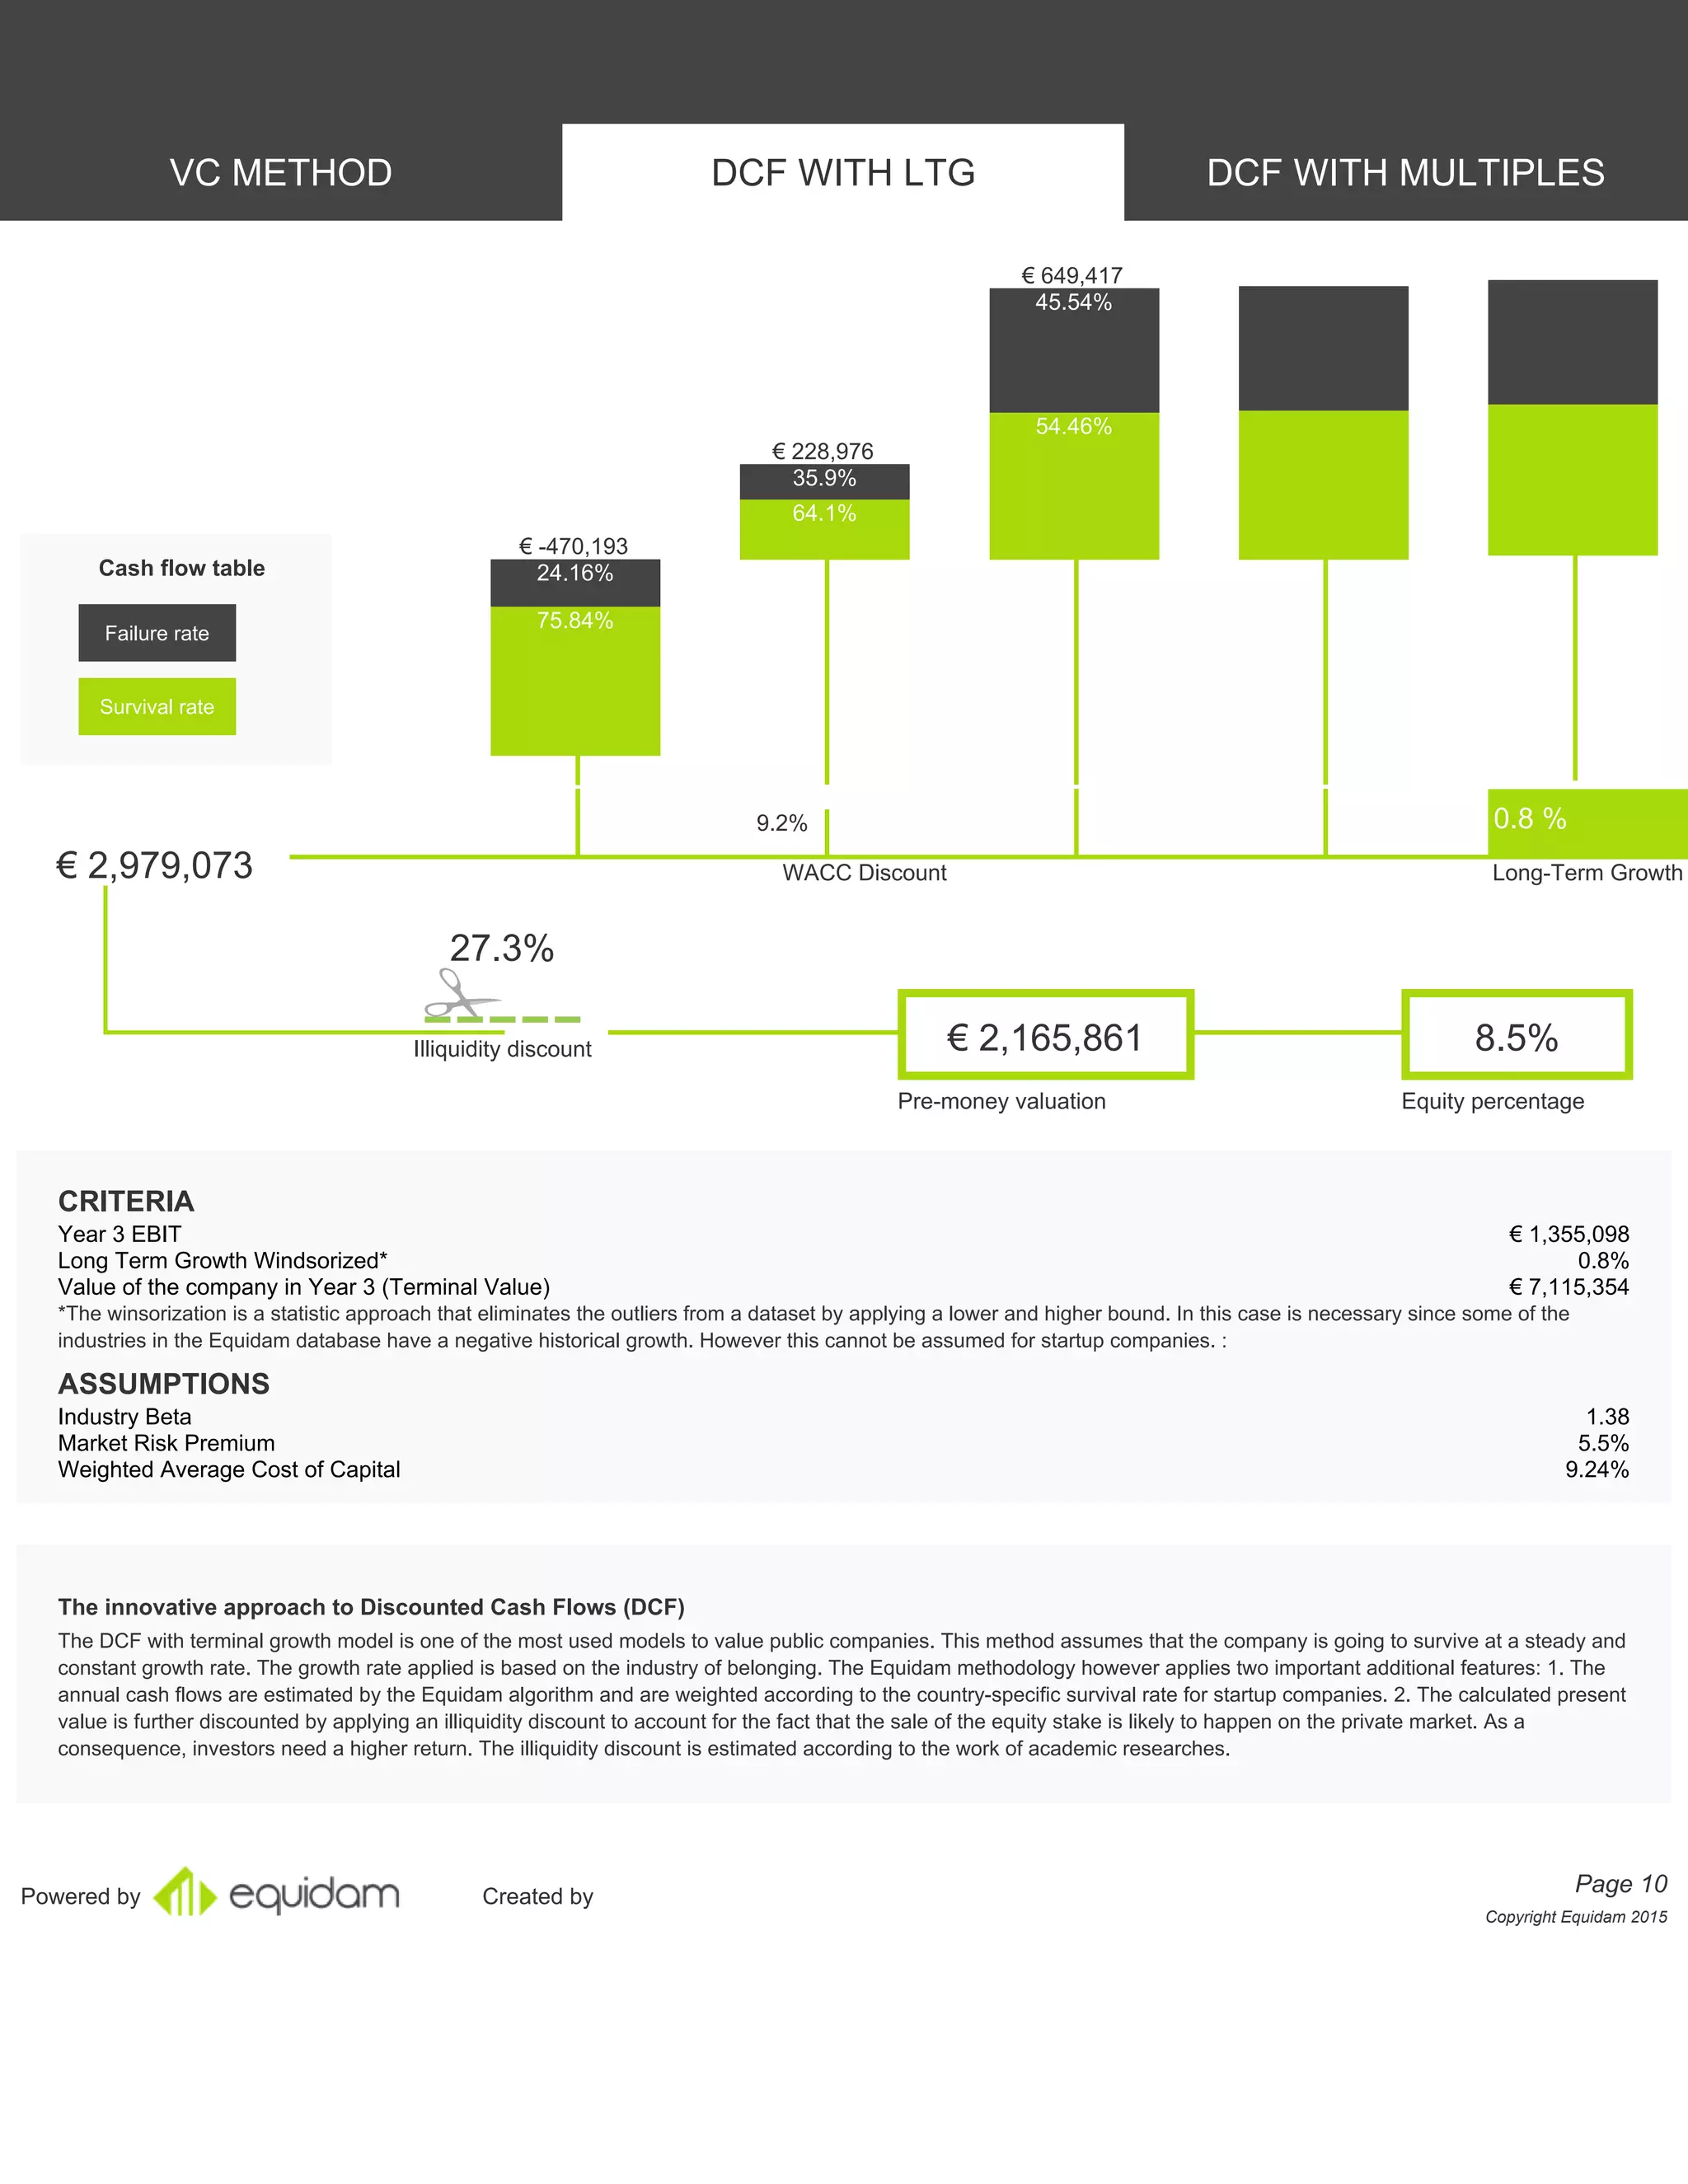


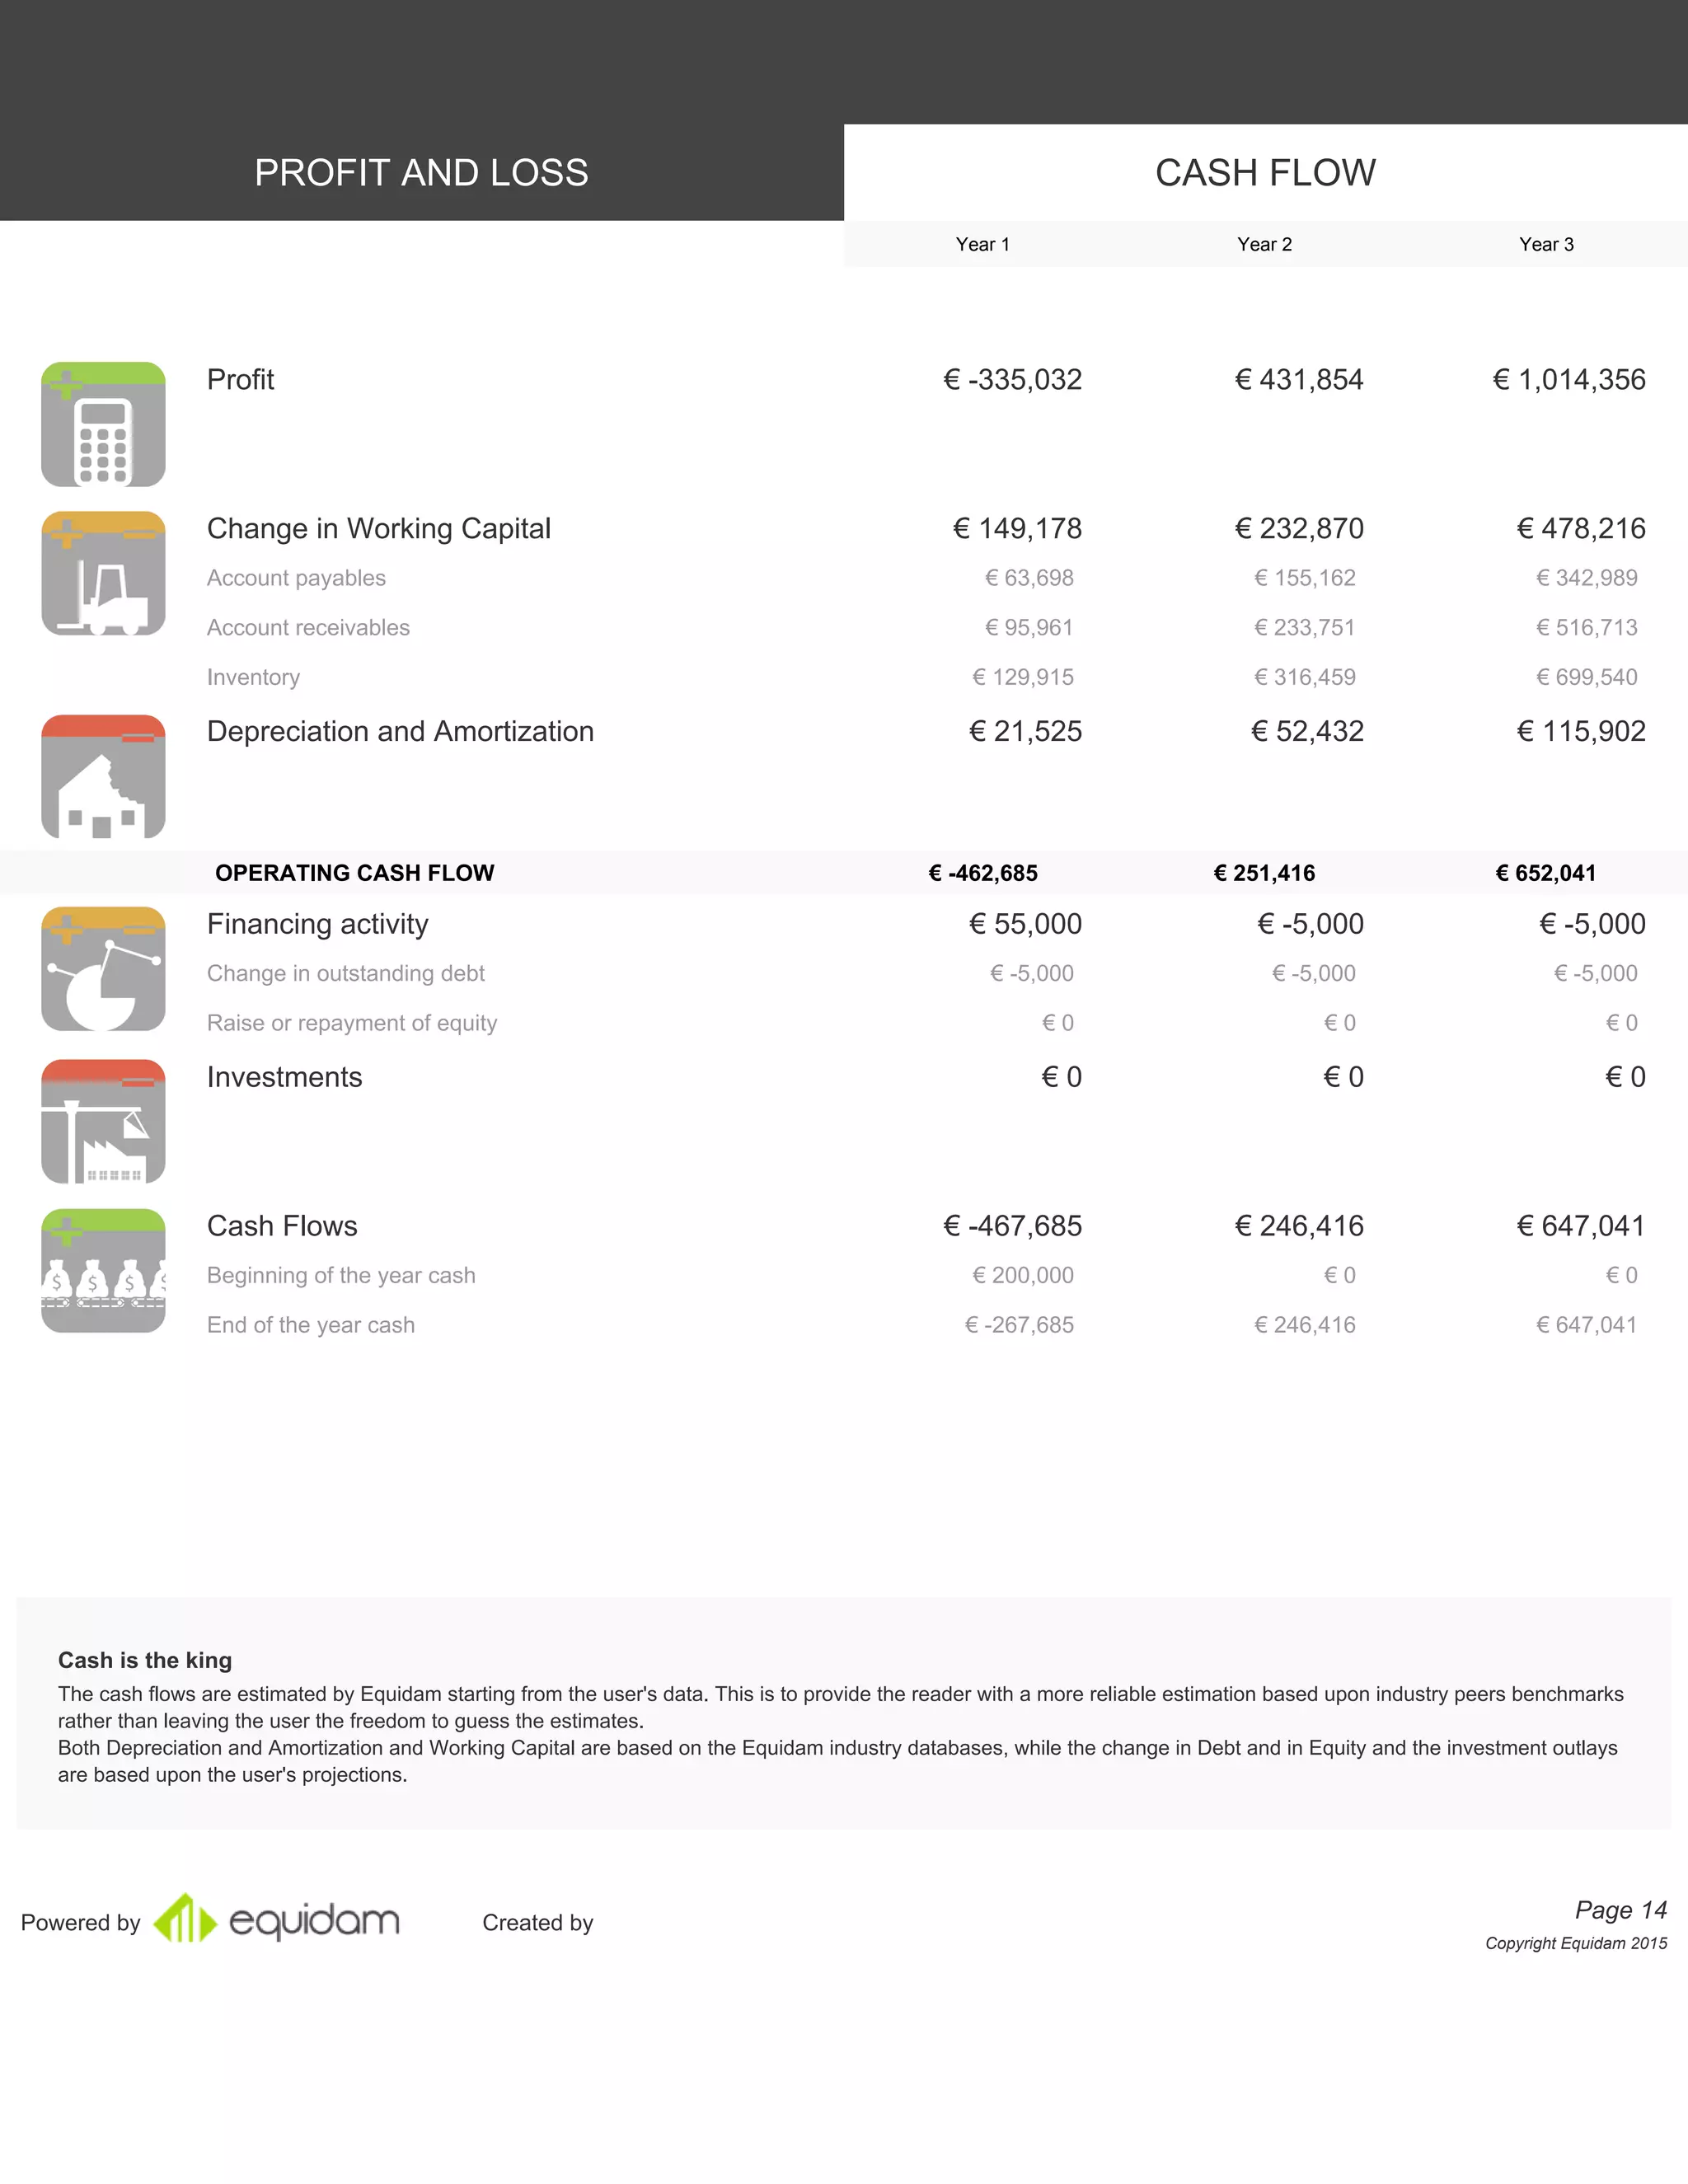
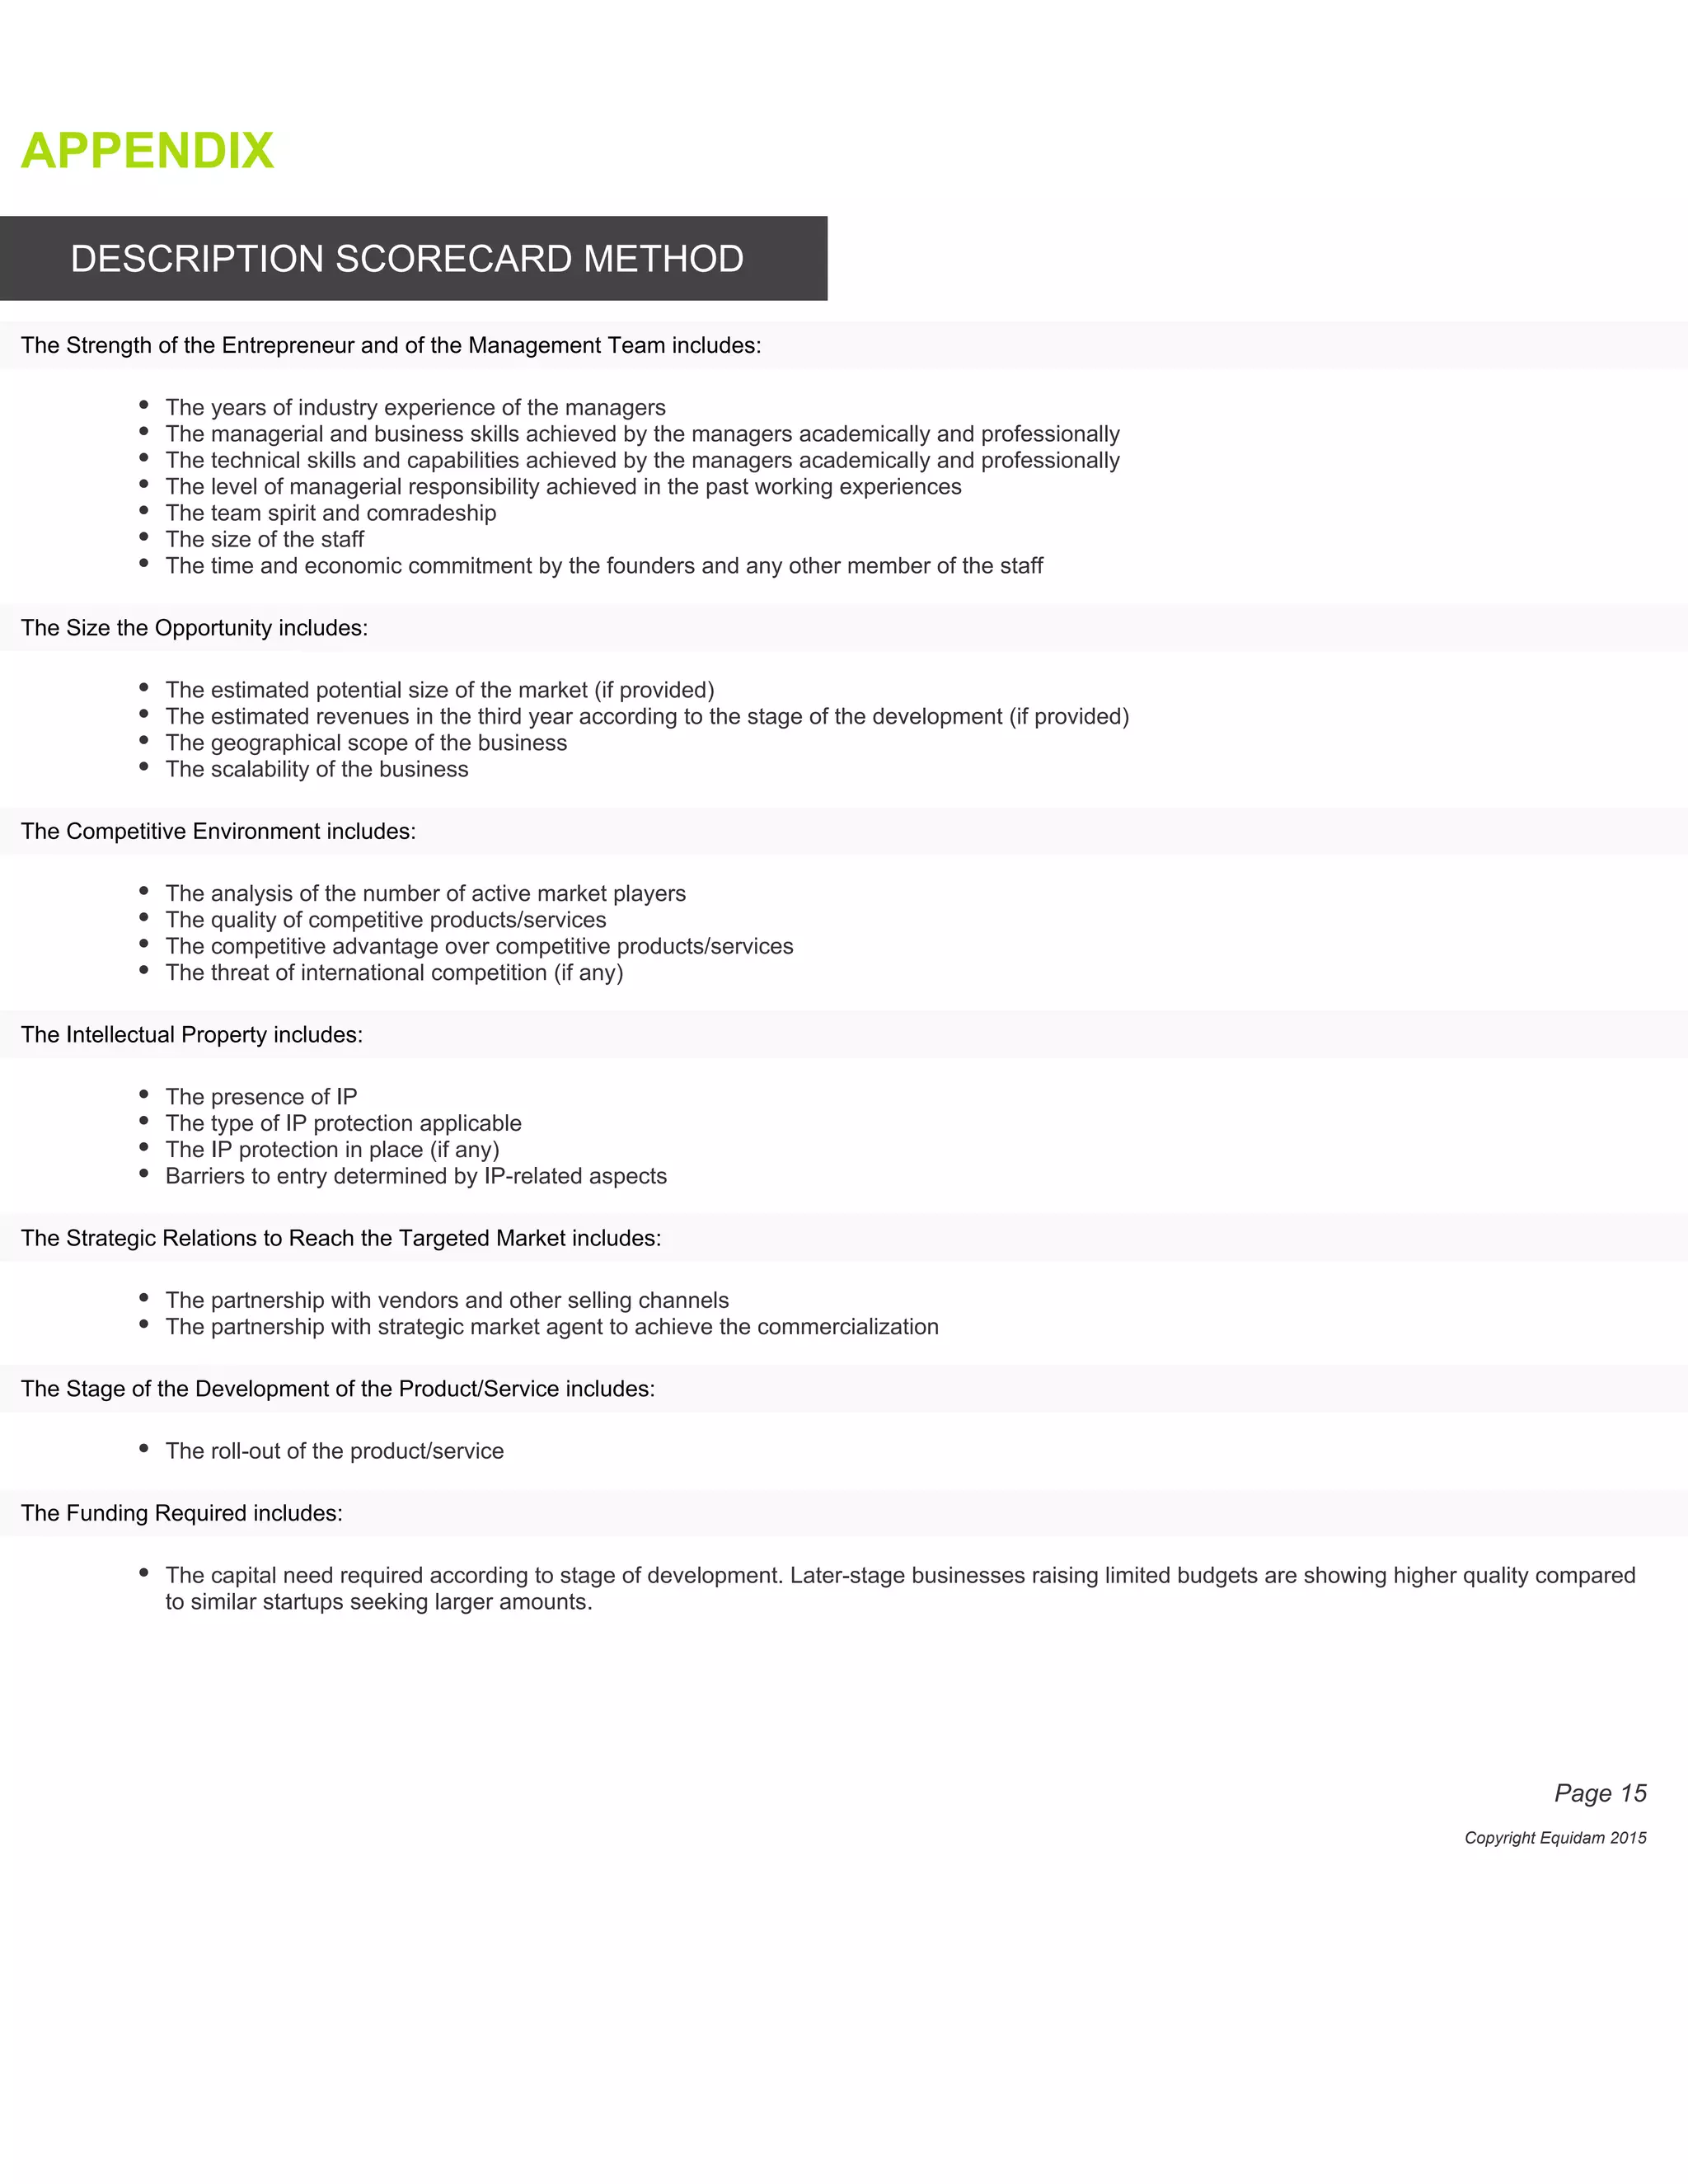


The document outlines a fictional business plan for 'sample company,' detailing its growth potential, legal structure, and financial projections. It highlights the startup's team experience, scalability, and market approach, while analyzing its valuation through multiple methodologies. Additionally, the forecast includes expected revenues and costs over three years, outlining a path to profitability despite initial losses.


![Valuation of Startups [with limitation of traditional valuation approach]](https://cdn.slidesharecdn.com/ss_thumbnails/valuationofstartups-article-190809102403-thumbnail.jpg?width=640&height=640&fit=bounds)


