Download as PDF, PPTX

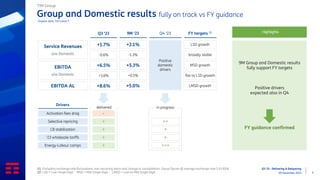
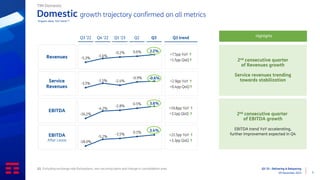
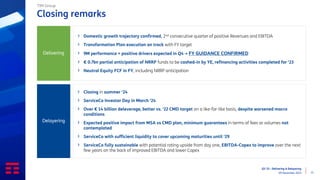


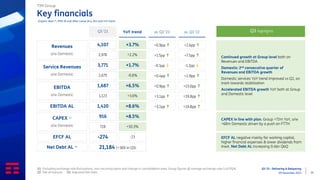
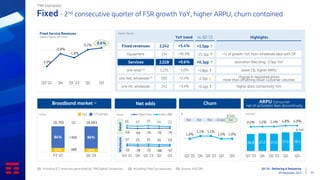
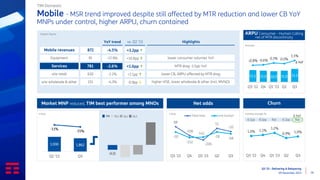
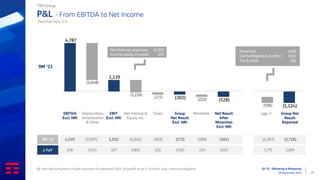
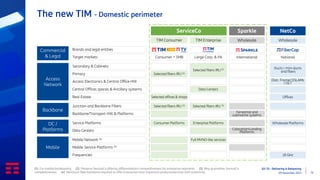
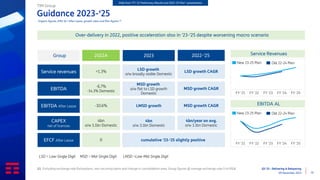


The document presents the financial results of the TIM Group for Q3 2023, indicating that the group is on track to meet its full-year guidance with domestic growth in service revenues and EBITDA. Key indicators show a stabilization and slight growth in several areas, alongside the continuation of a cost-saving transformation plan. Additionally, the report discusses performance metrics across various services and highlights significant achievements in revenue, operational efficiency, and digital transformation initiatives.


