Downloaded 15 times
![19
REFERENCES
LAN - Local Area Network (LAN). 2013. LAN - Local Area Network (LAN). [ONLINE]
Available at:http://compnetworking.about.com/cs/lanvlanwan/g/bldef_lan.htm. [Accessed 4
January 2013].
COMNET III. 2013. COMNET III. [ONLINE] Available
at:http://feamane.org/comms/testtools/comnet3/comnet3.html. [Accessed 4 January 2013].
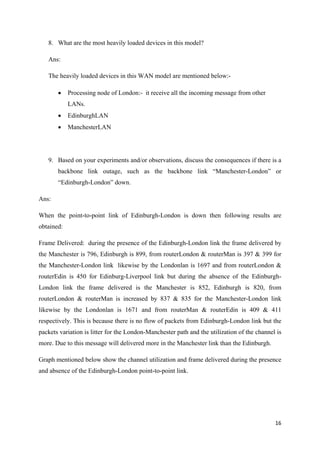
CSMA/CD. 2013. CSMA/CD. [ONLINE] Available
at:http://www.erg.abdn.ac.uk/~gorry/eg3561/lan-pages/csma-cd.html. [Accessed 6 January
2013].](https://image.slidesharecdn.com/comnetfinalreportbyanitthapaliya-150326022226-conversion-gate01/85/Communication-Network-Comnet-Report-20-320.jpg)


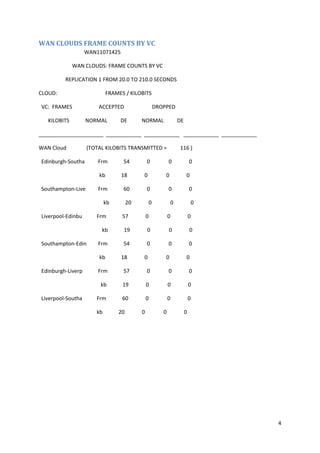
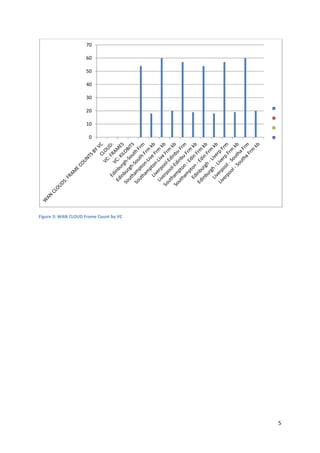
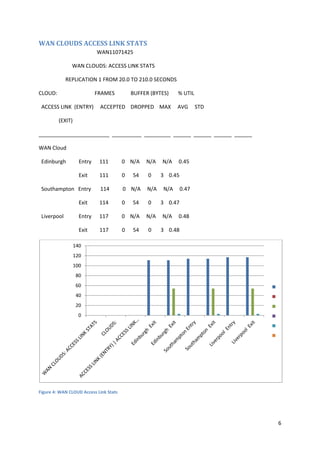
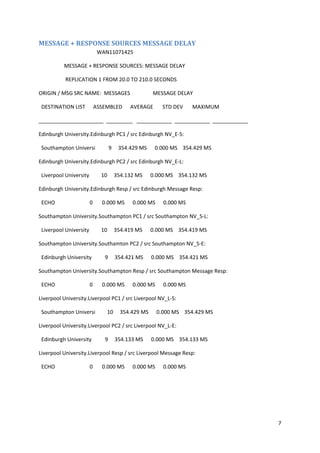
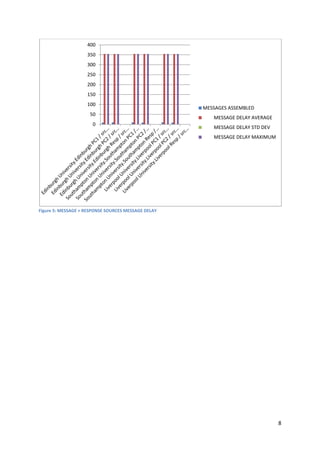
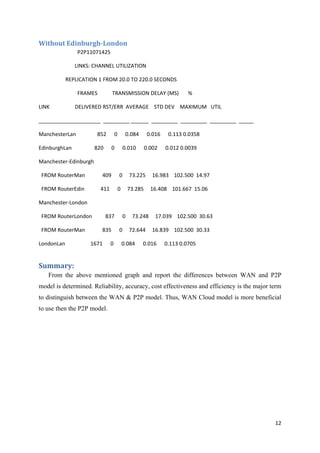
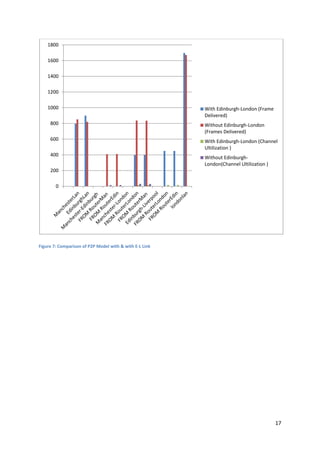
This document summarizes a technical report on a WAN network simulation model. The model includes three LANs - Manchester LAN, Edinburgh LAN, and London LAN - connected by point-to-point links with routers. Manchester LAN and London LAN use CSMA/CD, while Edinburgh LAN uses FDDI. Each LAN has a bandwidth of 4MB but the point-to-point links have a bandwidth of only 9.6kbps, creating a bottleneck. The routers are all Cisco 7010SP devices. Message sources in each LAN and a response source in London LAN use TP-ATM protocol to transmit packets.


![5G Explained! A High Level Overview [Introduction]](https://cdn.slidesharecdn.com/ss_thumbnails/5gexplainedahighleveloverview-260119165306-cc137a3e-thumbnail.jpg?width=640&height=640&fit=bounds)


