Download to read offline
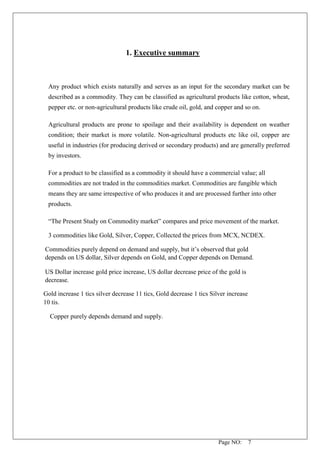

The document is a project report on 'Commodity Trading Analysis Technique for Gold' submitted for an MBA in Finance. It explores price movements of commodities like gold, silver, and copper, and how various factors such as the US dollar influence these markets. The study aims to analyze technical indicators for managing risks and making profitable investments in commodity trading.


