SlideShare a Scribd company logo
1 of 21
POMS 4050.201 Predictive Data Analytics
Dr. Asil Oztekin
Term Project Report
Due Date: 5/3/19
Joel Dabady, Mark Albee, Eric Rose
Identifying Key Factors in Winning MLB
Games Using a Data-Mining Approach
1
Abstract
Objective: Baseball is the pioneer sport for using advanced analytics to make strategies and to
scout and sign players. Winning is the ultimate end goal, and millions and millions of dollars is
put into Major League Baseball teams every year in order to win. This study aims to predict team
wins in the MLB using data mining techniques and basic team batting, pitching, and fielding
statistics. Specifically, we want to look at the predictor importance of each statistic so that we
can see which ones contribute most to winning games, and whether or not there is a notable
difference in the importance of batting vs pitching vs fielding. These results can help teams focus
on what is important when building a team, saving organizations millions of wasted dollars on
players and coaches who do not fit the key traits needed to win. The data used is from the 2009-
2018 seasons using statistics for every team for those years. Data mining techniques were used to
conduct the study, and four models, Artificial Neural Network, Support Vector Machines, Linear
Regression, and Automatic Linear Model, were run to obtain our results. The data was randomly
split up 70% training and 30% testing when running the models.
Key Words: Baseball, Analytics, Statistics, Wins, Data Mining
1. Introduction
Motivation
In professional team sports, the goal is simple: Maximize wins. The more games your
teams wins, the better chances they have at making the playoffs. Making the playoffs will do a
number of important positive things for professional sports teams, including raising their
popularity around the league they operate in. This team will also play more games than teams
that do not make the playoffs-meaning they will generate more ticket and stadium revenue as
well as increased apparel and accessories revenue. The benefits from maximizing your wins
every season are clear and tangible.
Baseball organizations have historically relied on human evaluation, or the eye test, when
building a team. Until recently, MLB organizations employed teams of scouts directed to use
their experience and intuition to evaluate talent. The 2011 film, Moneyball, depicted the 2002
2
Oakland Athletics utilizing data and statistical analytics methods to evaluate talent and build
their team. The success of that organization coupled with the popularity of the film, brought data
analytics in Major League Baseball to the mainstream. No longer are the days that teams spend
millions of dollars on players based solely on human evaluation. Teams are now able to
accurately assess the value of player outputs through the use of mathematical modeling.
This study uses four regression-based data-mining models to predict total wins, based
upon basic team batting, pitching and fielding stats. Utilizing a variable sensitivity analysis, we
can determine the statistics that contribute most to winning MLB games. Teams can use this
knowledge to sign free agents, make trades with other teams and draft players who produce the
statistics that undeniably add value to their team’s goal: winning.
Literature Review
Baseball is the pioneer sport for advanced analytics, starting in 1977 when Bill James
published the first edition of his annual book The Bill James Baseball Abstract. James has
created dozens of advanced statistics by using analytics, and these stats have been adopted by the
MLB and are used in team front offices today. The most famous of his statistics is the
Pythagorean Wins formula. This formula is used to predict wins based on how many runs scored
and how many runs allowed a team has. Additional research performed by Huemann (2016) [1]
looked to improve James’ formula by eliminating one of the major flaws. In every baseball
game, there is one winner and one loser, so over the course of a whole season, the total league
wins has to equal total league losses. James’ formula, however, does not create an equal league if
the Pythagorean records of every team is summed. This is because James looks at each
individual team alone, without consideration of the other teams, instead of each team in the
environment of other teams. Huemann’s formula creates a formula that takes the sum of a team’s
Pythagorean record against every other individual team. This new formula decreased the error of
Pythagorean wins vs actual wins when compared to James’ formula. Overall, no matter if using
James’ formula or the updated formula by Huemann, both of these formulas show the
importance of the statistics runs scored and runs allowed in order to win games.
Runs scored and runs allowed by teams prove to be key in winning MLB games, and a
study by Beneventano et al. (2012) [2] analyzes what impacts both of these variables the most.
Their research uses multiple regression analysis to examine the biggest predictor variables of
3
scoring runs and preventing runs using both simple and advanced statistics. The study found that
the biggest predictor for runs scored is the advanced statistic weighted on-base average (wOBA).
This statistic calculates the effectiveness of a player per at bat. For runs allowed, the most
important predictor is that statistic walks and hits per inning pitched (WHIP). This statistic is
simple, it is the sum of walks pitched and hits allowed divided by the total innings pitched. This
study gives a clearer picture of what goes into scoring and preventing runs.
Ng (2017) [3] performed a study that analyzes the effects of age and experience on
player’s performance. Ng’s study sought to find out when pitchers and batters peak in their
career, based on their Wins Above Replacement (WAR). This is an advanced statistic that
measures how much value a player brings compared to a replacement level player. A player with
a WAR value of 5.6 means that the player’s performance caused the team to win 5.6 more wins
than if a replacement level player played in his spot. Using WAR as the dependent variable, Ng’s
study found the peak age for hitters to be 29 years old and the peak age for pitchers to be 28
years old. Using this conclusion, the question can be raised about how much the average age of
players on a team affect the total wins the team has.
Before finding out that player age would be one of the lowest variables in determining
key factors in winning MLB games using data-mining we referenced, Understanding Career
Progression in Baseball Through Machine Learning, a study by Hollenbeck et al. (2017) [4]. The
goal of this study was to determine which potential MLB should the expensive contracts go to
and if age played a role in determine player performance. Data used in this study included first 6
season player career data dating back to the 70’s. Player value was measured in Wins Above
Replacement, a statistic that measures a player’s overall contribution to their team. The timeline
used for this measurement was 7-11 years. Tools used in this study included Ridge Model,
Neural Network, Tree Bagging Model, Support Vector Regression, and Hyperparameter
Optimization. Conclusions made in the study stated that long term contracts should go to batters
rather than pitchers. Another conclusion made was that 6 Season Cumulative Wins Above
Replacement and 6th Season Cumulative Wins Above Replacement are the best predictors for
late career MLB performance.
Before conducting the Identifying Key Factors in Winning MLB Games Using a Data-
Mining Approach Study another study that helped determine disparities in MLB Player
performance and their contracts. That study was Great Expectations: An Analysis of Major
4
League Baseball Free Agent Performance by Barnes et al. (2016) [5]. The goal of this study was
to see if MLB Free Agents met the expectations set in their contracts through value and duration
based on player performance to date, marketing potential, and future performance. A plethora of
regression and tree-based algorithms as well as a performance and a market model were used to
determine whether the expectations became a reality. The performance and market models could
actively be used to target and avoid MLB free agencies who had disparities in their performance-
based value vs. their market value. Conclusions that were made in this study were that the use of
both models individually provided data that some would consider to miss the mark, but the use
of both models together helped better the define the output as far as correlation between
performance value, market value, and price of contract.
Since Baseball is the most analytically studied sports, there have been many studies that
involve data mining that aim to predict outcomes. A study by Tolbert et al. (2016) [6] aimed to
predict the eventual AL, NL, and overall MLB champion using data mining techniques. This
studied used various batting, pitching, fielding stats, as well as WAR and team record. Though
not predicting wins, Tolbert et al. aimed to find the best team using these team statistics. The
study used different versions of SVM algorithms, and each model was between 57% and 69%
accurate. Also, the study looked to categorize each team as a either a league winner or loser, so
one problem Tolbert et al. had was that there were multiple teams that were categorized as
winners, even though there can only be one winner and the rest losers. Still, using these basic
statistics the models were able to predict the actual winning team in the AL as the winner in the
model, as well as the overall winner in the MLB championship. In the NL, the tests incorrectly
labeled the actual winning team as a loser, and a comment that Tolbert et al. made was that the
models predicted winner went against the traditional thinking of what makes a championship
caliber team.
As analytics interest grows in the MLB, so have the analytics departments for each
individual team. Chu et al. (2019) [7] conducted a study on the relationship between a team’s
analytic spending and staffing, and the team’s success in the regular season and postseason for
the MLB. The study aims to find out how much of an advantage, if any, analytic departments add
to a team. To start, Chu et al. used the data collected to place every team into either an analytics
believer category, or an analytics non-believer. Then, the effects of analytics were found using
correlation analysis, logistic regression, and linear regression models. The results showed that
5
analytics do have an effect in positive regular season results, as 48% of the teams who were
believers in analytics made it to the postseason, while just 16% of the non-believers made it.
However, the data gives no clear answer as to whether or no analytics helped a team in the
postseason. Chu et al believe that more data will be needed in order to identify a relationship
between analytics and postseason success.
To comprehensively analyze the stats datasets that were collected from baseball-
reference.com, Using Analytics To Challenge Conventional Baseball Wisdom, a study by Rees
et al. (2015) [8] was referenced. In this study, common baseball wisdom is examined through
multi-season simulation. Multiple MLB team profiles were created, and varying factors were
examined through the simulation of 10 seasons using varying configurations with different
teams. Conclusions that were made from this study included, batters that perform well with
runners in scoring have a greater influence in helping their team in scoring more runs than
powerful batters who underproduce similar results. A conclusion that the Identifying Key Factors
in Winning MLB Games Using a Data-Mining Approach Study came to be that higher
performing batters are less likely to influence how well a team performs according to other
similar underlying team factors.
Baseball Lineup Optimization by Schorsch et al. (2015) [9] is study that aimed to find the
best way to optimize MLB Team Lineups to maximize MLB Team Wins. Optimization of MLB
Team Lineups can account for two to three team wins per season. A Markov Chain based
simulation was to determine run expectancy of any given lineup . Then a Metropolis-Hastings
Algorithm was used to precisely sample from all potential lineups for any given team. The team
that the researchers chose to model was that of their own college, Swarthmore College. Results
concluded from this study were that optimal lineups overestimated the runs scored.
Predicting Win-Loss outcomes in MLB Regular Season Games - A Comparative Study
Using Data Mining Methods by Valero (2016) [10], employs the CRISP-DM method to assess
the accuracy of four data mining models when predicting game outcomes. The author of this
study utilized classification and regression-based predictive models, and found that the
classification scheme was a better predictor of game wins than regression. Of the four (SVM, K-
NN, ANN, DT) data-mining models, SVM’s performed the best with a prediction accuracy of
60%.
A study that helped further the knowledge on the output variable wins was Winner and
6
Loser Effects in Major League Baseball Doubleheaders by Gallup et al. (2014) [11]. The study
aimed to determine what factors go into the winning and losing patterns of Major League
Baseball Doubleheaders (two baseball games that are played between the same two teams on the
same day) by comparing archival MLB Data from 2002-2014 from ESPN on a single team
winning both games (sweeps) vs. each team winning one game (splits). A Binary Logistic
Regression was used in determining differences in season win totals between MLB Teams that
played in doubleheaders. This predicted the outcome of sweep vs. split. In addition Binomial
tests with probability set to .5 were used to determine the even distribution of sweeps, splits, and
home vs. away victors. Independent t-test were used in comparing victory margins between
doubleheader games that were swept vs. split. These test were adjusted when variances in
samples became unequal after using Levene’s Test. All stat analyses were performed using IBM
SPSS v.2.1 with α set to .05. The conclusions that were made from this study is sweeps are more
common than splits and that there is always a home team advantage doubleheaders are played.
According to openWAR: An open source system for evaluating overall player
performance in major league baseball by Baumer et al. (2016) [12] , one of the most challenging
aspects of talent evaluation is translating a player’s individual, statistical contributions into team
wins. This study took an extremely popular advanced Sabermetric, WAR (wins above
replacement), that usually relies on proprietary data and made it public. The authors utilized
public data, open and transparent algorithms and simulation based techniques to make their
findings easily understandable. The goal of their study was to simplify talent evaluation and
convey the findings in universally understood terms.
Evaluating talent is the by-product obtained from predicting team wins. Gerrard (2015)
[13], in The Role of Analytics in Assessing Playing Talent, discusses the role that analytics will
play in teams assessing talent and making decisions on acquiring talent. This study found that the
role of statistical analysis should be less than that of the human evaluation of player
performance.
The prediction of sports outcomes has many applications and possible benefits attached.
With the legalization of sports gambling, people are searching for ways to easily and effectively
predict the outcomes of sports games. The use of data mining for basketball matches outcomes
prediction by Miljkovic (2010) [14], identifies a system using data mining techniques that
predicts the outcomes of NBA games. The author utilizes data mining software and two seasons
7
worth of NBA game data to predict the outcomes of NBA games to a 67% accuracy rating.
Finding which factors contribute to winning baseball games helps managers understand
day to day decisions. The Contributing Factors to Winning in MLB by Pothula, S (2015) [15]
uses Ordinary Least Squares regression analysis to provide an understanding of what factors
contribute to a good lineup and defensive positioning. Their study concludes that Home Runs,
Walks, Strikeouts, Caught Stealing, Throwing Errors, Defensive Runs Saved, and a squared term
for Fielding Errors proved to be significant in explaining wins in MLB.
2. Methodology
Figure 1. The step by step methodology of this data mining process.
Data
For this study historical team data was taken from baseball-reference.com. These datasets
included team stats from 2009-2018 Major League Baseball seasons. Each season had a separate
batting, fielding, and pitching data set, so these datasets were merged into one large dataset for
each season. Then, each season was combined to create a final data set. In order to ensure the
most accurate data set, redundancies were searched for based on variables that derived from one
another. For example, On Base % (OBP) is derived from hits and walks, so OBP was taken out
and hits and walks were kept in the data set. After finding all of the redundancies that were found
from prior knowledge of Major League Baseball stats, a correlation analysis was performed to
further narrow down unbeknownst variables. Variables with a correlation of 66% or more were
8
further analyzed. If determined that the variables were correlated, but there was no causation
effect between the two, then the variables were kept. If the variables were correlated and they
seemed to derive from each other, they were deleted. After the data had been cleaned, it was
processed through IBM SPSS Modeler. A 70% - 30% training - testing split ensure that the
models have enough data to create successful outcomes with proper model development. The
data called for regression prediction models, and the models that were used are as follows:
Artificial Neural Networks
An Artificial Neural Network (ANN) model is used to determine pattern-recognition
through machine learning which in turn output a forecast/prediction of wins and predictor
importance based on the data set that is processed through it. ANN works by creating neurons in
hidden layers that derive from the layer before it. The beginning layer is the input variables and
the end layer is the output variable. The default settings of IBM SPSS’ ANN model were used to
run the data.
Support Vector Machines
The Support Vector Machines (SVM) model is a supervised learning model. SVM
models are one of the most popular models in data mining, and they are best used in either
classification or regression analysis. The default SVM settings were used in IBM SPSS to run the
data. No accuracy data was given as an output, so the SVM R squared data needed to be
calculated in Excel.
Linear Regression
Linear Regression is a model that seeks to find a linear relationship between the input
variables and the output variable. Linear Regression works best when the data has very few
outliers. The default settings were used in IBM SPSS, with the exception that predictor
importance needed to be selected.
Automatic Linear Model
Automatic Linear Model (ALM) is a new model introduced by IBM SPSS a few years
back. This model has been positively received because it has a larger focus on analyzing data
9
than regular linear regression. ALM gives numerous additional graphs and charts on the model
outputs that help to understand the rationale. In addition, ALM has automatic data preparation
steps, and these steps seek to “trim” data that the model finds to not be important. This leads to
the model having only a handful of variables that it uses to predict output. This is seen in the
Results and Discussion section. The default IBM SPSS settings were used for ALM.
Description of Variables
This study used 23 input variables, all of which were continuous. There was 1 output
variable, which was also continuous. All data came from the sports database Baseball-
Reference.com, and multiple data sets were combined to form the one used in the study. These
are basic MLB statistics that use very little, if any, calculations. Below is a description of each
variable.
a. Wins - Total games the team won during each individual season. (Output)
BATTING VARIABLES
b. BatAge - The average age of the batters for a team. This is weighted based on at bats and
games played by each individual player who took an at bat during the season. (Input)
c. R/G - Runs scored per game by each team over a full season. (Input)
d. H - Total number of hits by the team’s offense over the course of a season. (Input)
e. 2B - Total number of doubles hit by the team’s offense over the course of a season.
(Input)
f. 3B - Total number of triples hit by the team’s offense over the course of a season. (Input)
g. HR - Total number of home runs hit by the team’s offense over the course of a season.
(Input)
h. SB - Total number of stolen bases by a team’s offense over the course of a season. (Input)
i. CS - Total number of times a team’s offense has been caught trying to steal a base over
the course of a season. (Input)
j. BB - Total number of walks by a team’s offense over the course of a season. (Input)
k. SO - Total number of strikeouts the team’s offense had over the course of a season.
(Input)
10
l. GDP - Total number of instances where the offense grounded into a double play
throughout the season. (Input)
m. SAC - Total number of sacrifice hits a team’s offense had over the course of a season.
This is a different and independent variable than hits (H). (Input)
n. LOB - Total number of players who were left on base at the end of an inning over the
course of a season. (Input)
PITCHING VARIABLES
o. PAge - Average age of each pitcher that played for a team over the course of the season.
This is weighted by games started, games played, and saves. (Input)
p. RA/G - Number of runs per game a team allowed over the course of a season. (Input)
q. HA - Total number of hits allowed by pitchers over the course of a season. (Input)
r. HRA - Total number home runs allowed by pitchers over the course of a season. (Input)
s. BBA - Total number of walks allowed by pitchers over the course of a season. (Input)
t. SOA - Total number of strikeouts thrown by pitchers over the course of a season. (Input)
u. LOBA - Total number of opposing base runners that have been left on base at the end of
an inning by pitchers over the course of a season. (Input)
FIELDING VARIABLES
v. DefEff - The defensive efficiency of a team during the course of a season. This is the
percentage of balls in play that were converted into outs. (Input)
w. DP - Total number of double plays converted by the defense over the course of a season.
(Input)
x. Fld% - Fielding percentage of a defense during the course of a season. This is the
percentage of outs made that were not errors. (Input)
3. Results & Discussion
There are two main results from the data that the models provide. First, the accuracy of
11
each model is found by comparing the actual team wins versus the predicted wins. Second, the
predictor importance of each input variables provide the information of what is the most
important factor in winning games. The predictor importance of each model is provided by IBM
SPSS Modeler.
Figure 2: The measures of accuracy of the 4 models.
Figure 2 shows the measures of accuracy for each model that was run. The Artificial
Neural Network model is the most accurate, with the R squared accuracy of 88.6%. Each model,
however, is successful in creating accurate data, as the accuracies are all above 85%. The mean
absolute deviation (MAD) is the average absolute value of the difference between predicted wins
and actual wins. The Automatic Linear Model has the lowest MAD, as the predictions are 3.177
wins off from the actual value. This means that the average predicted wins value is +/- 3.177
wins off of the actual value. The Support Vector Machine model is the least successful in all
measures of accuracy, however it is only slightly worse than the other models, so the data is still
useful.
12
Figure 3: Random selection of testing results that shows each model’s wins compared to the
actual team wins.
Figure 3 is a random selection of 18 results from the testing data. These results show how
the models compute on a case by case basis. Each model values the input variable differently, so
the predicted wins are based off of how the models value the inputs. The models do show to have
mostly similar thinking to each other when compared to the actual wins. For example, in the top
result of 108 actual wins, all the models predict lower wins than what actually happen, with the
predicted value between 99-101. This can mean that the team who had 108 wins over performed
expectations, as their statistics say they should have won somewhere around 100 games. 108
wins is extremely good for a MLB team, so it is not surprising to see that the team needed to
over perform expectations to get to that number.
Overall, the accuracy results of each model show that the conclusions made can be
meaningful, as each model provides accurate insight into predicting wins. The results also give
confidence to the predictor importance of each model.
13
Figure 4: The predictor importance of each variable sorted by most important at the top and
least important at the bottom.
The predictor importance of each model is shown above in Figure 4. A weighted average
based on the R squared accuracy of each model was used to order the variables by importance.
The results show that RA/G (runs allowed per game) is the most important variable in predicting
team wins. R/G (runs scored per game) is the second most important variable. These two
variables being at the top of the list is not surprising, and it was expected going into the study.
However, it was not known if scoring runs or preventing runs is more important to winning, so
the predictor importance gives a clear answer. The Automatic Linear Model has RA/G as 73%
importance to winning, and this is due to the trimming process of variables that occurs while
running the model. The ALM raises the weighted importance of RA/G significantly, however if
ALM is taken out, RA/G is still the top variable but by a smaller margin. The ALM also shows
14
just how important RA/G and R/G are in predicting wins, as ALM has an accuracy of 87.7% and
the model is predicting wins by using almost exclusively RA/G and R/G. Linear Regression and
SVM both have R/G as the top variable, but these two models have the lowest in accuracy of all
the models. The two most accurate models, ANN and ALM, each have RA/G as the top variable,
and by a significant amount.
Some other variables to note in the predictor importance is DefEff (defensive efficiency)
and Fld% (fielding percentage). These two variables are measures of defense, and DefEff is the
3rd most important variable while Fld% is at the bottom. Also, BatAge (average batter’s age) is
at the bottom of the list while PAge (average pitcher’s age) is near the top, showing that age is
important for pitching, but not for batting.
Deeper discussion of what these results mean can be found in the Managerial
Implications section.
4. Managerial Implications
Predicting wins for MLB teams allows managers to understand which statistics contribute
most to winning games. As previously stated, winning games translates to more revenue for
teams through increased popularity and fan base interaction, greater apparel and team accessory
purchases and a higher number of ticket sales if the team makes the playoffs.
The findings of this study indicate where and how a team should invest to maximize their
wins. The research found that preventing opponents from scoring runs every game (RA/G input
variable) is almost twice as important as scoring runs every game (R/G input variable). This
finding coupled with Defensive Efficiency ranking 3rd on the predictor importance rating,
indicates that teams must place a much higher emphasis on Defensive and Pitching stats opposed
to Batting. Basically, the results say it is more important to prevent runs than it is to score runs.
Teams that properly invest in these statistical categories are advantageous over those who do not.
Conventional Baseball knowledge associates a negative connotation with striking out,
and positive for Home Runs. Players who typically hit a lot of Home Runs often also strike out
quite a lot. This leads MLB teams to stay away from players who hit a lot of Home Runs, strike
out often and do not contribute in many other statistical categories. These types of players who
“swing for the fences” are found to be extremely valuable in this study. Home Runs were found
15
to be almost twice as important as Strikeouts, ranking 4th for predictor importance in terms of
winning games. Overall, home runs have a major influence on winning while strikeouts have
very small correlation no matter if there is a large or small amount of them. A theory for why this
is, is because strikeouts leave no damage to the players on base. A ground ball to second base
however, may result in a double play, proving to be much more costly than a strikeout. Teams
may be able to find these types of players for a cheaper price as the market typically devalues
them due to misinformation.
Player speed is something teams are generally willing to pay for. Carl Crawford, a player
well-known for his speed and ability to steal bases, signed a 7-year $142 million dollar contract
with the Boston Red Sox in 2011 [16]. Two years after the Red Sox acquired him, he was traded
to the Los Angeles Dodgers. The Red Sox realized that his statistics, while flashy, were not
valuable to winning games. They wasted millions of dollars to bring in a player who would
ultimately be traded. This study through the employment of basic data analytics, found the Stolen
Bases statistic to be of little to no importance in winning baseball games-as did the Boston Red
Sox through trial and error that cost them millions of dollars.
Finally, out of the two fielding statistics, DefEff was found to be a more accurate
predictor of wins than Fld%. This means that when teams evaluate defenses, they should be
using the Defensive Efficiency statistic, as this will give them a better idea of how much they
need to improve on defense.
5. Concluding Remarks and Further Research
The real important findings of this study is based in the predictor importance. The
accuracy of the models show that there is meaning in the predictor importance. Baseball is an
analytically driven league, and a big reason why is because it is a simple game. Every play is
based on one pitcher vs one batter. The simplicity allows for math to be able to take over to find
trends that they naked eye cannot see. This study found that RA/G is the most important statistic
to winning games. The average observer may be surprised by this, as offense is where the flash
and glory of baseball is often found. But the backbone of a good team is found in the pitching
and defense.
Further research that can be studied would be to look at advanced stats and see how they
16
impact winning. Some variables that could be used would be the average velocity of pitches for a
team, or the percentage of pitches thrown that are fastballs, curveballs, sliders, etc. In addition,
we could look at the sum of WAR for all the players on the team, or the average exit velocity
coming off of the bat. Categorical variables could also be used as a way to study baseball.
Examples of possible variables could be field size, if the team made the playoffs the previous
year, or if the team made a major off-season acquisition.
In addition, this type of analysis can be explored in other sports. The process is relatively
simple, and almost every sport is heavy into statistics. So if enough continuous variables are
available for a data set, then a study can be done on how important each variable is to winning.
Also, instead of having the full team stats, rankings of teams based on stats could be used. For
example, a team with the most hits in a season would have a value of 1, while the worst team
would have a value of 30.
17
References
[1] Heumann, Jay., (2016). An Improvement to the Baseball Statistic “Pythagorean Wins”.
Journal of Sports Analytics, 2. 49-59. Retrieved from
https://content.iospress.com/articles/journal-of-sports-analytics/jsa0018
[2] Beneventano, Philip., Berger, Paul. D., Weinburg, Bruce. D. (2012). Predicting Run
Production and Run Prevention in Baseball: The Impact of Sabermetrics. International Journal
of Business, Humanities and Technology, 2(4). Retrieved from
http://www.ijbhtnet.com/journals/Vol_2_No_4_June_2012/7.pdf
[3] Ng, K. (2017). Analyzing Major League Baseball Player’s Performance Based On Age
and Experience. Journal of Sports Economics & Management, 7(2). 78-100. Retrieved from
http://sportsem.uv.es/j_sports_and_em/index.php/JSEM/article/view/66
[4] Hollenbeck, J., Bierig, B., & Stroud, A. (2017). Arxiv. Understanding Career
Progression in Baseball Through MachineLearning, 1-5. Retrieved from
https://arxiv.org/abs/1712.05754.
[5] Barnes, S. L., & Bjarnadóttir, M. V. (2016). Great Expectations: An Analysis of Major
League Baseball Free Agent Performance. Statistical Analysis and Data Mining: The ASA Data
Science Journal, 9(5), special issue, 1-15. Retrieved from
https://onlinelibrary.wiley.com/doi/epdf/10.1002/sam.11311.
[6] Tolbert, Brandon., & Trafalis, Theodore. (2016). Predicting Major League Baseball
Championship Winners Through Data Mining. Athens Journal of Sports, 3(4). 239-252.
Retrieved from https://www.athensjournals.gr/sports/2016-3-4-1-Tolbert.pdf
[7] Chu, David. P., Wang, Cheng. W. (2019). Empirical Study On Relationship Between
Sports Analytics And Success In Regular Season And Postseason In Major League Baseball.
18
Journal of Sports Analytics. Retrieved from. https://content.iospress.com/articles/journal-of-
sports-analytics/jsa190269
[8] Rees, Paul, L., Rakes, T. R., & Deane, J. K. (2015). Using Analytics To Challenge
Conventional Baseball Wisdom. Journal of Service Science, 8(1), 1-10. Retrieved from
https://clutejournals.com/index.php/JSS/article/view/9493/9588.
[9] Schorsch, E., & Valera, A. (2015). Baseball Lineup Optimization. Swarthmore College
Department of Computer Science, 1-4. Retrieved from
https://www.researchgate.net/profile/Emanuel_Schorsch/publication/328529782_Baseball_Lineu
p_Optimization/links/5bd2a90b4585150b2b877139/Baseball-Lineup-Optimization.pdf.
[10] Valero, CS. (2016). Predicting Win-Loss outcomes in MLB Regular Season Games - A
Comparative Study Using Data Mining Methods. International Journal of Computer Science in
Sport, 15(2), 91-112. Retrieved from
https://www.degruyter.com/downloadpdf/j/ijcss.2016.15.issue-2/ijcss-2016-0007/ijcss-2016-
0007.pdf
[11] Gallup, A. C., & Eldakar, O. T. (2014). Winner and Loser Effects in Major League
Baseball Double Headers. Nova Southeastern University NSU Works, 1-11.
https://nsuworks.nova.edu/cgi/viewcontent.cgi?referer=https://scholar.google.com/&httpsredir=1
&article=1292&context=cnso_bio_facarticles/
[12] Baumer, B., Jensen, S. & Matthews, G. (2015). openWAR: An open source system for
evaluating overall player performance in major league baseball. Journal of Quantitative Analysis
in Sports, 11(2), 69-84. Retrieved from
https://www.degruyter.com/downloadpdf/j/jqas.2015.11.issue-2/jqas-2014-0098/jqas-2014-
0098.pdf
19
[13] Gerrard, B. (2015). The Role of Analytics in Assessing Playing Talent. The Handbook of
Talent Identification and Development in Sport. Retrieved from
http://eprints.whiterose.ac.uk/98808/3/Book%2520Chapter%2520Role%2520of%2520Analytics
%2520in%2520Assessing%2520Playing%2520Talent%2520%28Final%2520Feb%25202016%2
9%5B1%5D.pdf
[14] Miljkovic, D. Gajić, L. Kovačević, A. Konjović, Z. (2010). The use of data mining for
basketball matches outcomes prediction. International Symposium on Intelligent Systems and
Informatics, 8. Retrieved From
https://ieeexplore.ieee.org/abstract/document/5647440
[15] Pothula, S. (2015). The Contributing Factors to Winning in MLB. Retrieved from
https://www.researchgate.net/profile/Sanjay_Pothula/publication/276026339_The_Contributing_
Factors_to_Winning_in_Baseball/links/554e361308ae93634ec7011c.pdf
[16] 2019. Carl Crawford Career Earnings. Retrieved from https://www.spotrac.com/mlb/los-
angeles-dodgers/carl-crawford-849/cash-earnings/
20
About the Authors
Eric Rose graduated from Chelmsford High School,
alongside co-author Mark Albee, in 2014. He then went on
to study Computer Engineering at the University of
Massachusetts, Lowell. After a year, Eric switched majors
to Business Administration with a concentration in Analytics
and Operations management. He plans on graduating this
May, and is actively applying to jobs in this field. In his free
time Eric enjoys playing sports, relaxing with friends and
family and reading.
To Contact – linkedin.com/in/eric-rose-098a65165 or
eric_rose@student.uml.edu
Mark Albee is a Finance major and Math minor who will be
graduating from UMASS Lowell in 2019. He is from
Chelmsford MA, and graduated from Chelmsford High
School in 2014. His interests outside of school include
sports, which is the primary reason why this topic was
chosen. He formally was an employee of Polartec LLC as a
Manufacturing Engineering Intern, and also at Axis
Communications in the Finance and Operations department
as an intern. After graduation Mark hopes to find a job in the
quantitative side of Finance.
To contact – linkedin.com/in/markalbee/ or
markalbee10@gmail.com
Joel Dabady graduated from Xaverian Bros. Highschool. Joel is
currently pursuing a Business Administration Degree in
Management Information Systems and Analytics and
Operations Management with a minor Studio. Joel will be
graduating UMass Lowell in the Spring of 2019. Joel has
interests that envelop everything under the sun. His interests
include information technology, analytics, finance, film scoring,
music production, rowing, and art to name a few. What Joel is
most interested in overall is to have fun in life!
To Contact – linkedin.com/in/joel-7 or
Joel.Dabady@gmail.com

More Related Content

Similar to Predicting MLB Wins Using Data Mining

Sports Analytics: Market Shares, Strategy, and Forecasts, Worldwide, 2015 to ...
Sports Analytics: Market Shares, Strategy, and Forecasts, Worldwide, 2015 to ...Sports Analytics: Market Shares, Strategy, and Forecasts, Worldwide, 2015 to ...
Sports Analytics: Market Shares, Strategy, and Forecasts, Worldwide, 2015 to ...Shrikant Mandlik
 
SSRN-id2816685
SSRN-id2816685SSRN-id2816685
SSRN-id2816685Dean Dagan
 
Multi Criteria Selection of All-Star Pitching Staff
Multi Criteria Selection of All-Star Pitching StaffMulti Criteria Selection of All-Star Pitching Staff
Multi Criteria Selection of All-Star Pitching StaffAustin Lambert
 
Senior Project Research Paper
Senior Project Research PaperSenior Project Research Paper
Senior Project Research Papercrissy498
 
Measuring Team Chemistry in MLB
Measuring Team Chemistry in MLBMeasuring Team Chemistry in MLB
Measuring Team Chemistry in MLBDavid Kelly
 
Machine Learning Project
Machine Learning ProjectMachine Learning Project
Machine Learning ProjectAbhinitKothari
 
Data warehouse Soccer Project
Data warehouse Soccer Project Data warehouse Soccer Project
Data warehouse Soccer Project Sagar Singh
 
Joe Kruger Report. OPTIMA
Joe Kruger Report. OPTIMAJoe Kruger Report. OPTIMA
Joe Kruger Report. OPTIMAJoe Kruger
 
Joseph Moore Dissertation
Joseph Moore DissertationJoseph Moore Dissertation
Joseph Moore DissertationJoseph Moore
 
A Test For Salary Discrimination
A Test For Salary DiscriminationA Test For Salary Discrimination
A Test For Salary DiscriminationJorge Arias
 
Financial Fairplay?
Financial Fairplay?Financial Fairplay?
Financial Fairplay?Team4wiki
 

Similar to Predicting MLB Wins Using Data Mining (20)

Directed Research MRP
Directed Research MRPDirected Research MRP
Directed Research MRP
 
Research Paper
Research PaperResearch Paper
Research Paper
 
Sports Analytics: Market Shares, Strategy, and Forecasts, Worldwide, 2015 to ...
Sports Analytics: Market Shares, Strategy, and Forecasts, Worldwide, 2015 to ...Sports Analytics: Market Shares, Strategy, and Forecasts, Worldwide, 2015 to ...
Sports Analytics: Market Shares, Strategy, and Forecasts, Worldwide, 2015 to ...
 
SSRN-id2816685
SSRN-id2816685SSRN-id2816685
SSRN-id2816685
 
Multi Criteria Selection of All-Star Pitching Staff
Multi Criteria Selection of All-Star Pitching StaffMulti Criteria Selection of All-Star Pitching Staff
Multi Criteria Selection of All-Star Pitching Staff
 
Senior Project Research Paper
Senior Project Research PaperSenior Project Research Paper
Senior Project Research Paper
 
Measuring Team Chemistry in MLB
Measuring Team Chemistry in MLBMeasuring Team Chemistry in MLB
Measuring Team Chemistry in MLB
 
Machine Learning Project
Machine Learning ProjectMachine Learning Project
Machine Learning Project
 
Kerber_NBA_Analysis
Kerber_NBA_AnalysisKerber_NBA_Analysis
Kerber_NBA_Analysis
 
Data warehouse Soccer Project
Data warehouse Soccer Project Data warehouse Soccer Project
Data warehouse Soccer Project
 
LAX IMPACT! White Paper
LAX IMPACT! White PaperLAX IMPACT! White Paper
LAX IMPACT! White Paper
 
NBA Salary Discrimination Paper
NBA Salary Discrimination PaperNBA Salary Discrimination Paper
NBA Salary Discrimination Paper
 
Big Data for Big Sports
Big Data for Big SportsBig Data for Big Sports
Big Data for Big Sports
 
Joe Kruger Report
Joe Kruger ReportJoe Kruger Report
Joe Kruger Report
 
Joe Kruger Report. OPTIMA
Joe Kruger Report. OPTIMAJoe Kruger Report. OPTIMA
Joe Kruger Report. OPTIMA
 
Econometrics Paper
Econometrics PaperEconometrics Paper
Econometrics Paper
 
Joseph Moore Dissertation
Joseph Moore DissertationJoseph Moore Dissertation
Joseph Moore Dissertation
 
A Test For Salary Discrimination
A Test For Salary DiscriminationA Test For Salary Discrimination
A Test For Salary Discrimination
 
Cricket predictor
Cricket predictorCricket predictor
Cricket predictor
 
Financial Fairplay?
Financial Fairplay?Financial Fairplay?
Financial Fairplay?
 

Recently uploaded

Call Girls In Mahipalpur O9654467111 Escorts Service
Call Girls In Mahipalpur O9654467111  Escorts ServiceCall Girls In Mahipalpur O9654467111  Escorts Service
Call Girls In Mahipalpur O9654467111 Escorts ServiceSapana Sha
 
꧁❤ Greater Noida Call Girls Delhi ❤꧂ 9711199171 ☎️ Hard And Sexy Vip Call
꧁❤ Greater Noida Call Girls Delhi ❤꧂ 9711199171 ☎️ Hard And Sexy Vip Call꧁❤ Greater Noida Call Girls Delhi ❤꧂ 9711199171 ☎️ Hard And Sexy Vip Call
꧁❤ Greater Noida Call Girls Delhi ❤꧂ 9711199171 ☎️ Hard And Sexy Vip Callshivangimorya083
 
Low Rate Call Girls Bhilai Anika 8250192130 Independent Escort Service Bhilai
Low Rate Call Girls Bhilai Anika 8250192130 Independent Escort Service BhilaiLow Rate Call Girls Bhilai Anika 8250192130 Independent Escort Service Bhilai
Low Rate Call Girls Bhilai Anika 8250192130 Independent Escort Service BhilaiSuhani Kapoor
 
(PARI) Call Girls Wanowrie ( 7001035870 ) HI-Fi Pune Escorts Service
(PARI) Call Girls Wanowrie ( 7001035870 ) HI-Fi Pune Escorts Service(PARI) Call Girls Wanowrie ( 7001035870 ) HI-Fi Pune Escorts Service
(PARI) Call Girls Wanowrie ( 7001035870 ) HI-Fi Pune Escorts Serviceranjana rawat
 
VIP High Profile Call Girls Amravati Aarushi 8250192130 Independent Escort Se...
VIP High Profile Call Girls Amravati Aarushi 8250192130 Independent Escort Se...VIP High Profile Call Girls Amravati Aarushi 8250192130 Independent Escort Se...
VIP High Profile Call Girls Amravati Aarushi 8250192130 Independent Escort Se...Suhani Kapoor
 
Ukraine War presentation: KNOW THE BASICS
Ukraine War presentation: KNOW THE BASICSUkraine War presentation: KNOW THE BASICS
Ukraine War presentation: KNOW THE BASICSAishani27
 
Kantar AI Summit- Under Embargo till Wednesday, 24th April 2024, 4 PM, IST.pdf
Kantar AI Summit- Under Embargo till Wednesday, 24th April 2024, 4 PM, IST.pdfKantar AI Summit- Under Embargo till Wednesday, 24th April 2024, 4 PM, IST.pdf
Kantar AI Summit- Under Embargo till Wednesday, 24th April 2024, 4 PM, IST.pdfSocial Samosa
 
Beautiful Sapna Vip Call Girls Hauz Khas 9711199012 Call /Whatsapps
Beautiful Sapna Vip  Call Girls Hauz Khas 9711199012 Call /WhatsappsBeautiful Sapna Vip  Call Girls Hauz Khas 9711199012 Call /Whatsapps
Beautiful Sapna Vip Call Girls Hauz Khas 9711199012 Call /Whatsappssapnasaifi408
 
Market Analysis in the 5 Largest Economic Countries in Southeast Asia.pdf
Market Analysis in the 5 Largest Economic Countries in Southeast Asia.pdfMarket Analysis in the 5 Largest Economic Countries in Southeast Asia.pdf
Market Analysis in the 5 Largest Economic Countries in Southeast Asia.pdfRachmat Ramadhan H
 
Delhi Call Girls CP 9711199171 ☎✔👌✔ Whatsapp Hard And Sexy Vip Call
Delhi Call Girls CP 9711199171 ☎✔👌✔ Whatsapp Hard And Sexy Vip CallDelhi Call Girls CP 9711199171 ☎✔👌✔ Whatsapp Hard And Sexy Vip Call
Delhi Call Girls CP 9711199171 ☎✔👌✔ Whatsapp Hard And Sexy Vip Callshivangimorya083
 
Unveiling Insights: The Role of a Data Analyst
Unveiling Insights: The Role of a Data AnalystUnveiling Insights: The Role of a Data Analyst
Unveiling Insights: The Role of a Data AnalystSamantha Rae Coolbeth
 
Digi Khata Problem along complete plan.pptx
Digi Khata Problem along complete plan.pptxDigi Khata Problem along complete plan.pptx
Digi Khata Problem along complete plan.pptxTanveerAhmed817946
 
Saket, (-DELHI )+91-9654467111-(=)CHEAP Call Girls in Escorts Service Saket C...
Saket, (-DELHI )+91-9654467111-(=)CHEAP Call Girls in Escorts Service Saket C...Saket, (-DELHI )+91-9654467111-(=)CHEAP Call Girls in Escorts Service Saket C...
Saket, (-DELHI )+91-9654467111-(=)CHEAP Call Girls in Escorts Service Saket C...Sapana Sha
 
Full night 🥵 Call Girls Delhi New Friends Colony {9711199171} Sanya Reddy ✌️o...
Full night 🥵 Call Girls Delhi New Friends Colony {9711199171} Sanya Reddy ✌️o...Full night 🥵 Call Girls Delhi New Friends Colony {9711199171} Sanya Reddy ✌️o...
Full night 🥵 Call Girls Delhi New Friends Colony {9711199171} Sanya Reddy ✌️o...shivangimorya083
 
Aminabad Call Girl Agent 9548273370 , Call Girls Service Lucknow
Aminabad Call Girl Agent 9548273370 , Call Girls Service LucknowAminabad Call Girl Agent 9548273370 , Call Girls Service Lucknow
Aminabad Call Girl Agent 9548273370 , Call Girls Service Lucknowmakika9823
 
From idea to production in a day – Leveraging Azure ML and Streamlit to build...
From idea to production in a day – Leveraging Azure ML and Streamlit to build...From idea to production in a day – Leveraging Azure ML and Streamlit to build...
From idea to production in a day – Leveraging Azure ML and Streamlit to build...Florian Roscheck
 
B2 Creative Industry Response Evaluation.docx
B2 Creative Industry Response Evaluation.docxB2 Creative Industry Response Evaluation.docx
B2 Creative Industry Response Evaluation.docxStephen266013
 
Building on a FAIRly Strong Foundation to Connect Academic Research to Transl...
Building on a FAIRly Strong Foundation to Connect Academic Research to Transl...Building on a FAIRly Strong Foundation to Connect Academic Research to Transl...
Building on a FAIRly Strong Foundation to Connect Academic Research to Transl...Jack DiGiovanna
 

Recently uploaded (20)

Call Girls In Mahipalpur O9654467111 Escorts Service
Call Girls In Mahipalpur O9654467111  Escorts ServiceCall Girls In Mahipalpur O9654467111  Escorts Service
Call Girls In Mahipalpur O9654467111 Escorts Service
 
꧁❤ Greater Noida Call Girls Delhi ❤꧂ 9711199171 ☎️ Hard And Sexy Vip Call
꧁❤ Greater Noida Call Girls Delhi ❤꧂ 9711199171 ☎️ Hard And Sexy Vip Call꧁❤ Greater Noida Call Girls Delhi ❤꧂ 9711199171 ☎️ Hard And Sexy Vip Call
꧁❤ Greater Noida Call Girls Delhi ❤꧂ 9711199171 ☎️ Hard And Sexy Vip Call
 
Low Rate Call Girls Bhilai Anika 8250192130 Independent Escort Service Bhilai
Low Rate Call Girls Bhilai Anika 8250192130 Independent Escort Service BhilaiLow Rate Call Girls Bhilai Anika 8250192130 Independent Escort Service Bhilai
Low Rate Call Girls Bhilai Anika 8250192130 Independent Escort Service Bhilai
 
(PARI) Call Girls Wanowrie ( 7001035870 ) HI-Fi Pune Escorts Service
(PARI) Call Girls Wanowrie ( 7001035870 ) HI-Fi Pune Escorts Service(PARI) Call Girls Wanowrie ( 7001035870 ) HI-Fi Pune Escorts Service
(PARI) Call Girls Wanowrie ( 7001035870 ) HI-Fi Pune Escorts Service
 
VIP High Profile Call Girls Amravati Aarushi 8250192130 Independent Escort Se...
VIP High Profile Call Girls Amravati Aarushi 8250192130 Independent Escort Se...VIP High Profile Call Girls Amravati Aarushi 8250192130 Independent Escort Se...
VIP High Profile Call Girls Amravati Aarushi 8250192130 Independent Escort Se...
 
Ukraine War presentation: KNOW THE BASICS
Ukraine War presentation: KNOW THE BASICSUkraine War presentation: KNOW THE BASICS
Ukraine War presentation: KNOW THE BASICS
 
Delhi 99530 vip 56974 Genuine Escort Service Call Girls in Kishangarh
Delhi 99530 vip 56974 Genuine Escort Service Call Girls in  KishangarhDelhi 99530 vip 56974 Genuine Escort Service Call Girls in  Kishangarh
Delhi 99530 vip 56974 Genuine Escort Service Call Girls in Kishangarh
 
Kantar AI Summit- Under Embargo till Wednesday, 24th April 2024, 4 PM, IST.pdf
Kantar AI Summit- Under Embargo till Wednesday, 24th April 2024, 4 PM, IST.pdfKantar AI Summit- Under Embargo till Wednesday, 24th April 2024, 4 PM, IST.pdf
Kantar AI Summit- Under Embargo till Wednesday, 24th April 2024, 4 PM, IST.pdf
 
Beautiful Sapna Vip Call Girls Hauz Khas 9711199012 Call /Whatsapps
Beautiful Sapna Vip  Call Girls Hauz Khas 9711199012 Call /WhatsappsBeautiful Sapna Vip  Call Girls Hauz Khas 9711199012 Call /Whatsapps
Beautiful Sapna Vip Call Girls Hauz Khas 9711199012 Call /Whatsapps
 
Market Analysis in the 5 Largest Economic Countries in Southeast Asia.pdf
Market Analysis in the 5 Largest Economic Countries in Southeast Asia.pdfMarket Analysis in the 5 Largest Economic Countries in Southeast Asia.pdf
Market Analysis in the 5 Largest Economic Countries in Southeast Asia.pdf
 
Delhi Call Girls CP 9711199171 ☎✔👌✔ Whatsapp Hard And Sexy Vip Call
Delhi Call Girls CP 9711199171 ☎✔👌✔ Whatsapp Hard And Sexy Vip CallDelhi Call Girls CP 9711199171 ☎✔👌✔ Whatsapp Hard And Sexy Vip Call
Delhi Call Girls CP 9711199171 ☎✔👌✔ Whatsapp Hard And Sexy Vip Call
 
Unveiling Insights: The Role of a Data Analyst
Unveiling Insights: The Role of a Data AnalystUnveiling Insights: The Role of a Data Analyst
Unveiling Insights: The Role of a Data Analyst
 
Decoding Loan Approval: Predictive Modeling in Action
Decoding Loan Approval: Predictive Modeling in ActionDecoding Loan Approval: Predictive Modeling in Action
Decoding Loan Approval: Predictive Modeling in Action
 
Digi Khata Problem along complete plan.pptx
Digi Khata Problem along complete plan.pptxDigi Khata Problem along complete plan.pptx
Digi Khata Problem along complete plan.pptx
 
Saket, (-DELHI )+91-9654467111-(=)CHEAP Call Girls in Escorts Service Saket C...
Saket, (-DELHI )+91-9654467111-(=)CHEAP Call Girls in Escorts Service Saket C...Saket, (-DELHI )+91-9654467111-(=)CHEAP Call Girls in Escorts Service Saket C...
Saket, (-DELHI )+91-9654467111-(=)CHEAP Call Girls in Escorts Service Saket C...
 
Full night 🥵 Call Girls Delhi New Friends Colony {9711199171} Sanya Reddy ✌️o...
Full night 🥵 Call Girls Delhi New Friends Colony {9711199171} Sanya Reddy ✌️o...Full night 🥵 Call Girls Delhi New Friends Colony {9711199171} Sanya Reddy ✌️o...
Full night 🥵 Call Girls Delhi New Friends Colony {9711199171} Sanya Reddy ✌️o...
 
Aminabad Call Girl Agent 9548273370 , Call Girls Service Lucknow
Aminabad Call Girl Agent 9548273370 , Call Girls Service LucknowAminabad Call Girl Agent 9548273370 , Call Girls Service Lucknow
Aminabad Call Girl Agent 9548273370 , Call Girls Service Lucknow
 
From idea to production in a day – Leveraging Azure ML and Streamlit to build...
From idea to production in a day – Leveraging Azure ML and Streamlit to build...From idea to production in a day – Leveraging Azure ML and Streamlit to build...
From idea to production in a day – Leveraging Azure ML and Streamlit to build...
 
B2 Creative Industry Response Evaluation.docx
B2 Creative Industry Response Evaluation.docxB2 Creative Industry Response Evaluation.docx
B2 Creative Industry Response Evaluation.docx
 
Building on a FAIRly Strong Foundation to Connect Academic Research to Transl...
Building on a FAIRly Strong Foundation to Connect Academic Research to Transl...Building on a FAIRly Strong Foundation to Connect Academic Research to Transl...
Building on a FAIRly Strong Foundation to Connect Academic Research to Transl...
 

Predicting MLB Wins Using Data Mining

  • 1. POMS 4050.201 Predictive Data Analytics Dr. Asil Oztekin Term Project Report Due Date: 5/3/19 Joel Dabady, Mark Albee, Eric Rose Identifying Key Factors in Winning MLB Games Using a Data-Mining Approach
  • 2. 1 Abstract Objective: Baseball is the pioneer sport for using advanced analytics to make strategies and to scout and sign players. Winning is the ultimate end goal, and millions and millions of dollars is put into Major League Baseball teams every year in order to win. This study aims to predict team wins in the MLB using data mining techniques and basic team batting, pitching, and fielding statistics. Specifically, we want to look at the predictor importance of each statistic so that we can see which ones contribute most to winning games, and whether or not there is a notable difference in the importance of batting vs pitching vs fielding. These results can help teams focus on what is important when building a team, saving organizations millions of wasted dollars on players and coaches who do not fit the key traits needed to win. The data used is from the 2009- 2018 seasons using statistics for every team for those years. Data mining techniques were used to conduct the study, and four models, Artificial Neural Network, Support Vector Machines, Linear Regression, and Automatic Linear Model, were run to obtain our results. The data was randomly split up 70% training and 30% testing when running the models. Key Words: Baseball, Analytics, Statistics, Wins, Data Mining 1. Introduction Motivation In professional team sports, the goal is simple: Maximize wins. The more games your teams wins, the better chances they have at making the playoffs. Making the playoffs will do a number of important positive things for professional sports teams, including raising their popularity around the league they operate in. This team will also play more games than teams that do not make the playoffs-meaning they will generate more ticket and stadium revenue as well as increased apparel and accessories revenue. The benefits from maximizing your wins every season are clear and tangible. Baseball organizations have historically relied on human evaluation, or the eye test, when building a team. Until recently, MLB organizations employed teams of scouts directed to use their experience and intuition to evaluate talent. The 2011 film, Moneyball, depicted the 2002
  • 3. 2 Oakland Athletics utilizing data and statistical analytics methods to evaluate talent and build their team. The success of that organization coupled with the popularity of the film, brought data analytics in Major League Baseball to the mainstream. No longer are the days that teams spend millions of dollars on players based solely on human evaluation. Teams are now able to accurately assess the value of player outputs through the use of mathematical modeling. This study uses four regression-based data-mining models to predict total wins, based upon basic team batting, pitching and fielding stats. Utilizing a variable sensitivity analysis, we can determine the statistics that contribute most to winning MLB games. Teams can use this knowledge to sign free agents, make trades with other teams and draft players who produce the statistics that undeniably add value to their team’s goal: winning. Literature Review Baseball is the pioneer sport for advanced analytics, starting in 1977 when Bill James published the first edition of his annual book The Bill James Baseball Abstract. James has created dozens of advanced statistics by using analytics, and these stats have been adopted by the MLB and are used in team front offices today. The most famous of his statistics is the Pythagorean Wins formula. This formula is used to predict wins based on how many runs scored and how many runs allowed a team has. Additional research performed by Huemann (2016) [1] looked to improve James’ formula by eliminating one of the major flaws. In every baseball game, there is one winner and one loser, so over the course of a whole season, the total league wins has to equal total league losses. James’ formula, however, does not create an equal league if the Pythagorean records of every team is summed. This is because James looks at each individual team alone, without consideration of the other teams, instead of each team in the environment of other teams. Huemann’s formula creates a formula that takes the sum of a team’s Pythagorean record against every other individual team. This new formula decreased the error of Pythagorean wins vs actual wins when compared to James’ formula. Overall, no matter if using James’ formula or the updated formula by Huemann, both of these formulas show the importance of the statistics runs scored and runs allowed in order to win games. Runs scored and runs allowed by teams prove to be key in winning MLB games, and a study by Beneventano et al. (2012) [2] analyzes what impacts both of these variables the most. Their research uses multiple regression analysis to examine the biggest predictor variables of
  • 4. 3 scoring runs and preventing runs using both simple and advanced statistics. The study found that the biggest predictor for runs scored is the advanced statistic weighted on-base average (wOBA). This statistic calculates the effectiveness of a player per at bat. For runs allowed, the most important predictor is that statistic walks and hits per inning pitched (WHIP). This statistic is simple, it is the sum of walks pitched and hits allowed divided by the total innings pitched. This study gives a clearer picture of what goes into scoring and preventing runs. Ng (2017) [3] performed a study that analyzes the effects of age and experience on player’s performance. Ng’s study sought to find out when pitchers and batters peak in their career, based on their Wins Above Replacement (WAR). This is an advanced statistic that measures how much value a player brings compared to a replacement level player. A player with a WAR value of 5.6 means that the player’s performance caused the team to win 5.6 more wins than if a replacement level player played in his spot. Using WAR as the dependent variable, Ng’s study found the peak age for hitters to be 29 years old and the peak age for pitchers to be 28 years old. Using this conclusion, the question can be raised about how much the average age of players on a team affect the total wins the team has. Before finding out that player age would be one of the lowest variables in determining key factors in winning MLB games using data-mining we referenced, Understanding Career Progression in Baseball Through Machine Learning, a study by Hollenbeck et al. (2017) [4]. The goal of this study was to determine which potential MLB should the expensive contracts go to and if age played a role in determine player performance. Data used in this study included first 6 season player career data dating back to the 70’s. Player value was measured in Wins Above Replacement, a statistic that measures a player’s overall contribution to their team. The timeline used for this measurement was 7-11 years. Tools used in this study included Ridge Model, Neural Network, Tree Bagging Model, Support Vector Regression, and Hyperparameter Optimization. Conclusions made in the study stated that long term contracts should go to batters rather than pitchers. Another conclusion made was that 6 Season Cumulative Wins Above Replacement and 6th Season Cumulative Wins Above Replacement are the best predictors for late career MLB performance. Before conducting the Identifying Key Factors in Winning MLB Games Using a Data- Mining Approach Study another study that helped determine disparities in MLB Player performance and their contracts. That study was Great Expectations: An Analysis of Major
  • 5. 4 League Baseball Free Agent Performance by Barnes et al. (2016) [5]. The goal of this study was to see if MLB Free Agents met the expectations set in their contracts through value and duration based on player performance to date, marketing potential, and future performance. A plethora of regression and tree-based algorithms as well as a performance and a market model were used to determine whether the expectations became a reality. The performance and market models could actively be used to target and avoid MLB free agencies who had disparities in their performance- based value vs. their market value. Conclusions that were made in this study were that the use of both models individually provided data that some would consider to miss the mark, but the use of both models together helped better the define the output as far as correlation between performance value, market value, and price of contract. Since Baseball is the most analytically studied sports, there have been many studies that involve data mining that aim to predict outcomes. A study by Tolbert et al. (2016) [6] aimed to predict the eventual AL, NL, and overall MLB champion using data mining techniques. This studied used various batting, pitching, fielding stats, as well as WAR and team record. Though not predicting wins, Tolbert et al. aimed to find the best team using these team statistics. The study used different versions of SVM algorithms, and each model was between 57% and 69% accurate. Also, the study looked to categorize each team as a either a league winner or loser, so one problem Tolbert et al. had was that there were multiple teams that were categorized as winners, even though there can only be one winner and the rest losers. Still, using these basic statistics the models were able to predict the actual winning team in the AL as the winner in the model, as well as the overall winner in the MLB championship. In the NL, the tests incorrectly labeled the actual winning team as a loser, and a comment that Tolbert et al. made was that the models predicted winner went against the traditional thinking of what makes a championship caliber team. As analytics interest grows in the MLB, so have the analytics departments for each individual team. Chu et al. (2019) [7] conducted a study on the relationship between a team’s analytic spending and staffing, and the team’s success in the regular season and postseason for the MLB. The study aims to find out how much of an advantage, if any, analytic departments add to a team. To start, Chu et al. used the data collected to place every team into either an analytics believer category, or an analytics non-believer. Then, the effects of analytics were found using correlation analysis, logistic regression, and linear regression models. The results showed that
  • 6. 5 analytics do have an effect in positive regular season results, as 48% of the teams who were believers in analytics made it to the postseason, while just 16% of the non-believers made it. However, the data gives no clear answer as to whether or no analytics helped a team in the postseason. Chu et al believe that more data will be needed in order to identify a relationship between analytics and postseason success. To comprehensively analyze the stats datasets that were collected from baseball- reference.com, Using Analytics To Challenge Conventional Baseball Wisdom, a study by Rees et al. (2015) [8] was referenced. In this study, common baseball wisdom is examined through multi-season simulation. Multiple MLB team profiles were created, and varying factors were examined through the simulation of 10 seasons using varying configurations with different teams. Conclusions that were made from this study included, batters that perform well with runners in scoring have a greater influence in helping their team in scoring more runs than powerful batters who underproduce similar results. A conclusion that the Identifying Key Factors in Winning MLB Games Using a Data-Mining Approach Study came to be that higher performing batters are less likely to influence how well a team performs according to other similar underlying team factors. Baseball Lineup Optimization by Schorsch et al. (2015) [9] is study that aimed to find the best way to optimize MLB Team Lineups to maximize MLB Team Wins. Optimization of MLB Team Lineups can account for two to three team wins per season. A Markov Chain based simulation was to determine run expectancy of any given lineup . Then a Metropolis-Hastings Algorithm was used to precisely sample from all potential lineups for any given team. The team that the researchers chose to model was that of their own college, Swarthmore College. Results concluded from this study were that optimal lineups overestimated the runs scored. Predicting Win-Loss outcomes in MLB Regular Season Games - A Comparative Study Using Data Mining Methods by Valero (2016) [10], employs the CRISP-DM method to assess the accuracy of four data mining models when predicting game outcomes. The author of this study utilized classification and regression-based predictive models, and found that the classification scheme was a better predictor of game wins than regression. Of the four (SVM, K- NN, ANN, DT) data-mining models, SVM’s performed the best with a prediction accuracy of 60%. A study that helped further the knowledge on the output variable wins was Winner and
  • 7. 6 Loser Effects in Major League Baseball Doubleheaders by Gallup et al. (2014) [11]. The study aimed to determine what factors go into the winning and losing patterns of Major League Baseball Doubleheaders (two baseball games that are played between the same two teams on the same day) by comparing archival MLB Data from 2002-2014 from ESPN on a single team winning both games (sweeps) vs. each team winning one game (splits). A Binary Logistic Regression was used in determining differences in season win totals between MLB Teams that played in doubleheaders. This predicted the outcome of sweep vs. split. In addition Binomial tests with probability set to .5 were used to determine the even distribution of sweeps, splits, and home vs. away victors. Independent t-test were used in comparing victory margins between doubleheader games that were swept vs. split. These test were adjusted when variances in samples became unequal after using Levene’s Test. All stat analyses were performed using IBM SPSS v.2.1 with α set to .05. The conclusions that were made from this study is sweeps are more common than splits and that there is always a home team advantage doubleheaders are played. According to openWAR: An open source system for evaluating overall player performance in major league baseball by Baumer et al. (2016) [12] , one of the most challenging aspects of talent evaluation is translating a player’s individual, statistical contributions into team wins. This study took an extremely popular advanced Sabermetric, WAR (wins above replacement), that usually relies on proprietary data and made it public. The authors utilized public data, open and transparent algorithms and simulation based techniques to make their findings easily understandable. The goal of their study was to simplify talent evaluation and convey the findings in universally understood terms. Evaluating talent is the by-product obtained from predicting team wins. Gerrard (2015) [13], in The Role of Analytics in Assessing Playing Talent, discusses the role that analytics will play in teams assessing talent and making decisions on acquiring talent. This study found that the role of statistical analysis should be less than that of the human evaluation of player performance. The prediction of sports outcomes has many applications and possible benefits attached. With the legalization of sports gambling, people are searching for ways to easily and effectively predict the outcomes of sports games. The use of data mining for basketball matches outcomes prediction by Miljkovic (2010) [14], identifies a system using data mining techniques that predicts the outcomes of NBA games. The author utilizes data mining software and two seasons
  • 8. 7 worth of NBA game data to predict the outcomes of NBA games to a 67% accuracy rating. Finding which factors contribute to winning baseball games helps managers understand day to day decisions. The Contributing Factors to Winning in MLB by Pothula, S (2015) [15] uses Ordinary Least Squares regression analysis to provide an understanding of what factors contribute to a good lineup and defensive positioning. Their study concludes that Home Runs, Walks, Strikeouts, Caught Stealing, Throwing Errors, Defensive Runs Saved, and a squared term for Fielding Errors proved to be significant in explaining wins in MLB. 2. Methodology Figure 1. The step by step methodology of this data mining process. Data For this study historical team data was taken from baseball-reference.com. These datasets included team stats from 2009-2018 Major League Baseball seasons. Each season had a separate batting, fielding, and pitching data set, so these datasets were merged into one large dataset for each season. Then, each season was combined to create a final data set. In order to ensure the most accurate data set, redundancies were searched for based on variables that derived from one another. For example, On Base % (OBP) is derived from hits and walks, so OBP was taken out and hits and walks were kept in the data set. After finding all of the redundancies that were found from prior knowledge of Major League Baseball stats, a correlation analysis was performed to further narrow down unbeknownst variables. Variables with a correlation of 66% or more were
  • 9. 8 further analyzed. If determined that the variables were correlated, but there was no causation effect between the two, then the variables were kept. If the variables were correlated and they seemed to derive from each other, they were deleted. After the data had been cleaned, it was processed through IBM SPSS Modeler. A 70% - 30% training - testing split ensure that the models have enough data to create successful outcomes with proper model development. The data called for regression prediction models, and the models that were used are as follows: Artificial Neural Networks An Artificial Neural Network (ANN) model is used to determine pattern-recognition through machine learning which in turn output a forecast/prediction of wins and predictor importance based on the data set that is processed through it. ANN works by creating neurons in hidden layers that derive from the layer before it. The beginning layer is the input variables and the end layer is the output variable. The default settings of IBM SPSS’ ANN model were used to run the data. Support Vector Machines The Support Vector Machines (SVM) model is a supervised learning model. SVM models are one of the most popular models in data mining, and they are best used in either classification or regression analysis. The default SVM settings were used in IBM SPSS to run the data. No accuracy data was given as an output, so the SVM R squared data needed to be calculated in Excel. Linear Regression Linear Regression is a model that seeks to find a linear relationship between the input variables and the output variable. Linear Regression works best when the data has very few outliers. The default settings were used in IBM SPSS, with the exception that predictor importance needed to be selected. Automatic Linear Model Automatic Linear Model (ALM) is a new model introduced by IBM SPSS a few years back. This model has been positively received because it has a larger focus on analyzing data
  • 10. 9 than regular linear regression. ALM gives numerous additional graphs and charts on the model outputs that help to understand the rationale. In addition, ALM has automatic data preparation steps, and these steps seek to “trim” data that the model finds to not be important. This leads to the model having only a handful of variables that it uses to predict output. This is seen in the Results and Discussion section. The default IBM SPSS settings were used for ALM. Description of Variables This study used 23 input variables, all of which were continuous. There was 1 output variable, which was also continuous. All data came from the sports database Baseball- Reference.com, and multiple data sets were combined to form the one used in the study. These are basic MLB statistics that use very little, if any, calculations. Below is a description of each variable. a. Wins - Total games the team won during each individual season. (Output) BATTING VARIABLES b. BatAge - The average age of the batters for a team. This is weighted based on at bats and games played by each individual player who took an at bat during the season. (Input) c. R/G - Runs scored per game by each team over a full season. (Input) d. H - Total number of hits by the team’s offense over the course of a season. (Input) e. 2B - Total number of doubles hit by the team’s offense over the course of a season. (Input) f. 3B - Total number of triples hit by the team’s offense over the course of a season. (Input) g. HR - Total number of home runs hit by the team’s offense over the course of a season. (Input) h. SB - Total number of stolen bases by a team’s offense over the course of a season. (Input) i. CS - Total number of times a team’s offense has been caught trying to steal a base over the course of a season. (Input) j. BB - Total number of walks by a team’s offense over the course of a season. (Input) k. SO - Total number of strikeouts the team’s offense had over the course of a season. (Input)
  • 11. 10 l. GDP - Total number of instances where the offense grounded into a double play throughout the season. (Input) m. SAC - Total number of sacrifice hits a team’s offense had over the course of a season. This is a different and independent variable than hits (H). (Input) n. LOB - Total number of players who were left on base at the end of an inning over the course of a season. (Input) PITCHING VARIABLES o. PAge - Average age of each pitcher that played for a team over the course of the season. This is weighted by games started, games played, and saves. (Input) p. RA/G - Number of runs per game a team allowed over the course of a season. (Input) q. HA - Total number of hits allowed by pitchers over the course of a season. (Input) r. HRA - Total number home runs allowed by pitchers over the course of a season. (Input) s. BBA - Total number of walks allowed by pitchers over the course of a season. (Input) t. SOA - Total number of strikeouts thrown by pitchers over the course of a season. (Input) u. LOBA - Total number of opposing base runners that have been left on base at the end of an inning by pitchers over the course of a season. (Input) FIELDING VARIABLES v. DefEff - The defensive efficiency of a team during the course of a season. This is the percentage of balls in play that were converted into outs. (Input) w. DP - Total number of double plays converted by the defense over the course of a season. (Input) x. Fld% - Fielding percentage of a defense during the course of a season. This is the percentage of outs made that were not errors. (Input) 3. Results & Discussion There are two main results from the data that the models provide. First, the accuracy of
  • 12. 11 each model is found by comparing the actual team wins versus the predicted wins. Second, the predictor importance of each input variables provide the information of what is the most important factor in winning games. The predictor importance of each model is provided by IBM SPSS Modeler. Figure 2: The measures of accuracy of the 4 models. Figure 2 shows the measures of accuracy for each model that was run. The Artificial Neural Network model is the most accurate, with the R squared accuracy of 88.6%. Each model, however, is successful in creating accurate data, as the accuracies are all above 85%. The mean absolute deviation (MAD) is the average absolute value of the difference between predicted wins and actual wins. The Automatic Linear Model has the lowest MAD, as the predictions are 3.177 wins off from the actual value. This means that the average predicted wins value is +/- 3.177 wins off of the actual value. The Support Vector Machine model is the least successful in all measures of accuracy, however it is only slightly worse than the other models, so the data is still useful.
  • 13. 12 Figure 3: Random selection of testing results that shows each model’s wins compared to the actual team wins. Figure 3 is a random selection of 18 results from the testing data. These results show how the models compute on a case by case basis. Each model values the input variable differently, so the predicted wins are based off of how the models value the inputs. The models do show to have mostly similar thinking to each other when compared to the actual wins. For example, in the top result of 108 actual wins, all the models predict lower wins than what actually happen, with the predicted value between 99-101. This can mean that the team who had 108 wins over performed expectations, as their statistics say they should have won somewhere around 100 games. 108 wins is extremely good for a MLB team, so it is not surprising to see that the team needed to over perform expectations to get to that number. Overall, the accuracy results of each model show that the conclusions made can be meaningful, as each model provides accurate insight into predicting wins. The results also give confidence to the predictor importance of each model.
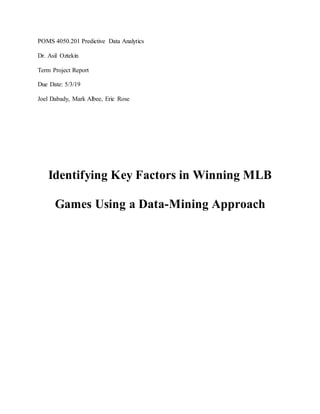
  • 14. 13 Figure 4: The predictor importance of each variable sorted by most important at the top and least important at the bottom. The predictor importance of each model is shown above in Figure 4. A weighted average based on the R squared accuracy of each model was used to order the variables by importance. The results show that RA/G (runs allowed per game) is the most important variable in predicting team wins. R/G (runs scored per game) is the second most important variable. These two variables being at the top of the list is not surprising, and it was expected going into the study. However, it was not known if scoring runs or preventing runs is more important to winning, so the predictor importance gives a clear answer. The Automatic Linear Model has RA/G as 73% importance to winning, and this is due to the trimming process of variables that occurs while running the model. The ALM raises the weighted importance of RA/G significantly, however if ALM is taken out, RA/G is still the top variable but by a smaller margin. The ALM also shows
  • 15. 14 just how important RA/G and R/G are in predicting wins, as ALM has an accuracy of 87.7% and the model is predicting wins by using almost exclusively RA/G and R/G. Linear Regression and SVM both have R/G as the top variable, but these two models have the lowest in accuracy of all the models. The two most accurate models, ANN and ALM, each have RA/G as the top variable, and by a significant amount. Some other variables to note in the predictor importance is DefEff (defensive efficiency) and Fld% (fielding percentage). These two variables are measures of defense, and DefEff is the 3rd most important variable while Fld% is at the bottom. Also, BatAge (average batter’s age) is at the bottom of the list while PAge (average pitcher’s age) is near the top, showing that age is important for pitching, but not for batting. Deeper discussion of what these results mean can be found in the Managerial Implications section. 4. Managerial Implications Predicting wins for MLB teams allows managers to understand which statistics contribute most to winning games. As previously stated, winning games translates to more revenue for teams through increased popularity and fan base interaction, greater apparel and team accessory purchases and a higher number of ticket sales if the team makes the playoffs. The findings of this study indicate where and how a team should invest to maximize their wins. The research found that preventing opponents from scoring runs every game (RA/G input variable) is almost twice as important as scoring runs every game (R/G input variable). This finding coupled with Defensive Efficiency ranking 3rd on the predictor importance rating, indicates that teams must place a much higher emphasis on Defensive and Pitching stats opposed to Batting. Basically, the results say it is more important to prevent runs than it is to score runs. Teams that properly invest in these statistical categories are advantageous over those who do not. Conventional Baseball knowledge associates a negative connotation with striking out, and positive for Home Runs. Players who typically hit a lot of Home Runs often also strike out quite a lot. This leads MLB teams to stay away from players who hit a lot of Home Runs, strike out often and do not contribute in many other statistical categories. These types of players who “swing for the fences” are found to be extremely valuable in this study. Home Runs were found
  • 16. 15 to be almost twice as important as Strikeouts, ranking 4th for predictor importance in terms of winning games. Overall, home runs have a major influence on winning while strikeouts have very small correlation no matter if there is a large or small amount of them. A theory for why this is, is because strikeouts leave no damage to the players on base. A ground ball to second base however, may result in a double play, proving to be much more costly than a strikeout. Teams may be able to find these types of players for a cheaper price as the market typically devalues them due to misinformation. Player speed is something teams are generally willing to pay for. Carl Crawford, a player well-known for his speed and ability to steal bases, signed a 7-year $142 million dollar contract with the Boston Red Sox in 2011 [16]. Two years after the Red Sox acquired him, he was traded to the Los Angeles Dodgers. The Red Sox realized that his statistics, while flashy, were not valuable to winning games. They wasted millions of dollars to bring in a player who would ultimately be traded. This study through the employment of basic data analytics, found the Stolen Bases statistic to be of little to no importance in winning baseball games-as did the Boston Red Sox through trial and error that cost them millions of dollars. Finally, out of the two fielding statistics, DefEff was found to be a more accurate predictor of wins than Fld%. This means that when teams evaluate defenses, they should be using the Defensive Efficiency statistic, as this will give them a better idea of how much they need to improve on defense. 5. Concluding Remarks and Further Research The real important findings of this study is based in the predictor importance. The accuracy of the models show that there is meaning in the predictor importance. Baseball is an analytically driven league, and a big reason why is because it is a simple game. Every play is based on one pitcher vs one batter. The simplicity allows for math to be able to take over to find trends that they naked eye cannot see. This study found that RA/G is the most important statistic to winning games. The average observer may be surprised by this, as offense is where the flash and glory of baseball is often found. But the backbone of a good team is found in the pitching and defense. Further research that can be studied would be to look at advanced stats and see how they
  • 17. 16 impact winning. Some variables that could be used would be the average velocity of pitches for a team, or the percentage of pitches thrown that are fastballs, curveballs, sliders, etc. In addition, we could look at the sum of WAR for all the players on the team, or the average exit velocity coming off of the bat. Categorical variables could also be used as a way to study baseball. Examples of possible variables could be field size, if the team made the playoffs the previous year, or if the team made a major off-season acquisition. In addition, this type of analysis can be explored in other sports. The process is relatively simple, and almost every sport is heavy into statistics. So if enough continuous variables are available for a data set, then a study can be done on how important each variable is to winning. Also, instead of having the full team stats, rankings of teams based on stats could be used. For example, a team with the most hits in a season would have a value of 1, while the worst team would have a value of 30.
  • 18. 17 References [1] Heumann, Jay., (2016). An Improvement to the Baseball Statistic “Pythagorean Wins”. Journal of Sports Analytics, 2. 49-59. Retrieved from https://content.iospress.com/articles/journal-of-sports-analytics/jsa0018 [2] Beneventano, Philip., Berger, Paul. D., Weinburg, Bruce. D. (2012). Predicting Run Production and Run Prevention in Baseball: The Impact of Sabermetrics. International Journal of Business, Humanities and Technology, 2(4). Retrieved from http://www.ijbhtnet.com/journals/Vol_2_No_4_June_2012/7.pdf [3] Ng, K. (2017). Analyzing Major League Baseball Player’s Performance Based On Age and Experience. Journal of Sports Economics & Management, 7(2). 78-100. Retrieved from http://sportsem.uv.es/j_sports_and_em/index.php/JSEM/article/view/66 [4] Hollenbeck, J., Bierig, B., & Stroud, A. (2017). Arxiv. Understanding Career Progression in Baseball Through MachineLearning, 1-5. Retrieved from https://arxiv.org/abs/1712.05754. [5] Barnes, S. L., & Bjarnadóttir, M. V. (2016). Great Expectations: An Analysis of Major League Baseball Free Agent Performance. Statistical Analysis and Data Mining: The ASA Data Science Journal, 9(5), special issue, 1-15. Retrieved from https://onlinelibrary.wiley.com/doi/epdf/10.1002/sam.11311. [6] Tolbert, Brandon., & Trafalis, Theodore. (2016). Predicting Major League Baseball Championship Winners Through Data Mining. Athens Journal of Sports, 3(4). 239-252. Retrieved from https://www.athensjournals.gr/sports/2016-3-4-1-Tolbert.pdf [7] Chu, David. P., Wang, Cheng. W. (2019). Empirical Study On Relationship Between Sports Analytics And Success In Regular Season And Postseason In Major League Baseball.
  • 19. 18 Journal of Sports Analytics. Retrieved from. https://content.iospress.com/articles/journal-of- sports-analytics/jsa190269 [8] Rees, Paul, L., Rakes, T. R., & Deane, J. K. (2015). Using Analytics To Challenge Conventional Baseball Wisdom. Journal of Service Science, 8(1), 1-10. Retrieved from https://clutejournals.com/index.php/JSS/article/view/9493/9588. [9] Schorsch, E., & Valera, A. (2015). Baseball Lineup Optimization. Swarthmore College Department of Computer Science, 1-4. Retrieved from https://www.researchgate.net/profile/Emanuel_Schorsch/publication/328529782_Baseball_Lineu p_Optimization/links/5bd2a90b4585150b2b877139/Baseball-Lineup-Optimization.pdf. [10] Valero, CS. (2016). Predicting Win-Loss outcomes in MLB Regular Season Games - A Comparative Study Using Data Mining Methods. International Journal of Computer Science in Sport, 15(2), 91-112. Retrieved from https://www.degruyter.com/downloadpdf/j/ijcss.2016.15.issue-2/ijcss-2016-0007/ijcss-2016- 0007.pdf [11] Gallup, A. C., & Eldakar, O. T. (2014). Winner and Loser Effects in Major League Baseball Double Headers. Nova Southeastern University NSU Works, 1-11. https://nsuworks.nova.edu/cgi/viewcontent.cgi?referer=https://scholar.google.com/&httpsredir=1 &article=1292&context=cnso_bio_facarticles/ [12] Baumer, B., Jensen, S. & Matthews, G. (2015). openWAR: An open source system for evaluating overall player performance in major league baseball. Journal of Quantitative Analysis in Sports, 11(2), 69-84. Retrieved from https://www.degruyter.com/downloadpdf/j/jqas.2015.11.issue-2/jqas-2014-0098/jqas-2014- 0098.pdf
  • 20. 19 [13] Gerrard, B. (2015). The Role of Analytics in Assessing Playing Talent. The Handbook of Talent Identification and Development in Sport. Retrieved from http://eprints.whiterose.ac.uk/98808/3/Book%2520Chapter%2520Role%2520of%2520Analytics %2520in%2520Assessing%2520Playing%2520Talent%2520%28Final%2520Feb%25202016%2 9%5B1%5D.pdf [14] Miljkovic, D. Gajić, L. Kovačević, A. Konjović, Z. (2010). The use of data mining for basketball matches outcomes prediction. International Symposium on Intelligent Systems and Informatics, 8. Retrieved From https://ieeexplore.ieee.org/abstract/document/5647440 [15] Pothula, S. (2015). The Contributing Factors to Winning in MLB. Retrieved from https://www.researchgate.net/profile/Sanjay_Pothula/publication/276026339_The_Contributing_ Factors_to_Winning_in_Baseball/links/554e361308ae93634ec7011c.pdf [16] 2019. Carl Crawford Career Earnings. Retrieved from https://www.spotrac.com/mlb/los- angeles-dodgers/carl-crawford-849/cash-earnings/
  • 21. 20 About the Authors Eric Rose graduated from Chelmsford High School, alongside co-author Mark Albee, in 2014. He then went on to study Computer Engineering at the University of Massachusetts, Lowell. After a year, Eric switched majors to Business Administration with a concentration in Analytics and Operations management. He plans on graduating this May, and is actively applying to jobs in this field. In his free time Eric enjoys playing sports, relaxing with friends and family and reading. To Contact – linkedin.com/in/eric-rose-098a65165 or eric_rose@student.uml.edu Mark Albee is a Finance major and Math minor who will be graduating from UMASS Lowell in 2019. He is from Chelmsford MA, and graduated from Chelmsford High School in 2014. His interests outside of school include sports, which is the primary reason why this topic was chosen. He formally was an employee of Polartec LLC as a Manufacturing Engineering Intern, and also at Axis Communications in the Finance and Operations department as an intern. After graduation Mark hopes to find a job in the quantitative side of Finance. To contact – linkedin.com/in/markalbee/ or markalbee10@gmail.com Joel Dabady graduated from Xaverian Bros. Highschool. Joel is currently pursuing a Business Administration Degree in Management Information Systems and Analytics and Operations Management with a minor Studio. Joel will be graduating UMass Lowell in the Spring of 2019. Joel has interests that envelop everything under the sun. His interests include information technology, analytics, finance, film scoring, music production, rowing, and art to name a few. What Joel is most interested in overall is to have fun in life! To Contact – linkedin.com/in/joel-7 or Joel.Dabady@gmail.com