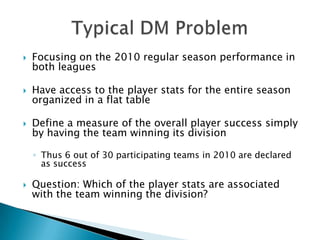
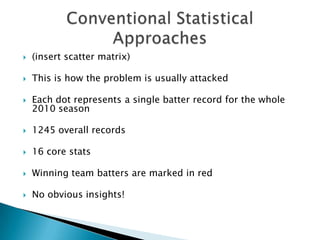
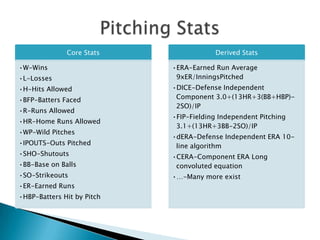
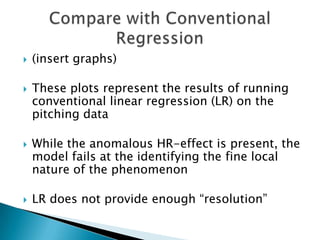
Salford Systems
   Dan Steinberg
Mikhail Golovnya
   Data mining is the search for patterns in data
    using modern highly automated, computer
    intensive methods

    ◦ Data mining may be best defined as the use of a specific
      class of tools (data mining methods) in the analysis of
      data

    ◦ The term “search” is key to this definition, as is
      “automated”

   The literature often refers to finding hidden
    information in data
Data Mining           Data Mining              Cont.

• Predictive         • Statistics         • OLAP
  Analytics          • Computer science   • CART
• Machine Learning   • Insurance          • SVM
• Pattern            • Finance            • NN
  Recognition        • Marketing          • CRISP-DM
• Artificial         • Robotics           • CRM
  Intelligence
                     • Biotech            • KDD
• Business
                     • Sports Analytics   • Etc.
  Intelligence
• Data Warehousing
   Data guides the analysis, it is the “Alpha and
    Omega” of everything you do

   Analyst asks the right questions but makes
    no assumptions

   The success of data mining solely depends on
    the quality of available data
    ◦ Famous “Garbage In – Garbage Out” principle
   (Insert visual aid)
   In a nutshell: Use historical data to gain
    insights and/or predictions on the new data
   Any game is the ultimate and unambiguous source of
    the quality data

    ◦ This is very different from the data availability and quality
      in other areas of research

   However, there is no universal agreement on the best
    way of organizing and summarizing the results in a
    numeric form

    ◦ Large number of various game statistics available

    ◦ Common sense and game rules are at the core

    ◦ Heated debates on which stats best describe the potential
      for a future win
   (insert screenshot of Baseball-reference.com)

   Available from many sources, including the
    Internet

   Player level: summarize performance in a season,
    post season, and entire career

   Team level: wins and losses

   Game level: most detailed
   (insert Sean Lahman website screenshot)

   Widely known public database

   Gathers baseball stats all the way back to
    1871

   Will use parts of it to illustrate the potential
    of data mining
   Focusing on the 2010 regular season performance in
    both leagues

   Have access to the player stats for the entire season
    organized in a flat table

   Define a measure of the overall player success simply
    by having the team winning its division

    ◦ Thus 6 out of 30 participating teams in 2010 are declared
      as success

   Question: Which of the player stats are associated
    with the team winning the division?
Core Stats              Derived Stats

•AB-At Bats                 •AVG-Batting Average H/AB
•R-Runs                     •TB-Total Bases
•H-Hits                      B1+2x2B+3x3B+4xHR
•2B-Doubles                 •SLG-Slugging TB/AB
•3B-Triples                 •OBP-On Base Percentage
•HR-Home Runs                (H+BB+HBP)/(AB+BB+SF+HBP)

•RBI-Runs Batted In         •OPS-On Base Plus Slugging OBP+SLG

•SB-Stolen Bases            •…-Many more exist

•CS-Caught Stealing
•BB-Base on Balls
•SO-Strikeouts
•SF-Sacrifice Flies
•HBP-Hit by pitch
   (insert scatter matrix)

   This is how the problem is usually attacked

   Each dot represents a single batter record for the whole
    2010 season

   1245 overall records

   16 core stats

   Winning team batters are marked in red

   No obvious insights!
   Leo Breiman, Jerome Friedman, Richard Olshen and
    Charles Stone

   Starting with CART in 1984, laid the foundation for tree-
    based modeling techniques

   Conduct deep look into all available data

   Point out most relevant variables and features

   Automatically identify optimal transformations

   Capable of extracting complex patterns going way beyond
    the traditional “single performance at a time” approach
   (insert graph)
   6 core batter stats were identified as most predictive

   About 20% of total variation can be directly associated with
    the batter stats

   The single plots show non-linear nature of many of the
    relationships

   Fine plot irregularities should be ignored

   Striking result: HR above 30 is associated with loosing the
    division

   Proceed by digging into pair-wise contribution plots
   (insert images)
   The colored area within each plot shows pairs
    that actually occur in the data

   Areas associated with contribution towards
    team win are marked in red

   Contributions towards team defeat are
    marked in blue
   (insert graphs)
   These two plots further highlight the rather
    unusual HR finding

   It is a well-known fact that batters aiming at
    a home run have higher number of strike-
    outs

   However, in 2010 regular season the HR-
    centered approach lead to a defeat!
   (insert graph)

   This plot represents two performance stats
    plotted against each other taken “as is” from
    the original data table

   Note the difficulty at discerning the identified
    HR X SO pattern visually because of “shadow”
    projections
   (Insert graphs)
   (Insert screen shot of Baseball-reference.com
    and standard pitching chart)

   Similar to batting stats

   Large number of derived stats exists
Core Stats                Derived Stats

•W-Wins                     •ERA-Earned Run Average
•L-Losses                    9xER/InningsPitched
•H-Hits Allowed             •DICE-Defense Independent
•BFP-Batters Faced           Component 3.0+(13HR+3(BB+HBP)-
                             2SO)/IP
•R-Runs Allowed
                            •FIP-Fielding Independent Pitching
•HR-Home Runs Allowed
                             3.1+(13HR+3BB-2SO)/IP
•WP-Wild Pitches
                            •dERA-Defense Independent ERA 10-
•IPOUTS-Outs Pitched         line algorithm
•SHO-Shutouts               •CERA-Component ERA Long
•BB-Base on Balls            convoluted equation
•SO-Strikeouts              •…-Many more exist
•ER-Earned Runs
•HBP-Batters Hit by Pitch
   (Insert charts)

   Started by feeding a complete set of available
    26 pitching stats for 2010 season
    performance

   Using top variable elimination followed by
    bottom variable elimination
    technique, reduced the list to only 8
    important stats
   (inset graphs)
   (insert graphs)

   Keep the strikeouts high and the base on
    balls low to win the division!
   (insert graphs)

   Remember that these are pitchers not batters

   More wild pitches, more home runs
    allowed, more strikeouts=>the division is
    won!
   (insert graph)

   Conventional plot IGNORES other dimensions
    which effectively project on top of each other

   As a result, there is a lot of confusion on the
    plot, making it difficult to see any pattern

   In contrast, TN dependence plot shows the
    given pair contribution AFTER the influence of
    other dimensions has been eliminated
   (insert graphs)

   These plots represent the results of running
    conventional linear regression (LR) on the
    pitching data

   While the anomalous HR-effect is present, the
    model fails at the identifying the fine local
    nature of the phenomenon

   LR does not provide enough “resolution”
   It appears that in the 2010 regular season Home Run
    driven strategy did not work!

   At least, this is what the data tells us, further
    understanding will require experts in the field

   Core stats have good explaining potential once put into
    true multivariate modeling framework

   Conventional statistics approaches do not have enough
    “resolution” to see the real details

   Modern Data Mining helps identifying realized patterns
    and allows quick and efficient check of the usefulness of
    various performance measures available to a manager or
    researcher
   NEVER FALL FOR THESE

   Absolute Powers- data mining will finally find and
    explain everything

   Gold Rush- with the right tool one can rip the stock-
    market or predict World-Series winner to become
    obscenely rich

   Quest for the Holy Grail- search for an algorithm that
    will always produce 100% accurate models

   Magic Wand- getting a complete solution from start
    to finish with a single button push
The End

Data mining for baseball new ppt

  • 1.
    Salford Systems Dan Steinberg Mikhail Golovnya
  • 2.
    Data mining is the search for patterns in data using modern highly automated, computer intensive methods ◦ Data mining may be best defined as the use of a specific class of tools (data mining methods) in the analysis of data ◦ The term “search” is key to this definition, as is “automated”  The literature often refers to finding hidden information in data
  • 3.
    Data Mining Data Mining Cont. • Predictive • Statistics • OLAP Analytics • Computer science • CART • Machine Learning • Insurance • SVM • Pattern • Finance • NN Recognition • Marketing • CRISP-DM • Artificial • Robotics • CRM Intelligence • Biotech • KDD • Business • Sports Analytics • Etc. Intelligence • Data Warehousing
  • 4.
    Data guides the analysis, it is the “Alpha and Omega” of everything you do  Analyst asks the right questions but makes no assumptions  The success of data mining solely depends on the quality of available data ◦ Famous “Garbage In – Garbage Out” principle
  • 5.
    (Insert visual aid)  In a nutshell: Use historical data to gain insights and/or predictions on the new data
  • 6.
    Any game is the ultimate and unambiguous source of the quality data ◦ This is very different from the data availability and quality in other areas of research  However, there is no universal agreement on the best way of organizing and summarizing the results in a numeric form ◦ Large number of various game statistics available ◦ Common sense and game rules are at the core ◦ Heated debates on which stats best describe the potential for a future win
  • 7.
    (insert screenshot of Baseball-reference.com)  Available from many sources, including the Internet  Player level: summarize performance in a season, post season, and entire career  Team level: wins and losses  Game level: most detailed
  • 8.
    (insert Sean Lahman website screenshot)  Widely known public database  Gathers baseball stats all the way back to 1871  Will use parts of it to illustrate the potential of data mining
  • 9.
    Focusing on the 2010 regular season performance in both leagues  Have access to the player stats for the entire season organized in a flat table  Define a measure of the overall player success simply by having the team winning its division ◦ Thus 6 out of 30 participating teams in 2010 are declared as success  Question: Which of the player stats are associated with the team winning the division?
  • 10.
    Core Stats Derived Stats •AB-At Bats •AVG-Batting Average H/AB •R-Runs •TB-Total Bases •H-Hits B1+2x2B+3x3B+4xHR •2B-Doubles •SLG-Slugging TB/AB •3B-Triples •OBP-On Base Percentage •HR-Home Runs (H+BB+HBP)/(AB+BB+SF+HBP) •RBI-Runs Batted In •OPS-On Base Plus Slugging OBP+SLG •SB-Stolen Bases •…-Many more exist •CS-Caught Stealing •BB-Base on Balls •SO-Strikeouts •SF-Sacrifice Flies •HBP-Hit by pitch
  • 11.
    (insert scatter matrix)  This is how the problem is usually attacked  Each dot represents a single batter record for the whole 2010 season  1245 overall records  16 core stats  Winning team batters are marked in red  No obvious insights!
  • 12.
    Leo Breiman, Jerome Friedman, Richard Olshen and Charles Stone  Starting with CART in 1984, laid the foundation for tree- based modeling techniques  Conduct deep look into all available data  Point out most relevant variables and features  Automatically identify optimal transformations  Capable of extracting complex patterns going way beyond the traditional “single performance at a time” approach
  • 13.
    (insert graph)  6 core batter stats were identified as most predictive  About 20% of total variation can be directly associated with the batter stats  The single plots show non-linear nature of many of the relationships  Fine plot irregularities should be ignored  Striking result: HR above 30 is associated with loosing the division  Proceed by digging into pair-wise contribution plots
  • 14.
    (insert images)  The colored area within each plot shows pairs that actually occur in the data  Areas associated with contribution towards team win are marked in red  Contributions towards team defeat are marked in blue
  • 15.
    (insert graphs)  These two plots further highlight the rather unusual HR finding  It is a well-known fact that batters aiming at a home run have higher number of strike- outs  However, in 2010 regular season the HR- centered approach lead to a defeat!
  • 16.
    (insert graph)  This plot represents two performance stats plotted against each other taken “as is” from the original data table  Note the difficulty at discerning the identified HR X SO pattern visually because of “shadow” projections
  • 17.
    (Insert graphs)
  • 18.
    (Insert screen shot of Baseball-reference.com and standard pitching chart)  Similar to batting stats  Large number of derived stats exists
  • 19.
    Core Stats Derived Stats •W-Wins •ERA-Earned Run Average •L-Losses 9xER/InningsPitched •H-Hits Allowed •DICE-Defense Independent •BFP-Batters Faced Component 3.0+(13HR+3(BB+HBP)- 2SO)/IP •R-Runs Allowed •FIP-Fielding Independent Pitching •HR-Home Runs Allowed 3.1+(13HR+3BB-2SO)/IP •WP-Wild Pitches •dERA-Defense Independent ERA 10- •IPOUTS-Outs Pitched line algorithm •SHO-Shutouts •CERA-Component ERA Long •BB-Base on Balls convoluted equation •SO-Strikeouts •…-Many more exist •ER-Earned Runs •HBP-Batters Hit by Pitch
  • 20.
    (Insert charts)  Started by feeding a complete set of available 26 pitching stats for 2010 season performance  Using top variable elimination followed by bottom variable elimination technique, reduced the list to only 8 important stats
  • 21.
    (inset graphs)
  • 22.
    (insert graphs)  Keep the strikeouts high and the base on balls low to win the division!
  • 23.
    (insert graphs)  Remember that these are pitchers not batters  More wild pitches, more home runs allowed, more strikeouts=>the division is won!
  • 24.
    (insert graph)  Conventional plot IGNORES other dimensions which effectively project on top of each other  As a result, there is a lot of confusion on the plot, making it difficult to see any pattern  In contrast, TN dependence plot shows the given pair contribution AFTER the influence of other dimensions has been eliminated
  • 25.
    (insert graphs)  These plots represent the results of running conventional linear regression (LR) on the pitching data  While the anomalous HR-effect is present, the model fails at the identifying the fine local nature of the phenomenon  LR does not provide enough “resolution”
  • 26.
    It appears that in the 2010 regular season Home Run driven strategy did not work!  At least, this is what the data tells us, further understanding will require experts in the field  Core stats have good explaining potential once put into true multivariate modeling framework  Conventional statistics approaches do not have enough “resolution” to see the real details  Modern Data Mining helps identifying realized patterns and allows quick and efficient check of the usefulness of various performance measures available to a manager or researcher
  • 27.
    NEVER FALL FOR THESE  Absolute Powers- data mining will finally find and explain everything  Gold Rush- with the right tool one can rip the stock- market or predict World-Series winner to become obscenely rich  Quest for the Holy Grail- search for an algorithm that will always produce 100% accurate models  Magic Wand- getting a complete solution from start to finish with a single button push
  • 28.