1. What are MLB teams Really Paying For?
Daniel Crago
Section #03 Rohit Gupta
Introduction
Growingup, as withmany Americanchildren, baseball hasalwaysbeenapartof mylife.I’ve
beenplayingbaseball since Iwasinthe thirdgrade all the waythroughcollege,here atUC Merced. As a
math major,the fact that baseball hassomanystatisticsandways to analyze aplayer’sgame,Ithought
thisprojectwouldbe a perfectopportunitytoanalyze the game Ilove.
The most primitive game of baseball datesall the waybackto the 1700s whena few English
conformistleaderssetupthe game eachSunday.Modernday baseball aswe know itoriginatedwhen
the National League formedin1876. When the AmericanLeague formedin1901, interleague matchups
and divisional competitionsbegan.Itwasnotuntil 1903 where we findthe firsteverWorldSeries
championshipwhenthe BostonAmericansdefeatedthe PittsburghPirates.Tothisdaybaseball
continuestobe America’spastime andhasa world-wide impactonfans.
As the industryof baseball continuestogrow,the amountof moneythatis putintothe sportis
huge.Everytime ClaytonKershawstepsonthe moundforthe Los AngelesDodgers,he ismaking
approximately$10,000,00. Evenif the Dodgerslose 30-0 that day,ClaytonKershaw goeshome awinner.
The financial implicationsof thesenumbersissomethingmanypeoplehave builtcontroversyoverand
believethatmostprofessional athletesearnwaytoomuch money.Inmyproject,I planto use statistics
fromthe Lahmandatabase to analyze how playersalariescorrelatewithactual playerperformance.The
lahmandatabase foundonline at http://www.seanlahman.com/baseball-archive/statistics/
and iscomprisedof statisticsdatingbackfrom1871 to 2014.
2. Goals
In thisprojectI intendtocompile the topsalariesof the 125 highestpaidplayers in2013 and
compare that to theirbattingavg (BA),winsabove replacement(WAR), sluggingpercentage(Total
bases/At-Bats),forhitters,andearnedrunaverage (ERA),andwins(W),forpitchers.These statisticswill
give a goodindicationof howwell the playerpreformsbothoffensivelyanddefensively,andwhether
the baseball teamtheyplayforistrulygettingtheirmoney’sworth. Ourquestionof interestistofind
out whetherornotthere iscorrelationbetweenaplayer’sactual performance andtheirsalary.We will
alsoidentifyanyoutliers,whichare identified asplayerswhomunder- orover-preformtheircontracts.
Methods
I approachedthisprojectbytakingthe top 125 salariesfrom2013 fromboth pitchersand
position players fromthe Lahmandatabase andextractedthemintoR. I thencalculatedeach position
player’sbattingaverage andsluggingpercentage,calculatedwinsandERA for pitchers, andcompiledit
intoan excel table forviewing.Thenusinglinearregressionmodels,Icompared these statisticsto
salariesof eachof these players.
Usingonline resources,Iwasable tofindthe outliersof the data.I identifiedoutliers,asplayers
whoeithergotpaidin the top 125 and eitherdidnotplaythe full season,orthose thatwere outside the
top 125 whomover-preformedtheircontracts.Withthese playersIalsofoundtheirWARfor position
players,andW and ERA forthe pitchers.
In R I was able tocompile differentsubsetsof datatoplotand analyze withthe “Pitching”,
“Batting”and “Salaries”dataframes.Inthe “Salaries”dataframe Ifirstsortedoutsalariesof the year
2013. Lookingonline,usingespn.com,Iwasable tofindthat the average salaryfor 2013, was 3.2M
dollars,soI thencreatedtwosubsetdataframes;one of playerswiththeirsalaryoverthe average,the
3. otherincludesdataof playersunderthe average salary.Whenanalyzingthe “Batting”dataframe,I
createdthe subsetof data inthe year2013, thenanothersubsetdataframe of playerswithatleast200
at-bats(AB)(league minforcomputing relevantbattingstatistics).Fromthat,Icomputeda final batting
dataframe of playerswitha battingaverage above the average battingaverage from2013, of .253. From
these dataframesIwasable to create histogramsandregressionanalysisof the datato compute the
correlationbetweenthe coefficients.
Results
Afterextractionof the datafrom the Lahman database project,Iwas able tocompile multiple subsetsof
data, showninthe code attached. I found that there waslittle tonocorrelationbetweensalariesand
playerperformance.Whenlookingatthe positionplayer’sstatistics, IfoundanR2
value of .0011 when
comparingbattingaverage tosalaries (Figure 2).There wasa slightlyhighercorrelation between
sluggingpercentage andsalaries (Figure1),R2
=.0042, butstill verylow,andnotnearlyhighenoughto
indicate thatplayerperformance correlateswithsalaries.
Figure 1. Slugging percentage vs. Salaries of the highest paid
72 position players. Correlation coefficient of R squared value
0.0042.
R² = 0.0042
0
0.1
0.2
0.3
0.4
0.5
0.6
0.7
0 20000000 40000000
Slugging%
Salaries
Slugging % VS. Salaries
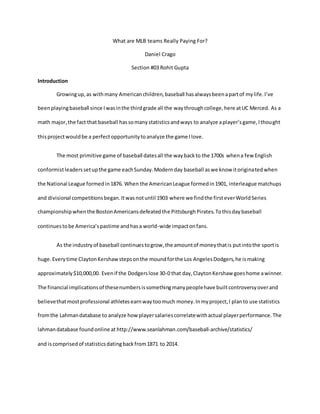
4. Figure 2. Batting average vs. Salaries of the highest paid 72 position players in 2013 with correlation coefficient of 0.0011.
Whenlookingoverthe pitchingstatistics, Ifound thatagain,there wasno correlationbetween
eitherERA or W andsalary.The computedcorrelationcoefficientforERA and salariesis0.0241 shownin
Figure 3 below.Whencomputingthe correlationcoefficientforwinsandsalarywe findaverysimilar
correlationcoefficientof 0.0252 (Figure 4).
Figure 3. Analysis of ERA vs Salary of highest paid 53 pitchers Figure 4. Analysis of Wins vs Salary of highest paid 53 pitchers in
in 2013 in 2013
R² = 0.0011
0
0.05
0.1
0.15
0.2
0.25
0.3
0.35
0.4
0 20000000 40000000
BattingAverage
Salaries
Batting AverageVS. Salaries
R² = 0.0241
0
1
2
3
4
5
6
7
8
0 10000000 20000000 30000000
ERA
Salaries
ERA VS Salaries
R² = 0.0252
0
5
10
15
20
0 10000000 20000000 30000000
Wins
Salaries
Wins Vs Salaries
5. Whenanalyzingthe salarydata, I found that there wasa strong skew towardsthe salariesover
5M dollarsandthendrops off towards15M dollars.We can see infigure 5 thatthere are over300
playersaroundthe league minimumsalaryof $500,000.
Figure 5. Salaries below the league average in 2013 of $3.2M Figure 6. Salaries above the league average in 2013 of $3.2M
Whenlookingatour outliersandanalyzingoutside datafoundatbaseballreference.comand
espn.com, Ifound thatthere were multipleplayerswhodidnotcomplete fullseasonsbutstillmade
millionsof dollarsfromtheircontracts.The highestpaidplayerinbaseballin2013, Alex Rodriguez,
made $29M, howeverhe onlyplayed44gamespriorto hissuspensionfor PerformanceEnhancingDrugs
(PEDs).Thismeansthatin 44 games,Alex made nearly$8Mdollars.OtherplayerssuchasRyan Howard
(PHI),DerekJeter(NYA),HanleyRamirez(LAD),JustinMorneau(MIN),andKevinYoukilis(NYA),all made
over$12M but failedtoplaymore than86 gamesdue to injury.Simplyputthese are playersthatdidnot
meettheircontractexpectations.The 4th
and 5th
highestpaidplayersin2013 were VernonWellsand
Mark Teixeiraof the NewYorkYankees.Theyhadbattingaveragesof 0.233 and0.151 respectively,
whichfallswell belowthe league average of 0.253.
Whenlookingoverthe pitchers,Ifoundthatthe secondhighestpaidplayerin2013, Johan
Santanadid nothave any documentedstats. IalsofoundthatJeff Weaver(30th
) andChrisCarpenter
(67th
) alsohad no stats forthe 2013 seasonbut still made over$12.5M. I foundthat there were more
6. pitcherswhosufferedinjuriesandwere unabletoperformthanthere were positionplayersinthe top
125 highestpaidplayers.
I was able tointerpretstats of the most under-paidormostefficientpositionplayersand
pitchers.Asshownbelow(Table 1) we cansee that these playersprovidedbattingaverageswell above
the league average,aswell as a WAR stat above 2. Mike Trout, wasclearlythe mostefficientplayerwith
10 winsabove replacement,andabattingaverage of .323. For the pitchers,(Table 2),we see the most
efficientpitcherin2013 wasFranciscoLirianowith16 Winswithan ERA of 2.88, witha contract of $1M.
Table 1. Position players out-preforming contract
Name Salary BA WAR
Mike trout 510000 0.323 10
Dionner Navarro 1750000 0.303 1.9
James Loney 2000000 0.299 2.2
Omar Infante 4000000 0.318 2.5
Yunel Escobar 5000000 0.256 3.3
Nick Punto 1500000 0.255 2.1
Marlon Byrd 700000 0.291 4.3
Ryan Rayburn 1000000 0.272 2.3
Chris Denorfia 2000000 0.279 3.6
Jose Altuve 500000 0.283 SLUG=0.363
Table 2. Pitchers out-preforming contract
Name Salary W/Save ERA
Francisco Liriano 1000000 16 2.88
Wade Miley 500000 10 3.55
Craig Kimbrel 500000 S=50 1.21
Chris Sale 500000 11 3.07
Mat Latos 4.6M 14 3.16
David Robertson 2.7M 5 Wins, 51
Holds
2.04
Matt Harrison 6.1 18 3.29
7. Discussion
Our resultsindicate one simple interpretation;money can’tbuyyouwinsinbaseball.When
lookingatoutliers,itisnotalwaysthe bestcontracts that will getyouthe bestplayersinbaseball,but
rather the playerswithbreakoutyears,endupwiththe highestcontractsthe followingyears.These
resultsimplicate thatbaseball will continue tohave anissue of an increasingpayroll andsalarycap,and
playerswho,inthe eyesof most,are earningwaymore thantheydeserve,andother“sleeper”players
havingbigyears, whomout-preformingtheircontracts.
Our data and correlationcoefficientsof all of ouranalysisindicate nocorrelationbetween
statisticsandthe salariesof players. Inorderto trulyunderstandthe extentof the information,we had
to extrapolate datafromoutside sourcestofullyunderstandhow teams andplayersfinalize contracts.
Conclusion
Our findings tellusthatinbaseball,there isnoreal indicatorof how much a playershouldmake;
it isall reallybasedonpreviousperformance andthe demandof the playerfromotherteams.General
Managers suchas BillyBeanfromthe OaklandAthletics hasattemptedtocome upwiththe formulato
winning, byacknowledgingthe factthatmoneycan’t alwaysbuyyouwins.Thisidea,knownas
sabermetrics,isthe future toformulatingwins.Asstatisticianswithalove forthe game continue to
analyze correlationssuchasthese,we mustfindbetternumbersandcoefficientsthatimplicate stronger
results.
References
http://mlb.mlb.com/mlb/history/mlb_history_teams.jsp
http://www.baseball-reference.com/players/
http://www.historyofbaseball.us/