Downloaded 195 times
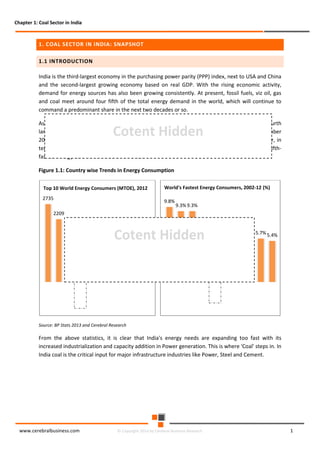

The document discusses the rapid evolution of the energy sector, emphasizing the shift from production management to risk management in the digital age. It introduces the Cerebral Business Research database, which supports businesses by providing insights on energy and infrastructure to maximize shareholder wealth. The text covers various detailed topics, including coal resources, global trends, production forecasts, and challenges faced by the industry.


