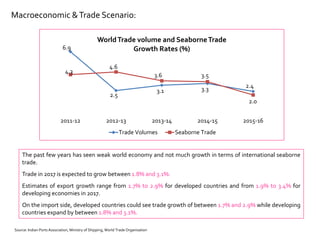
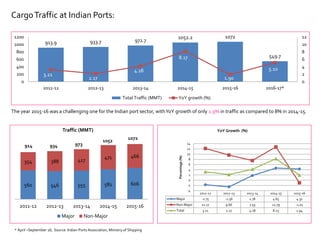
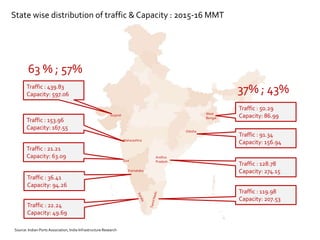
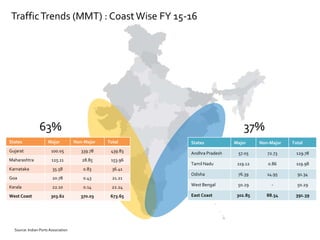
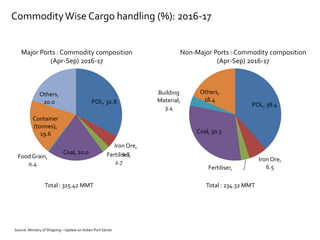
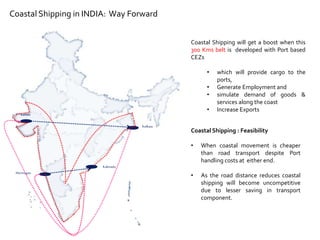
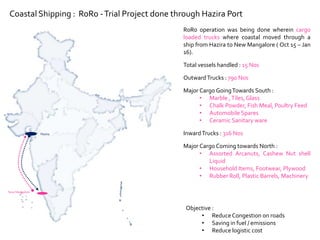
The Company of Master Mariners of India (CMMI)
Date: 01st April 2017
Presented by –
Capt.A K Singh
CEO – Adani Dahej & Hazira Port
Connecting IndiaThrough Shipping
INDIA
6.9
2.5
3.1 3.3
2.4
4.3
4.6
3.6 3.5
2.0
2011-12 2012-13 2013-14 2014-15 2015-16
WorldTrade volume and SeaborneTrade
Growth Rates (%)
Trade Volumes Seaborne Trade
The past few years has seen weak world economy and not much growth in terms of international seaborne
trade.
Trade in 2017 is expected to grow between 1.8% and 3.1%.
Estimates of export growth range from 1.7% to 2.9% for developed countries and from 1.9% to 3.4% for
developing economies in 2017.
On the import side, developed countries could see trade growth of between 1.7% and 2.9% while developing
countries expand by between 1.8% and 3.1%.
Macroeconomic &Trade Scenario:
Source: Indian Ports Association, Ministry of Shipping, World Trade Organisation
2011-12 2012-13 2013-14 2014-15 2015-16 2016-17*
Exports from India 21.8 -1.8 4.7 -1.2 -15.9 -1.7
Imports to India 32.3 0.3 -8.3 -0.6 -15.3 -13.7
-20
-10
0
10
20
30
40
Percentage(%)
Trend in India’s Export and Import growth rates
* April –September 16 ; Source: Indian Ports Association, Ministry of Shipping
Export & ImportTrends: India
ContainerTrafficTrend: India
2.45 2.76 3.2
3.91 4.33
4.98
6.14
7.39 7.67
9.01
9.75 10.28 10.27
10.88
11.65
12.54
13.79
15.17
16.69
18.36
20.20
22.22
2001 2002 2003 2004 2005 2006 2007 2008 2009 2010 2011 2012 2013 2014 2015 2016 2017 2018 2019 2020 2021 2022
India's ContainerVolume in MTEU
• Since FY 2001 India’s Container trade volume is growing @ 11.5 % CAGR. However after great recession in FY
2009, market has grown @CAGR 7 %.
• Looking in to other conducive factor for container growth and India’s thrust on manufacturing sector, future
expected container volume in next 5 year i.e. FY 2022 shall be around 22.22 MTEU.
Source: World Bank Statistics 2017
CAGR 11.5 %
Estimated CAGR @ 10 %
CAGR 7 %
913.9 933.7 972.7
1052.2 1072
549.7
3.21
2.17
4.18
8.17
1.90
5.10
0
2
4
6
8
10
12
0
200
400
600
800
1000
1200
2011-12 2012-13 2013-14 2014-15 2015-16 2016-17*
Total Traffic (MMT) YoY growth (%)
CargoTraffic at Indian Ports:
2011-12 2012-13 2013-14 2014-15 2015-16
Major -1.75 -2.56 1.78 4.65 4.32
Non-Major 12.17 9.66 7.55 12.79 -1.01
Total 3.21 2.17 4.18 8.25 1.94
-4
-2
0
2
4
6
8
10
12
14
Percentage(%)
YoY Growth (%)
560 546 555 581 606
354 388 417
471 466
2011-12 2012-13 2013-14 2014-15 2015-16
Major Non-Major
914 934 973
1052
1072
The year 2015-16 was a challenging one for the Indian port sector, withYoY growth of only 1.9% in traffic as compared to 8% in 2014-15.
Traffic (MMT)
* April –September 16; Source: Indian Ports Association, Ministry of Shipping
Gujarat
Traffic : 439.83
Capacity: 597.06
State wise distribution of traffic & Capacity : 2015-16 MMT
Maharashtra
Traffic : 153.96
Capacity: 167.55
Goa
Traffic : 21.21
Capacity: 63.09
Karnataka
Traffic : 36.41
Capacity: 94.26
Traffic : 22.24
Capacity: 49.69
West
Bengal
Traffic : 50.29
Capacity: 86.99
Odisha
Traffic : 91.34
Capacity: 156.94
Andhra
Pradesh
Traffic : 128.78
Capacity: 274.15
Traffic : 119.98
Capacity: 207.53
63 % ; 57%
37% ; 43%
Source: Indian Ports Association, India Infrastructure Research
States Major Non-Major Total
Gujarat 100.05 339.78 439.83
Maharashtra 125.11 28.85 153.96
Karnataka 35.58 0.83 36.41
Goa 20.78 0.43 21.21
Kerala 22.10 0.14 22.24
West Coast 303.62 370.03 673.65
States Major Non-Major Total
Andhra Pradesh 57.05 72.73 129.78
Tamil Nadu 119.12 0.86 119.98
Odisha 76.39 14.95 91.34
West Bengal 50.29 - 50.29
East Coast 302.85 88.54 391.39
63% 37%
TrafficTrends (MMT) : CoastWise FY 15-16
Source: Indian Ports Association
POL, 32.8
Iron Ore,
4.5Fertiliser,
2.7
Coal, 20.0
Food Grain,
0.4
Container
(tonnes),
19.6
Others,
20.0 POL, 38.4
Iron Ore,
6.5Fertiliser,
3.0
Coal, 30.3
Building
Material,
3.4
Others,
18.4
Non-Major Ports : Commodity composition
(Apr-Sep) 2016-17
Major Ports : Commodity composition
(Apr-Sep) 2016-17
CommodityWise Cargo handling (%): 2016-17
Total : 315.42 MMT Total : 234.32 MMT
Source: Ministry of Shipping – Update on Indian Port Sector
CapacityTrends : Indian Ports
697 745 801 872 965
549 568
599
659
751
2011-12 2012-13 2013-14 2014-15 2015-16
Major Non-Major
In MMT
1245 1313 1400
1530
1716
Year Major Non-Major Total
2012-13 48.38 19.13 67.51
2013-14 55.61 31.57 87.18
2014-15 71.00 59.24 130.24
2015-16 93.84 92.07 185.97
Total addition 268.83 202.01 470.84
Target forTwelfth Plan 526.44 912.77 1439.21
Achievement (%) 51.07 22.13 32.72
Year wise capacity addition during first four years of twelfth
Plan (2012-17)
• Overall capacity increased from 1245 MMT in 2011-12 to more than 1700 MMT in 2015-16 at a CAGR of 8.35%
• Out of the total capacity in 2015-16, major and non-major ports accounted for 56 % & 44% respectively.
• Only 33% of the capacity addition target for theTwelfth Plan have been met till 2015-16.
Source: Indian Ports Association, Ministry of Shipping & India Infrastructure Research
Indian Ports :Traffic & Capacity Projections
Mundra Kandla
Mumbai
JNPT
Mormugao
NewMangalore
Cochin
Tuticorin
Chennai
Ennore
Visakhapatnam
Paradip
Kolkata
Dhamra
Kakinada
Krishnapatnam
Dahej
Hazira
Tuna
Nargol
Yogayatan
Vijaydurg
Tadadi
Azhikkal
Ponnani
Vizhinjam
Machilipatnam
Bhavanapadu
Astaranga
Chudamani
Subarnarekha
FY 15-16 Actuals
Traffic : 1072 MMT
Capacity: 1716 MMT
FY 24-25 Projections
Traffic : 2500 MMT
Capacity: 3036 MMT
Source: Sagarmala Report, Ministry of Shipping
Existing Ports
New Ports
Hinterland Mapping : Indian Ports
• India spends around 14.4% of its GDP on
logistics and transportation as compared to
less than 8% spent by the other developing
countries.
• Indian freight transport market is expected to
grow at a CAGR of 13.35% by 2020 driven by
the growth in the manufacturing, retail, FMCG
and e-commerce sectors.
• Road freight accounts for 54% and railways
33% of the cargo transported in the country.
• 22% is the Rail share for cargo evacuation
through ports.
Kandla
Mumbai
JNPT
Mormugao
NewMangalore
Cochin
Tuticorin
Chennai
Ennore
Visakhapatnam
Paradip
Kolkata
Dhamra
Kakinada
Krishnapatnam
Mundra
Dahej
Hazira
Nargol
Yogayatan
Vijaydurg
Tadadi
Azhikkal
Ponnani
Vizhinjam
Machilipatnam
Bhavanapadu
Astaranga
Chudamani
Subarnarekha
------- 300 Kms
• In Europe, Port of Rotterdam serves as major
gateway and is the largest port in the region.
• The port serves a hinterland of over
1,600 km catering to almost a 500 million
population in the European market.
• Extensive network of road, rail, pipelines and inland
waterways connects it to different parts of Europe,
port of Rotterdam is the largest port in Europe with
an annual throughput of 450 million tonnes
Hinterland Connectivity: Rotterdam port logistics network
• More than 250 intermodal weekly rail services transport containers, dry bulk, general cargo and chemical products.
About 80 inland terminals are linked to this system.
• The Port also has an extensive pipeline network of 1500 km that offers an efficient, safe and environmental friendly
transport solution for liquid bulk such as crude oil and oil products.
• It has more than 45 chemical companies and 5 refineries, making it one of the largest oil and chemical centers of
the world.
• Port is supported by a strong industrial cluster, accounting over 55% of the revenue of the port of Rotterdam and
about 40% of net value addition.
Source: Presentation titled as “Global Hub & Industrial Cluster in Europe Expertgroup Euro-Asian Transport Linkages”, Port of Rotterdam 2015.
Source: https://www.portofrotterdam.com/en/downloads/127
Impact of Dedicated Freight Corridor (DFC):
• DFC is expected to change the current practice of moving
containers (i.e. source to destination model) to hub –and – spoke
model.
• Ports in Gujarat and Maharashtra are expected to substantially
benefit once the DFC comes up. Railways, however needs to
build dedicated freight lines from the main production centres.
• CONCOR has planned 15 integrated logistics hubs along DFC
alignment which will provide multi-modal connectivity as well as
third party logistics services.
Source: Dedicated Freight Corridor Corporation of India Ltd, Container Corporation of India Ltd
• The Sagarmala is a series of projects to leverage the country’s
coastline and inland waterways to drive industrial
development.
• The project is mammoth with 150 initiatives with a total outlay
of ₹4 lakh crore, spread across four broad areas –
1. modernise port infrastructure, add up to six new ports and
enhance capacity.
2. improve port connectivity through rail corridors, freight-
friendly expressways and inland waterways.
3. create 14 coastal economic zones or CEZs and a special
economic zone at Jawaharlal Nehru Port Trust in Mumbai
with manufacturing clusters to enable port-led
industrialisation.
4. develop skills of fishermen and other coastal and island
communities.
Indian Government Plans: Sagarmala Project
Source: Sagarmala Report, Ministry of Shipping
Indian Government Plans: Sagarmala Project
Proposed CEZ in Sagarmala
Source: Sagarmala Report, Ministry of Shipping
Boost development through ports and shipping-
• Develop three to four new mega ports
• Develop a world-class transshipment port with a
capacity of more than 10 millionTEU
• Create additional capacity of 1,200–1,500 MMTPA
by strengthening existing ports
• Develop maritime and manufacturing clusters
around the ports
• Develop 2–3 port-based smart cities (Kandla &
Paradip) and (14) Coastal Economic Zones
Case study : Jebel Ali Free Zone (jafza) , Dubai
• Jafza, the trade catalyst, has evolved into a unique
trade ecosystem that reduces cost, while enabling new
opportunities for growth.
• Started in 1985, it has matured into an ever expanding
business platform that is ready for today.
• From a small operation of just 19 companies into a
thriving business community with over 7,000 companies
that continues to expand.
• Today, Jafza is a dynamic base for thousands of
businesses -
o from over 100 countries, sustaining over 144,000
jobs
o attracting more than 32% of the UAE’s foreign
direct investment;
o all the while exceeding 50% of Dubai’s total
exports, with an phenomenal value for trade of
$87.6 billion.
Source: www.jafza.ae
Case study : Shenzhen Special Economic Zone, China
Source: Ministry of Shipping
• Shenzhen Special Economic Zone established in May 1979 is the
first SEZ in China.
• China further established three SEZs in 1979 to experiment with new
economic approaches at Xiamen, Shantou and Zhuhai. These SEZs
were trail-blazers in successful economic strategies, which were
adopted nationwide in China over time.
DRIVERS:
• Export led development
• Funded & pushed mostly by local governments
• Fixed 15% income tax applied to partly foreign owned
enterprises in Shenzhen as opposed to 33% in rest of China
• Companies were also given exemptions from other local taxes
& were allowed to export goods duty-free
• Capacity built well ahead of demand
Impact:
• 7 millions new jobs created
• GDP grew more than 50x to Yuan 1.60 trillion in 2014 from Yuan
23.1 billion in 1980
• Port throughput grown to 24.14 millionTEUs (2015)
From 1990-2010, the total employment at Shenzhen increased at a CAGR
of 8% as compared to 1% in China & Hong Kong
Integrated Infrastructure
• Offering land in SEZ, DTA and FTWZ with cluster based zoning
• Excellent integrated utilities such as power, water, CETP
• Quality social infrastructure facilities - housing, education, healthcare and
recreation
• Multi-modal connectivity with sea, air, rail and road linkages
Mundra
The Mundra template for port based manufacturing center:
 Total SEZ area : 2733 Ha
 LOI awarded : 42 Nos
 Cargo FY 16-17 : 15729 TEUs (Import :
4917; Export : 10812)
 Employment Generated : Approx.
43000
Smart Port: Hamburg Port Authority’s “smartPORT” initiative
Under the smartPORT initiative, Hamburg Port Authority (HPA) has initiated three major strategy to make port
smarter and world class facility.
Three main component of this initiative are
(1) smartPORT logistics,
(2) Smart mobility and
(3) smartPORT energy
smartPORT logistics : GPS sensors, Inductive loops and detectors were installed for capturing traffic
volumes, the type of vehicles and their speeds.The data collected is transmitted to
the Port Road Management Centre where it is processed to determine current traffic
conditions on the port's roads.
Source: presentation “smartPORT energy Port of Hamburg – efficient and environmentally friendly” by Lutz M. Birke, Hamburger Port Authority, June 2015
Smart mobility : 8 e-AGV(automatic guided vehicle) at the Container terminal, Altenwerder
92 e-cars in use in the port
1,450 e-cars in the metropolitan region of Hamburg
Source: presentation “smartPORT energy Port of Hamburg – efficient and environmentally friendly” by Lutz M. Birke, Hamburger Port Authority, June 2015
smartPORT energy : The Port is harnessing wind energy by operating wind power plants onsite and
has also installed solar thermal collectors and photovoltaics on the roof tops to
generate solar power.
Three defined primary project aims for smartPORT energy are –
1) Reduce dependency on conventionally generated energy
2) Reduce energy consumption and energy costs
3) Reduce emissions
Smart Port: Hamburg Port Authority’s “smartPORT” initiative
Renewable Energy: OffshoreWind Mills
European Union 2016 annual figures:
• 12.5 GW of new wind power capacity was installed
and grid-connected in the EU during 2016, a decrease
of 3% compared to 2015 annual installations. 10,923
MW were installed onshore, and 1,567 MW were
installed offshore.
• Wind power accounted for 51% of total power capacity
installations in 2016.
FOWIND (Facilitating Offshore Wind in India) : The project focuses on the States of Gujarat and Tamil Nadu for
identification of potential zones for development through techno-commercial analysis and preliminary resource
assessment.
FOWIND activities will also help facilitate a platform to stimulate offshore wind related R&D activities in the country.
• Renewable energy accounted for 86% of all new EU power installations in 2016. (In 2013, capacity addition in
renewable energy segment overtook additions in fossil fuelled sector).
• Wind power covered 10.40% of the EU’s electricity demand.
• €27.5 billion were invested in 2016 to finance wind energy development. This was 5% more than the
total investment in 2015.
Source: www.fowind.in, The European Wind Energy Association
INDIA
CHINA
AUSTRALIA
GERMANY
Coastal Shipping: INDIA v/sWorld
• At present, just 6% of freight transported in India is carried by coastal shipping and inland waterways; the
comparative share in Germany and China is 11% and 24%, respectively.
• Thermal coal alone accounts for around
61 percent of the freight volume on the
Indian Railways and 24 percent of the
seaport freight mix.Water borne cargo
currently contributes less than
10 percent to India's modal mix.
• China uses its inland waterways to
transport raw material and finished
goods between Eastern andWestern
provinces; water contributes 24 percent
to China's freight modal mix.
• Australia carries 17 percent of goods through
coastal shipping.
• In Germany, 11 percent of goods are moved through inland waterways and coastal shipping.
Source: Ministry of Shipping & other secondary sources
Coastal Shipping in INDIA:
• Major Ports handle 75 percent of the coastal cargo, which are largely made up of crude, POL and coal. Ports like
Vizag, Paradip, Mumbai, Ennore and Haldia together are handling two third of the inland coasting trade
cosigned to all major ports.
• Minor ports between them handle a quarter of inland coasting trade consignments of which POL, cement,
building material and iron ore account for 90 percent.
Coastal Movement of commodities –
Commodity Origin – Destination Port
CRUDE OIL
Originating ports are from Mumbai, Rawa and Cuddalore and the discharge ports are to
Vizag, Cochin, Chennai and Kandla.
POL products
Originate at major ports and at Sikka with sources being Jamnagar, New Mangalore,
Mumbai, Cochin, Paradip, Vizag, Chennai and Haldia, where refineries are situated. The key
destinations areVizag, Kandla, Haldia and Mumbai.
COAL Originating ports are Paradip,Vizag, Haldia and the discharge ports are Chennai,Tuticorin.
IRON ORE
Originating ports are Vizag and Mormugao and the discharge ports are Magdalla, Dhramtar
and Revdanda.
CEMENT
Originating ports are Muldwarka, Porbunder, Jafarabad, Pipavav and discharge ports are
Dharmtar, Ulwa Belapur, JNP, Ratnagiri, Magdalla, New Mangalore and Cochin.
IRON & STEEL is moving from Magdalla to Mumbai and GPPL.
Source: Ministry of Shipping & other secondary sources
Coastal Shipping in INDIA: Way Forward
• The shipping ministry plans to offer companies an incentive of Rs.1 per tonne per km to transport goods through
inland waterways and coastal shipping.
• A shift from roads and railways to coastal shipping and inland waterways could lead to emission savings of about
3.5% in the freight transport sector.
• The proposed incentive would also help to increase transportation by coastal shipping from 6 to
12% in a span of a decade and result in potential savings of Rs.35,000-40,000 crores.
• To reach this target, the shipping ministry will now take several steps like –
• moving to larger barges
• use of liquefied natural gas instead of diesel barges
• dedicated berths,
• bunkering and storage capacities
at relevant ports for commodities to be transported through coastal and inland waterways.
• According to the shipping ministry, transportation by waterways would cost 25 paisa per km, by rail
and road it’s Rs.1.50 and Rs.2.50, respectively.
• In terms of fuel efficiency, too, waterways compare favourably: one horsepower can ferry four tonnes of cargo by
waterways, while the equivalent is 150kg and 500kg by road and rail, respectively.
Source: Ministry of Shipping & other secondary sources
Coastal Shipping in INDIA: Way Forward
Kandla
Mormugao
Kolkata
Kakinada
Coastal Shipping will get a boost when this
300 Kms belt is developed with Port based
CEZs
• which will provide cargo to the
ports,
• Generate Employment and
• simulate demand of goods &
services along the coast
• Increase Exports
Coastal Shipping : Feasibility
• When coastal movement is cheaper
than road transport despite Port
handling costs at either end.
• As the road distance reduces coastal
shipping will become uncompetitive
due to lesser saving in transport
component.
Coastal Shipping : RoRo -Trial Project done through Hazira Port
NewMangalore
Hazira
RoRo operation was being done wherein cargo
loaded trucks where coastal moved through a
ship from Hazira to New Mangalore ( Oct 15 – Jan
16).
Total vessels handled : 15 Nos
OutwardTrucks : 790 Nos
Major Cargo GoingTowards South :
• Marble ,Tiles, Glass
• Chalk Powder, Fish Meal, Poultry Feed
• Automobile Spares
• Ceramic Sanitary ware
InwardTrucks : 316 Nos
Major Cargo Coming towards North :
• Assorted Arcanuts, Cashew Nut shell
Liquid
• Household Items, Footwear, Plywood
• Rubber Roll, Plastic Barrels, Machinery
Objective :
• ReduceCongestion on roads
• Saving in fuel / emissions
• Reduce logistic cost
CMMI - Connecting India Through Shipping

CMMI - Connecting India Through Shipping

  • 1.
    The Company ofMaster Mariners of India (CMMI) Date: 01st April 2017 Presented by – Capt.A K Singh CEO – Adani Dahej & Hazira Port Connecting IndiaThrough Shipping INDIA
  • 2.
    6.9 2.5 3.1 3.3 2.4 4.3 4.6 3.6 3.5 2.0 2011-122012-13 2013-14 2014-15 2015-16 WorldTrade volume and SeaborneTrade Growth Rates (%) Trade Volumes Seaborne Trade The past few years has seen weak world economy and not much growth in terms of international seaborne trade. Trade in 2017 is expected to grow between 1.8% and 3.1%. Estimates of export growth range from 1.7% to 2.9% for developed countries and from 1.9% to 3.4% for developing economies in 2017. On the import side, developed countries could see trade growth of between 1.7% and 2.9% while developing countries expand by between 1.8% and 3.1%. Macroeconomic &Trade Scenario: Source: Indian Ports Association, Ministry of Shipping, World Trade Organisation
  • 3.
    2011-12 2012-13 2013-142014-15 2015-16 2016-17* Exports from India 21.8 -1.8 4.7 -1.2 -15.9 -1.7 Imports to India 32.3 0.3 -8.3 -0.6 -15.3 -13.7 -20 -10 0 10 20 30 40 Percentage(%) Trend in India’s Export and Import growth rates * April –September 16 ; Source: Indian Ports Association, Ministry of Shipping Export & ImportTrends: India
  • 4.
    ContainerTrafficTrend: India 2.45 2.763.2 3.91 4.33 4.98 6.14 7.39 7.67 9.01 9.75 10.28 10.27 10.88 11.65 12.54 13.79 15.17 16.69 18.36 20.20 22.22 2001 2002 2003 2004 2005 2006 2007 2008 2009 2010 2011 2012 2013 2014 2015 2016 2017 2018 2019 2020 2021 2022 India's ContainerVolume in MTEU • Since FY 2001 India’s Container trade volume is growing @ 11.5 % CAGR. However after great recession in FY 2009, market has grown @CAGR 7 %. • Looking in to other conducive factor for container growth and India’s thrust on manufacturing sector, future expected container volume in next 5 year i.e. FY 2022 shall be around 22.22 MTEU. Source: World Bank Statistics 2017 CAGR 11.5 % Estimated CAGR @ 10 % CAGR 7 %
  • 5.
    913.9 933.7 972.7 1052.21072 549.7 3.21 2.17 4.18 8.17 1.90 5.10 0 2 4 6 8 10 12 0 200 400 600 800 1000 1200 2011-12 2012-13 2013-14 2014-15 2015-16 2016-17* Total Traffic (MMT) YoY growth (%) CargoTraffic at Indian Ports: 2011-12 2012-13 2013-14 2014-15 2015-16 Major -1.75 -2.56 1.78 4.65 4.32 Non-Major 12.17 9.66 7.55 12.79 -1.01 Total 3.21 2.17 4.18 8.25 1.94 -4 -2 0 2 4 6 8 10 12 14 Percentage(%) YoY Growth (%) 560 546 555 581 606 354 388 417 471 466 2011-12 2012-13 2013-14 2014-15 2015-16 Major Non-Major 914 934 973 1052 1072 The year 2015-16 was a challenging one for the Indian port sector, withYoY growth of only 1.9% in traffic as compared to 8% in 2014-15. Traffic (MMT) * April –September 16; Source: Indian Ports Association, Ministry of Shipping
  • 6.
    Gujarat Traffic : 439.83 Capacity:597.06 State wise distribution of traffic & Capacity : 2015-16 MMT Maharashtra Traffic : 153.96 Capacity: 167.55 Goa Traffic : 21.21 Capacity: 63.09 Karnataka Traffic : 36.41 Capacity: 94.26 Traffic : 22.24 Capacity: 49.69 West Bengal Traffic : 50.29 Capacity: 86.99 Odisha Traffic : 91.34 Capacity: 156.94 Andhra Pradesh Traffic : 128.78 Capacity: 274.15 Traffic : 119.98 Capacity: 207.53 63 % ; 57% 37% ; 43% Source: Indian Ports Association, India Infrastructure Research
  • 7.
    States Major Non-MajorTotal Gujarat 100.05 339.78 439.83 Maharashtra 125.11 28.85 153.96 Karnataka 35.58 0.83 36.41 Goa 20.78 0.43 21.21 Kerala 22.10 0.14 22.24 West Coast 303.62 370.03 673.65 States Major Non-Major Total Andhra Pradesh 57.05 72.73 129.78 Tamil Nadu 119.12 0.86 119.98 Odisha 76.39 14.95 91.34 West Bengal 50.29 - 50.29 East Coast 302.85 88.54 391.39 63% 37% TrafficTrends (MMT) : CoastWise FY 15-16 Source: Indian Ports Association
  • 8.
    POL, 32.8 Iron Ore, 4.5Fertiliser, 2.7 Coal,20.0 Food Grain, 0.4 Container (tonnes), 19.6 Others, 20.0 POL, 38.4 Iron Ore, 6.5Fertiliser, 3.0 Coal, 30.3 Building Material, 3.4 Others, 18.4 Non-Major Ports : Commodity composition (Apr-Sep) 2016-17 Major Ports : Commodity composition (Apr-Sep) 2016-17 CommodityWise Cargo handling (%): 2016-17 Total : 315.42 MMT Total : 234.32 MMT Source: Ministry of Shipping – Update on Indian Port Sector
  • 9.
    CapacityTrends : IndianPorts 697 745 801 872 965 549 568 599 659 751 2011-12 2012-13 2013-14 2014-15 2015-16 Major Non-Major In MMT 1245 1313 1400 1530 1716 Year Major Non-Major Total 2012-13 48.38 19.13 67.51 2013-14 55.61 31.57 87.18 2014-15 71.00 59.24 130.24 2015-16 93.84 92.07 185.97 Total addition 268.83 202.01 470.84 Target forTwelfth Plan 526.44 912.77 1439.21 Achievement (%) 51.07 22.13 32.72 Year wise capacity addition during first four years of twelfth Plan (2012-17) • Overall capacity increased from 1245 MMT in 2011-12 to more than 1700 MMT in 2015-16 at a CAGR of 8.35% • Out of the total capacity in 2015-16, major and non-major ports accounted for 56 % & 44% respectively. • Only 33% of the capacity addition target for theTwelfth Plan have been met till 2015-16. Source: Indian Ports Association, Ministry of Shipping & India Infrastructure Research
  • 10.
    Indian Ports :Traffic& Capacity Projections Mundra Kandla Mumbai JNPT Mormugao NewMangalore Cochin Tuticorin Chennai Ennore Visakhapatnam Paradip Kolkata Dhamra Kakinada Krishnapatnam Dahej Hazira Tuna Nargol Yogayatan Vijaydurg Tadadi Azhikkal Ponnani Vizhinjam Machilipatnam Bhavanapadu Astaranga Chudamani Subarnarekha FY 15-16 Actuals Traffic : 1072 MMT Capacity: 1716 MMT FY 24-25 Projections Traffic : 2500 MMT Capacity: 3036 MMT Source: Sagarmala Report, Ministry of Shipping Existing Ports New Ports
  • 11.
    Hinterland Mapping :Indian Ports • India spends around 14.4% of its GDP on logistics and transportation as compared to less than 8% spent by the other developing countries. • Indian freight transport market is expected to grow at a CAGR of 13.35% by 2020 driven by the growth in the manufacturing, retail, FMCG and e-commerce sectors. • Road freight accounts for 54% and railways 33% of the cargo transported in the country. • 22% is the Rail share for cargo evacuation through ports. Kandla Mumbai JNPT Mormugao NewMangalore Cochin Tuticorin Chennai Ennore Visakhapatnam Paradip Kolkata Dhamra Kakinada Krishnapatnam Mundra Dahej Hazira Nargol Yogayatan Vijaydurg Tadadi Azhikkal Ponnani Vizhinjam Machilipatnam Bhavanapadu Astaranga Chudamani Subarnarekha ------- 300 Kms
  • 12.
    • In Europe,Port of Rotterdam serves as major gateway and is the largest port in the region. • The port serves a hinterland of over 1,600 km catering to almost a 500 million population in the European market. • Extensive network of road, rail, pipelines and inland waterways connects it to different parts of Europe, port of Rotterdam is the largest port in Europe with an annual throughput of 450 million tonnes Hinterland Connectivity: Rotterdam port logistics network • More than 250 intermodal weekly rail services transport containers, dry bulk, general cargo and chemical products. About 80 inland terminals are linked to this system. • The Port also has an extensive pipeline network of 1500 km that offers an efficient, safe and environmental friendly transport solution for liquid bulk such as crude oil and oil products. • It has more than 45 chemical companies and 5 refineries, making it one of the largest oil and chemical centers of the world. • Port is supported by a strong industrial cluster, accounting over 55% of the revenue of the port of Rotterdam and about 40% of net value addition. Source: Presentation titled as “Global Hub & Industrial Cluster in Europe Expertgroup Euro-Asian Transport Linkages”, Port of Rotterdam 2015.
  • 13.
  • 14.
    Impact of DedicatedFreight Corridor (DFC): • DFC is expected to change the current practice of moving containers (i.e. source to destination model) to hub –and – spoke model. • Ports in Gujarat and Maharashtra are expected to substantially benefit once the DFC comes up. Railways, however needs to build dedicated freight lines from the main production centres. • CONCOR has planned 15 integrated logistics hubs along DFC alignment which will provide multi-modal connectivity as well as third party logistics services. Source: Dedicated Freight Corridor Corporation of India Ltd, Container Corporation of India Ltd
  • 15.
    • The Sagarmalais a series of projects to leverage the country’s coastline and inland waterways to drive industrial development. • The project is mammoth with 150 initiatives with a total outlay of ₹4 lakh crore, spread across four broad areas – 1. modernise port infrastructure, add up to six new ports and enhance capacity. 2. improve port connectivity through rail corridors, freight- friendly expressways and inland waterways. 3. create 14 coastal economic zones or CEZs and a special economic zone at Jawaharlal Nehru Port Trust in Mumbai with manufacturing clusters to enable port-led industrialisation. 4. develop skills of fishermen and other coastal and island communities. Indian Government Plans: Sagarmala Project Source: Sagarmala Report, Ministry of Shipping
  • 16.
    Indian Government Plans:Sagarmala Project Proposed CEZ in Sagarmala Source: Sagarmala Report, Ministry of Shipping Boost development through ports and shipping- • Develop three to four new mega ports • Develop a world-class transshipment port with a capacity of more than 10 millionTEU • Create additional capacity of 1,200–1,500 MMTPA by strengthening existing ports • Develop maritime and manufacturing clusters around the ports • Develop 2–3 port-based smart cities (Kandla & Paradip) and (14) Coastal Economic Zones
  • 17.
    Case study :Jebel Ali Free Zone (jafza) , Dubai • Jafza, the trade catalyst, has evolved into a unique trade ecosystem that reduces cost, while enabling new opportunities for growth. • Started in 1985, it has matured into an ever expanding business platform that is ready for today. • From a small operation of just 19 companies into a thriving business community with over 7,000 companies that continues to expand. • Today, Jafza is a dynamic base for thousands of businesses - o from over 100 countries, sustaining over 144,000 jobs o attracting more than 32% of the UAE’s foreign direct investment; o all the while exceeding 50% of Dubai’s total exports, with an phenomenal value for trade of $87.6 billion. Source: www.jafza.ae
  • 18.
    Case study :Shenzhen Special Economic Zone, China Source: Ministry of Shipping • Shenzhen Special Economic Zone established in May 1979 is the first SEZ in China. • China further established three SEZs in 1979 to experiment with new economic approaches at Xiamen, Shantou and Zhuhai. These SEZs were trail-blazers in successful economic strategies, which were adopted nationwide in China over time. DRIVERS: • Export led development • Funded & pushed mostly by local governments • Fixed 15% income tax applied to partly foreign owned enterprises in Shenzhen as opposed to 33% in rest of China • Companies were also given exemptions from other local taxes & were allowed to export goods duty-free • Capacity built well ahead of demand Impact: • 7 millions new jobs created • GDP grew more than 50x to Yuan 1.60 trillion in 2014 from Yuan 23.1 billion in 1980 • Port throughput grown to 24.14 millionTEUs (2015) From 1990-2010, the total employment at Shenzhen increased at a CAGR of 8% as compared to 1% in China & Hong Kong
  • 19.
    Integrated Infrastructure • Offeringland in SEZ, DTA and FTWZ with cluster based zoning • Excellent integrated utilities such as power, water, CETP • Quality social infrastructure facilities - housing, education, healthcare and recreation • Multi-modal connectivity with sea, air, rail and road linkages Mundra The Mundra template for port based manufacturing center:  Total SEZ area : 2733 Ha  LOI awarded : 42 Nos  Cargo FY 16-17 : 15729 TEUs (Import : 4917; Export : 10812)  Employment Generated : Approx. 43000
  • 20.
    Smart Port: HamburgPort Authority’s “smartPORT” initiative Under the smartPORT initiative, Hamburg Port Authority (HPA) has initiated three major strategy to make port smarter and world class facility. Three main component of this initiative are (1) smartPORT logistics, (2) Smart mobility and (3) smartPORT energy smartPORT logistics : GPS sensors, Inductive loops and detectors were installed for capturing traffic volumes, the type of vehicles and their speeds.The data collected is transmitted to the Port Road Management Centre where it is processed to determine current traffic conditions on the port's roads. Source: presentation “smartPORT energy Port of Hamburg – efficient and environmentally friendly” by Lutz M. Birke, Hamburger Port Authority, June 2015 Smart mobility : 8 e-AGV(automatic guided vehicle) at the Container terminal, Altenwerder 92 e-cars in use in the port 1,450 e-cars in the metropolitan region of Hamburg
  • 21.
    Source: presentation “smartPORTenergy Port of Hamburg – efficient and environmentally friendly” by Lutz M. Birke, Hamburger Port Authority, June 2015 smartPORT energy : The Port is harnessing wind energy by operating wind power plants onsite and has also installed solar thermal collectors and photovoltaics on the roof tops to generate solar power. Three defined primary project aims for smartPORT energy are – 1) Reduce dependency on conventionally generated energy 2) Reduce energy consumption and energy costs 3) Reduce emissions Smart Port: Hamburg Port Authority’s “smartPORT” initiative
  • 22.
    Renewable Energy: OffshoreWindMills European Union 2016 annual figures: • 12.5 GW of new wind power capacity was installed and grid-connected in the EU during 2016, a decrease of 3% compared to 2015 annual installations. 10,923 MW were installed onshore, and 1,567 MW were installed offshore. • Wind power accounted for 51% of total power capacity installations in 2016. FOWIND (Facilitating Offshore Wind in India) : The project focuses on the States of Gujarat and Tamil Nadu for identification of potential zones for development through techno-commercial analysis and preliminary resource assessment. FOWIND activities will also help facilitate a platform to stimulate offshore wind related R&D activities in the country. • Renewable energy accounted for 86% of all new EU power installations in 2016. (In 2013, capacity addition in renewable energy segment overtook additions in fossil fuelled sector). • Wind power covered 10.40% of the EU’s electricity demand. • €27.5 billion were invested in 2016 to finance wind energy development. This was 5% more than the total investment in 2015. Source: www.fowind.in, The European Wind Energy Association
  • 23.
    INDIA CHINA AUSTRALIA GERMANY Coastal Shipping: INDIAv/sWorld • At present, just 6% of freight transported in India is carried by coastal shipping and inland waterways; the comparative share in Germany and China is 11% and 24%, respectively. • Thermal coal alone accounts for around 61 percent of the freight volume on the Indian Railways and 24 percent of the seaport freight mix.Water borne cargo currently contributes less than 10 percent to India's modal mix. • China uses its inland waterways to transport raw material and finished goods between Eastern andWestern provinces; water contributes 24 percent to China's freight modal mix. • Australia carries 17 percent of goods through coastal shipping. • In Germany, 11 percent of goods are moved through inland waterways and coastal shipping. Source: Ministry of Shipping & other secondary sources
  • 24.
    Coastal Shipping inINDIA: • Major Ports handle 75 percent of the coastal cargo, which are largely made up of crude, POL and coal. Ports like Vizag, Paradip, Mumbai, Ennore and Haldia together are handling two third of the inland coasting trade cosigned to all major ports. • Minor ports between them handle a quarter of inland coasting trade consignments of which POL, cement, building material and iron ore account for 90 percent. Coastal Movement of commodities – Commodity Origin – Destination Port CRUDE OIL Originating ports are from Mumbai, Rawa and Cuddalore and the discharge ports are to Vizag, Cochin, Chennai and Kandla. POL products Originate at major ports and at Sikka with sources being Jamnagar, New Mangalore, Mumbai, Cochin, Paradip, Vizag, Chennai and Haldia, where refineries are situated. The key destinations areVizag, Kandla, Haldia and Mumbai. COAL Originating ports are Paradip,Vizag, Haldia and the discharge ports are Chennai,Tuticorin. IRON ORE Originating ports are Vizag and Mormugao and the discharge ports are Magdalla, Dhramtar and Revdanda. CEMENT Originating ports are Muldwarka, Porbunder, Jafarabad, Pipavav and discharge ports are Dharmtar, Ulwa Belapur, JNP, Ratnagiri, Magdalla, New Mangalore and Cochin. IRON & STEEL is moving from Magdalla to Mumbai and GPPL. Source: Ministry of Shipping & other secondary sources
  • 25.
    Coastal Shipping inINDIA: Way Forward • The shipping ministry plans to offer companies an incentive of Rs.1 per tonne per km to transport goods through inland waterways and coastal shipping. • A shift from roads and railways to coastal shipping and inland waterways could lead to emission savings of about 3.5% in the freight transport sector. • The proposed incentive would also help to increase transportation by coastal shipping from 6 to 12% in a span of a decade and result in potential savings of Rs.35,000-40,000 crores. • To reach this target, the shipping ministry will now take several steps like – • moving to larger barges • use of liquefied natural gas instead of diesel barges • dedicated berths, • bunkering and storage capacities at relevant ports for commodities to be transported through coastal and inland waterways. • According to the shipping ministry, transportation by waterways would cost 25 paisa per km, by rail and road it’s Rs.1.50 and Rs.2.50, respectively. • In terms of fuel efficiency, too, waterways compare favourably: one horsepower can ferry four tonnes of cargo by waterways, while the equivalent is 150kg and 500kg by road and rail, respectively. Source: Ministry of Shipping & other secondary sources
  • 26.
    Coastal Shipping inINDIA: Way Forward Kandla Mormugao Kolkata Kakinada Coastal Shipping will get a boost when this 300 Kms belt is developed with Port based CEZs • which will provide cargo to the ports, • Generate Employment and • simulate demand of goods & services along the coast • Increase Exports Coastal Shipping : Feasibility • When coastal movement is cheaper than road transport despite Port handling costs at either end. • As the road distance reduces coastal shipping will become uncompetitive due to lesser saving in transport component.
  • 27.
    Coastal Shipping :RoRo -Trial Project done through Hazira Port NewMangalore Hazira RoRo operation was being done wherein cargo loaded trucks where coastal moved through a ship from Hazira to New Mangalore ( Oct 15 – Jan 16). Total vessels handled : 15 Nos OutwardTrucks : 790 Nos Major Cargo GoingTowards South : • Marble ,Tiles, Glass • Chalk Powder, Fish Meal, Poultry Feed • Automobile Spares • Ceramic Sanitary ware InwardTrucks : 316 Nos Major Cargo Coming towards North : • Assorted Arcanuts, Cashew Nut shell Liquid • Household Items, Footwear, Plywood • Rubber Roll, Plastic Barrels, Machinery Objective : • ReduceCongestion on roads • Saving in fuel / emissions • Reduce logistic cost