Download as PDF, PPTX
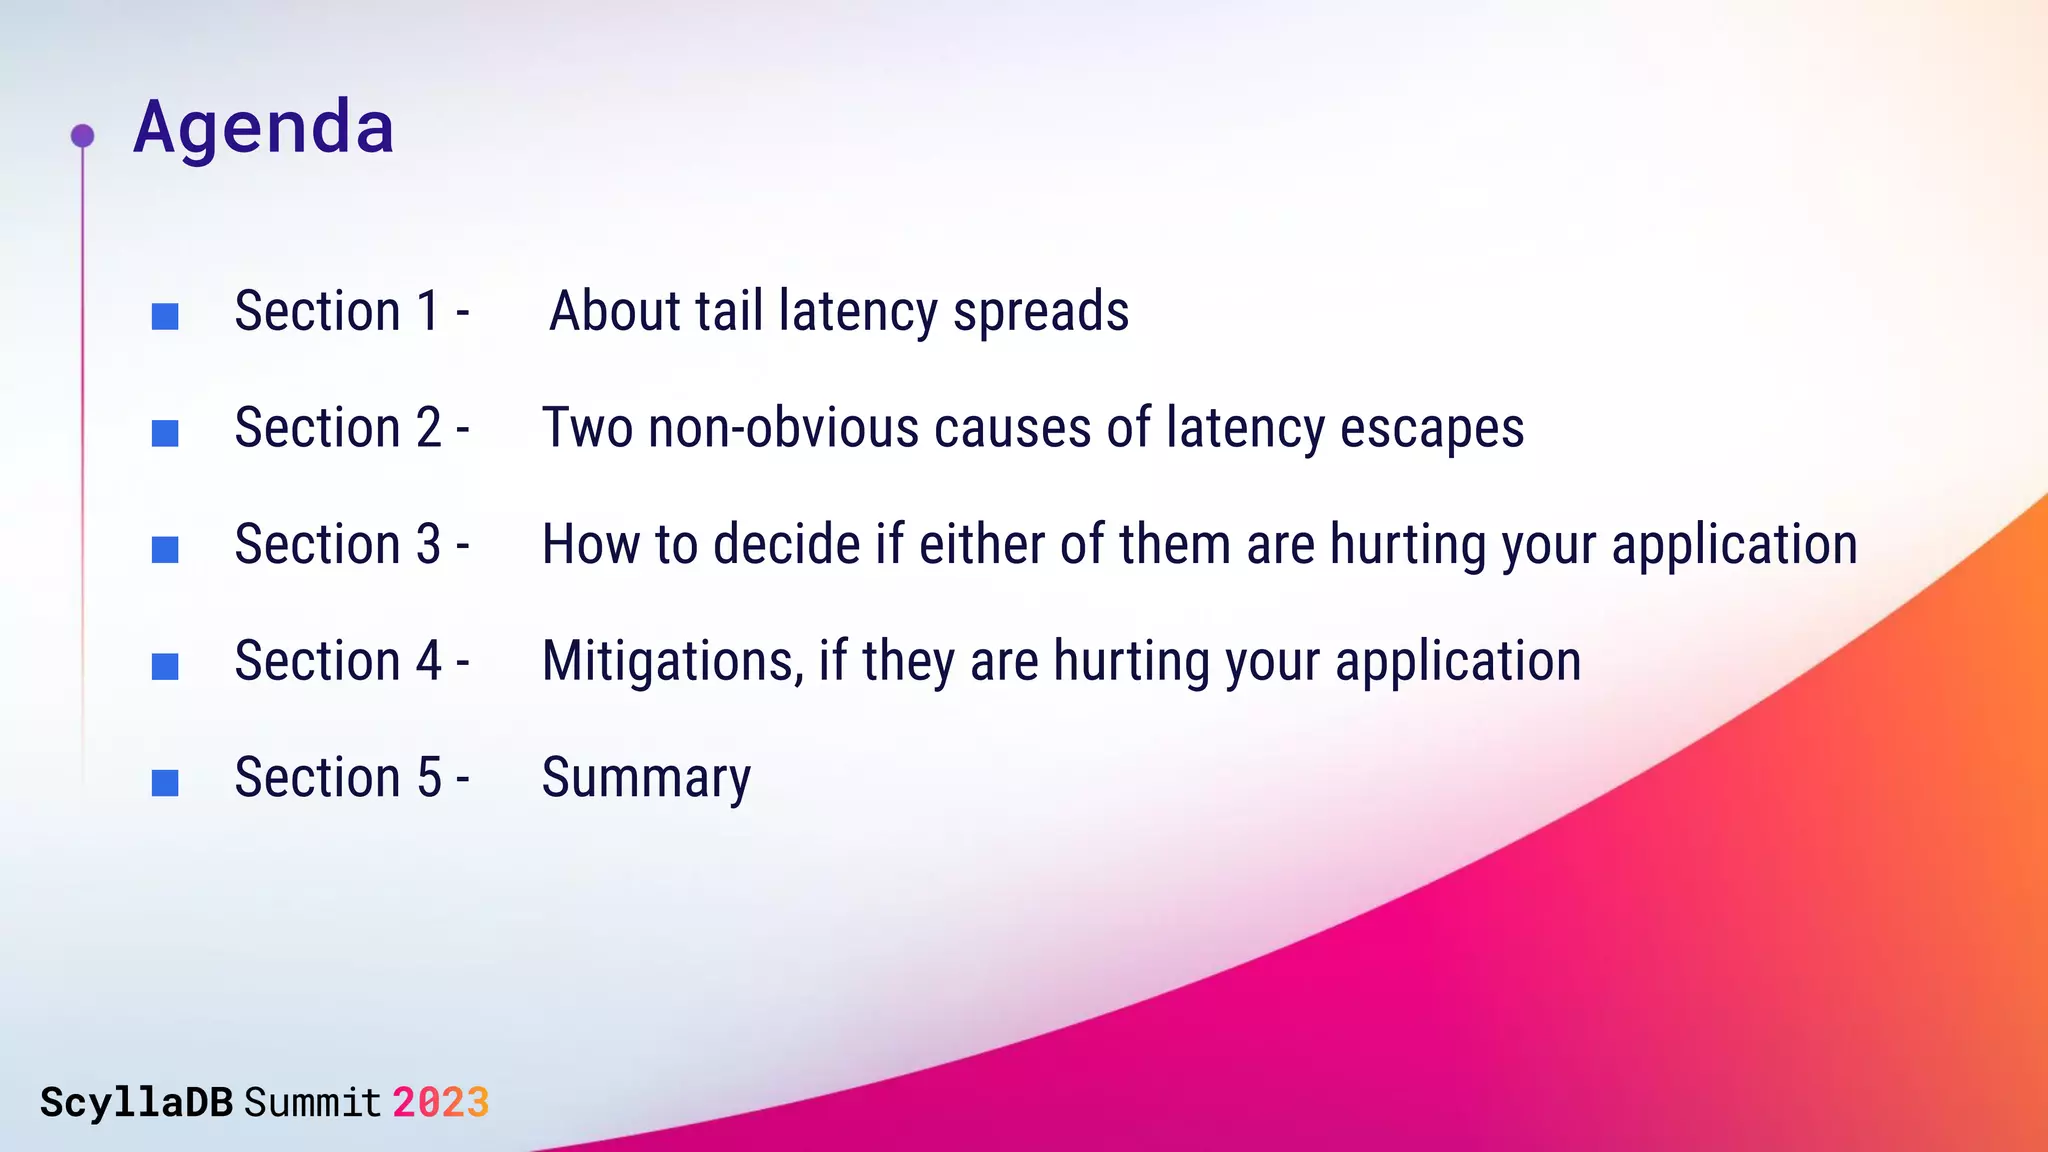
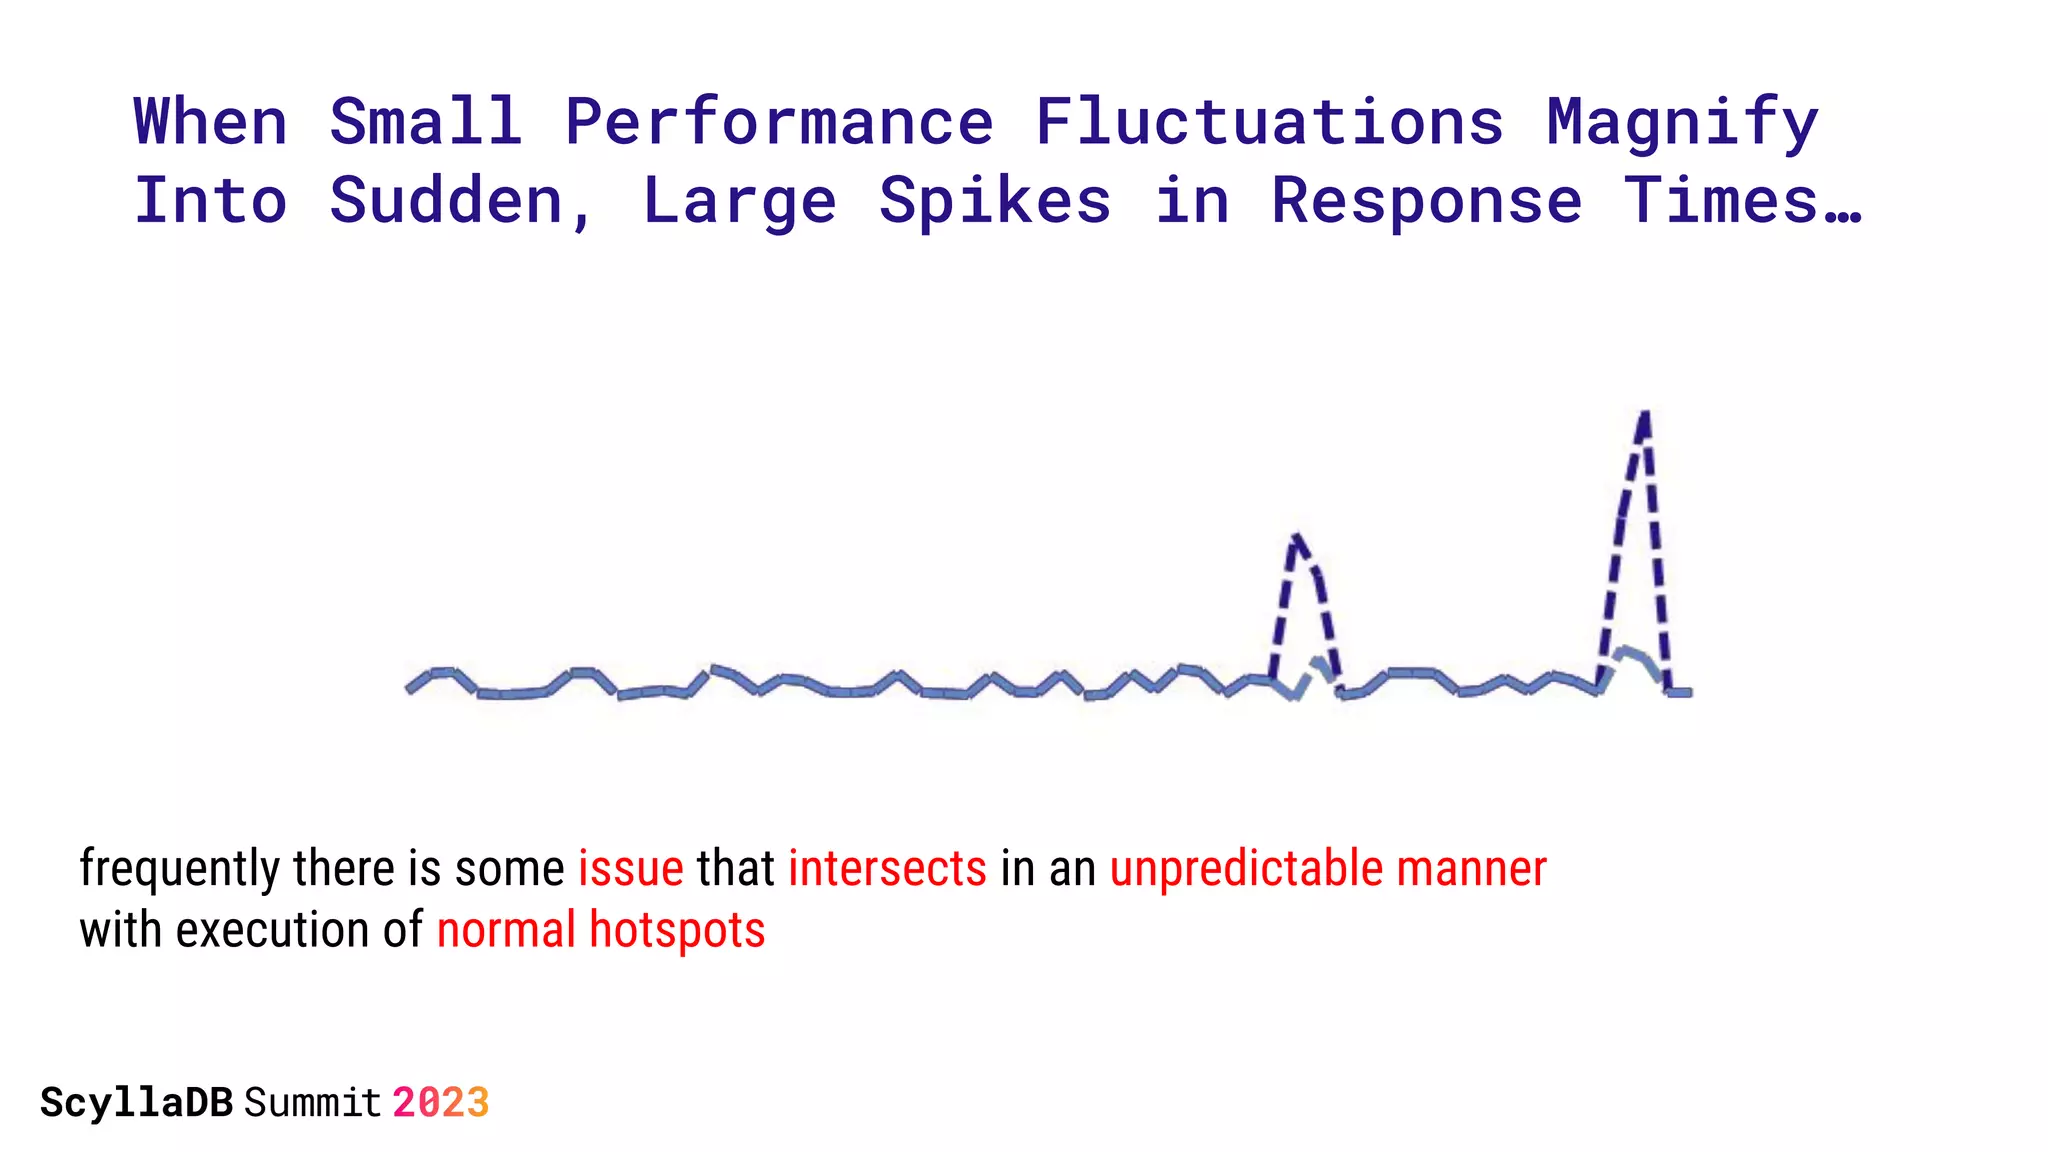
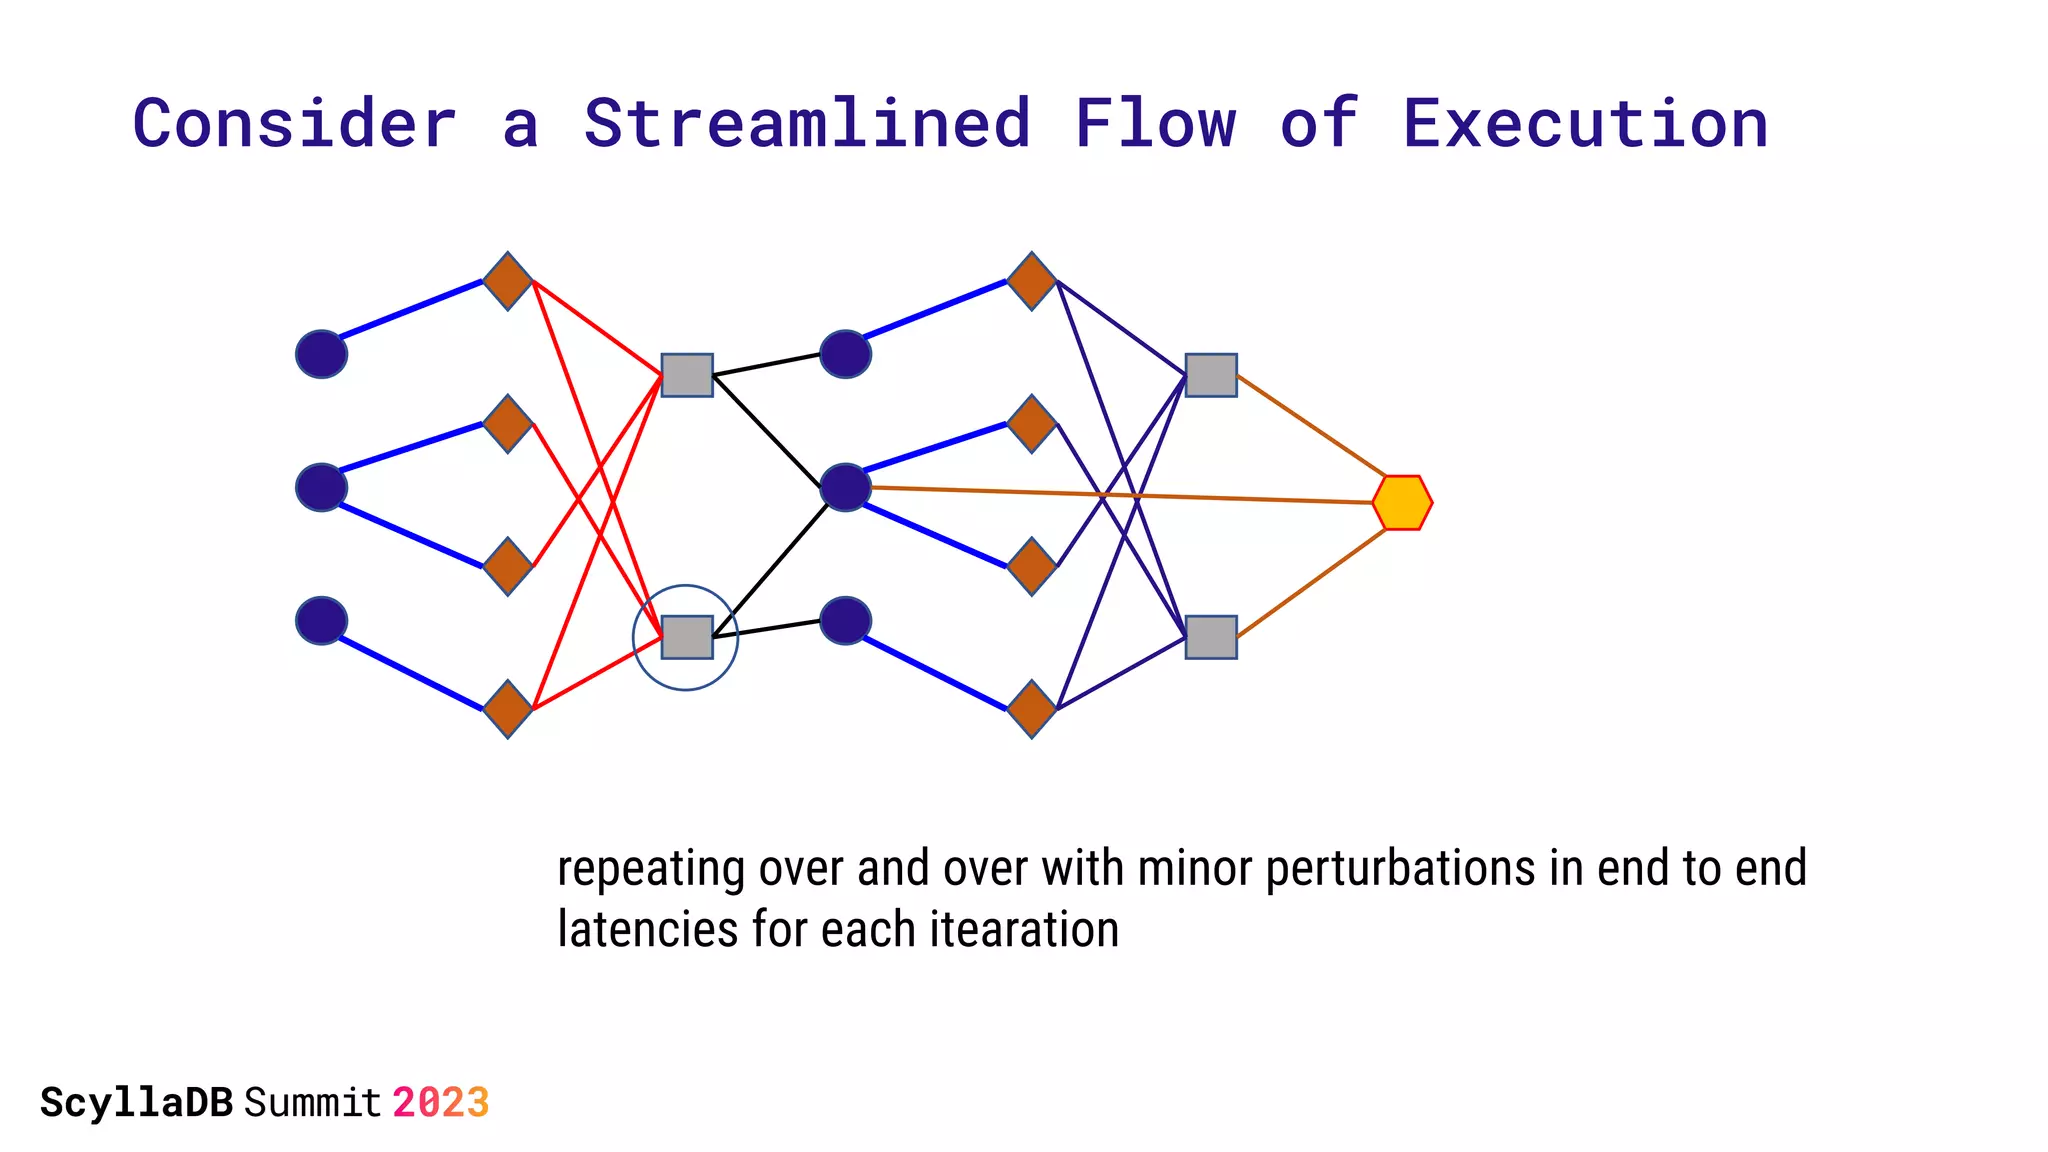
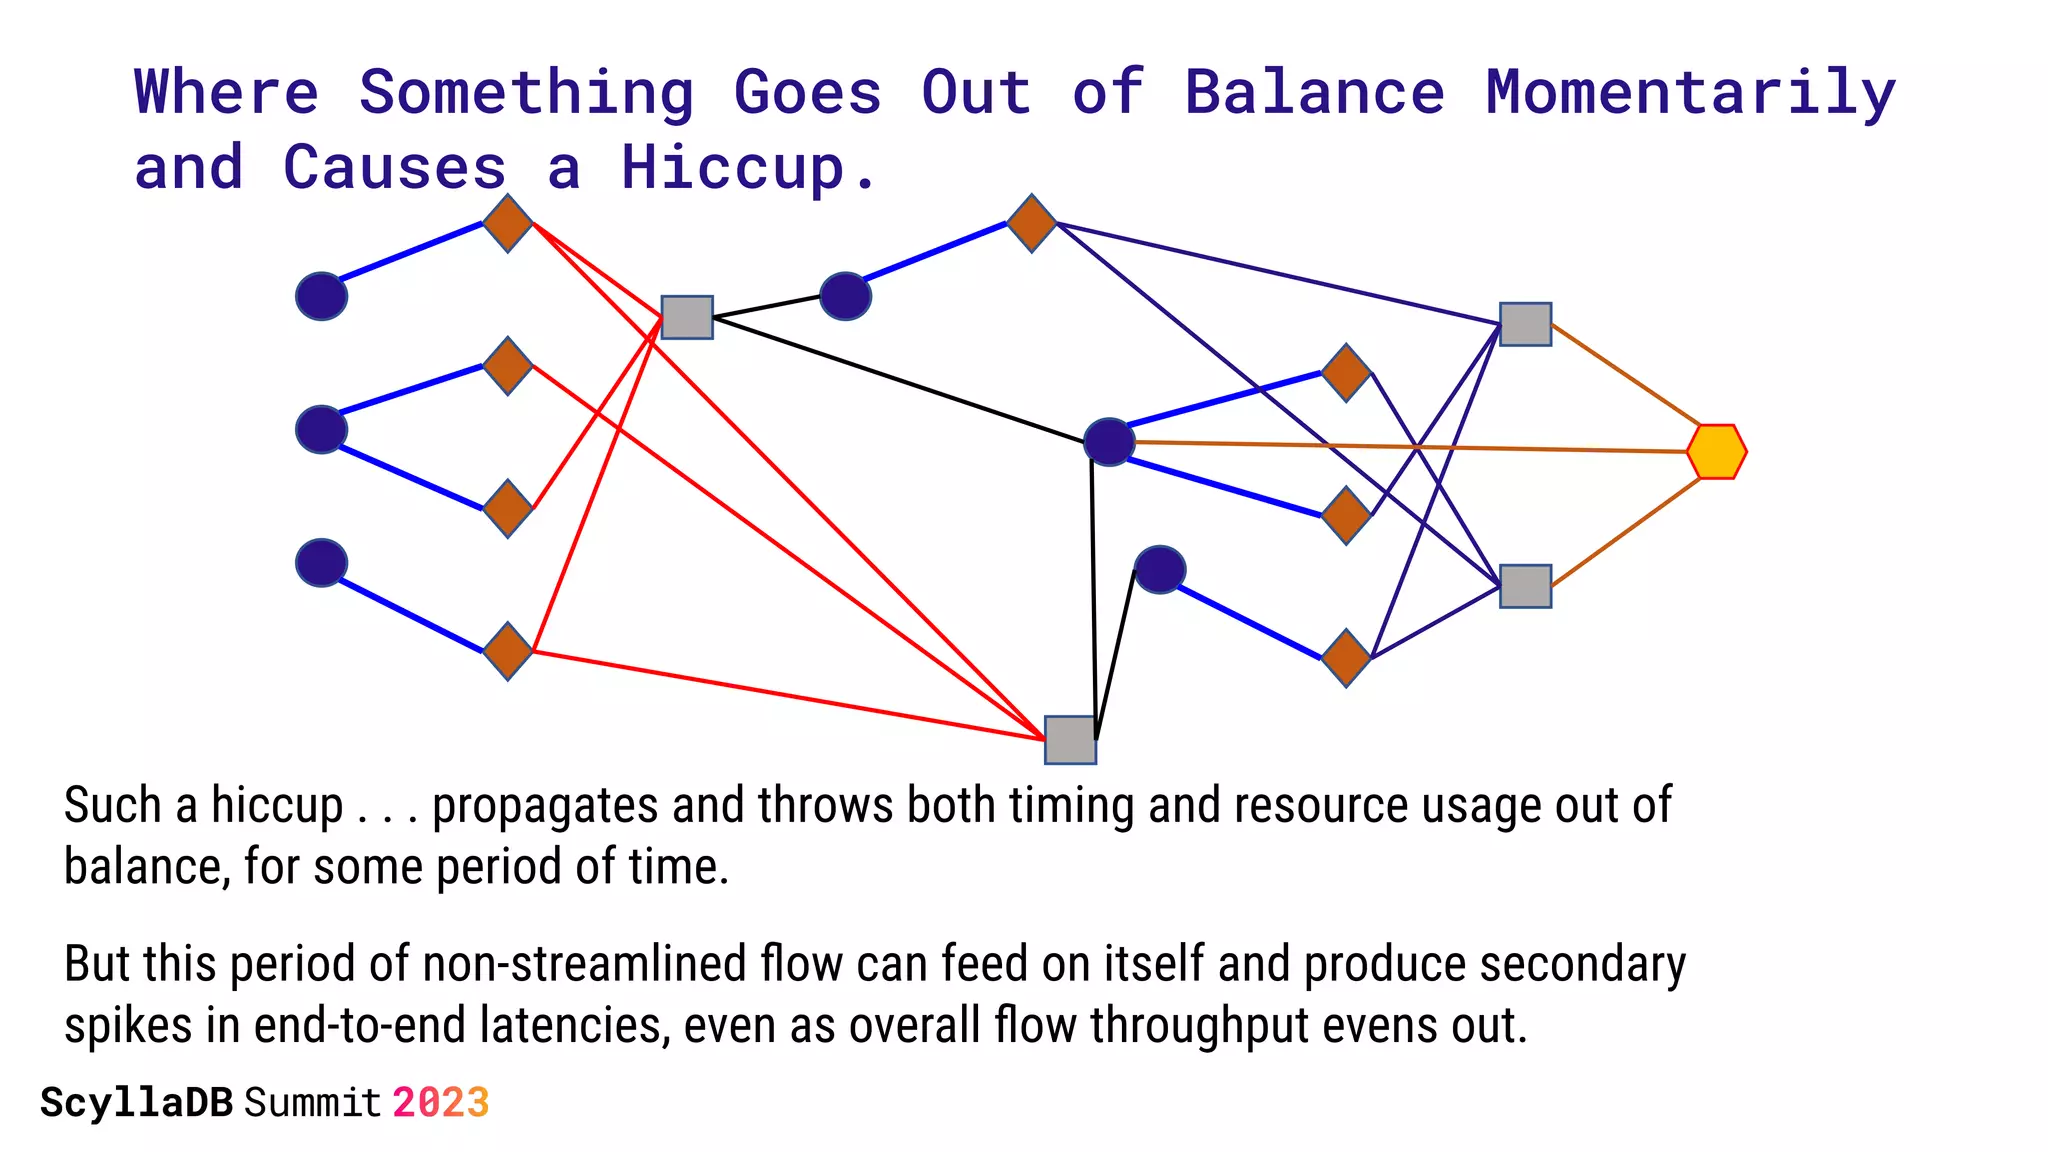

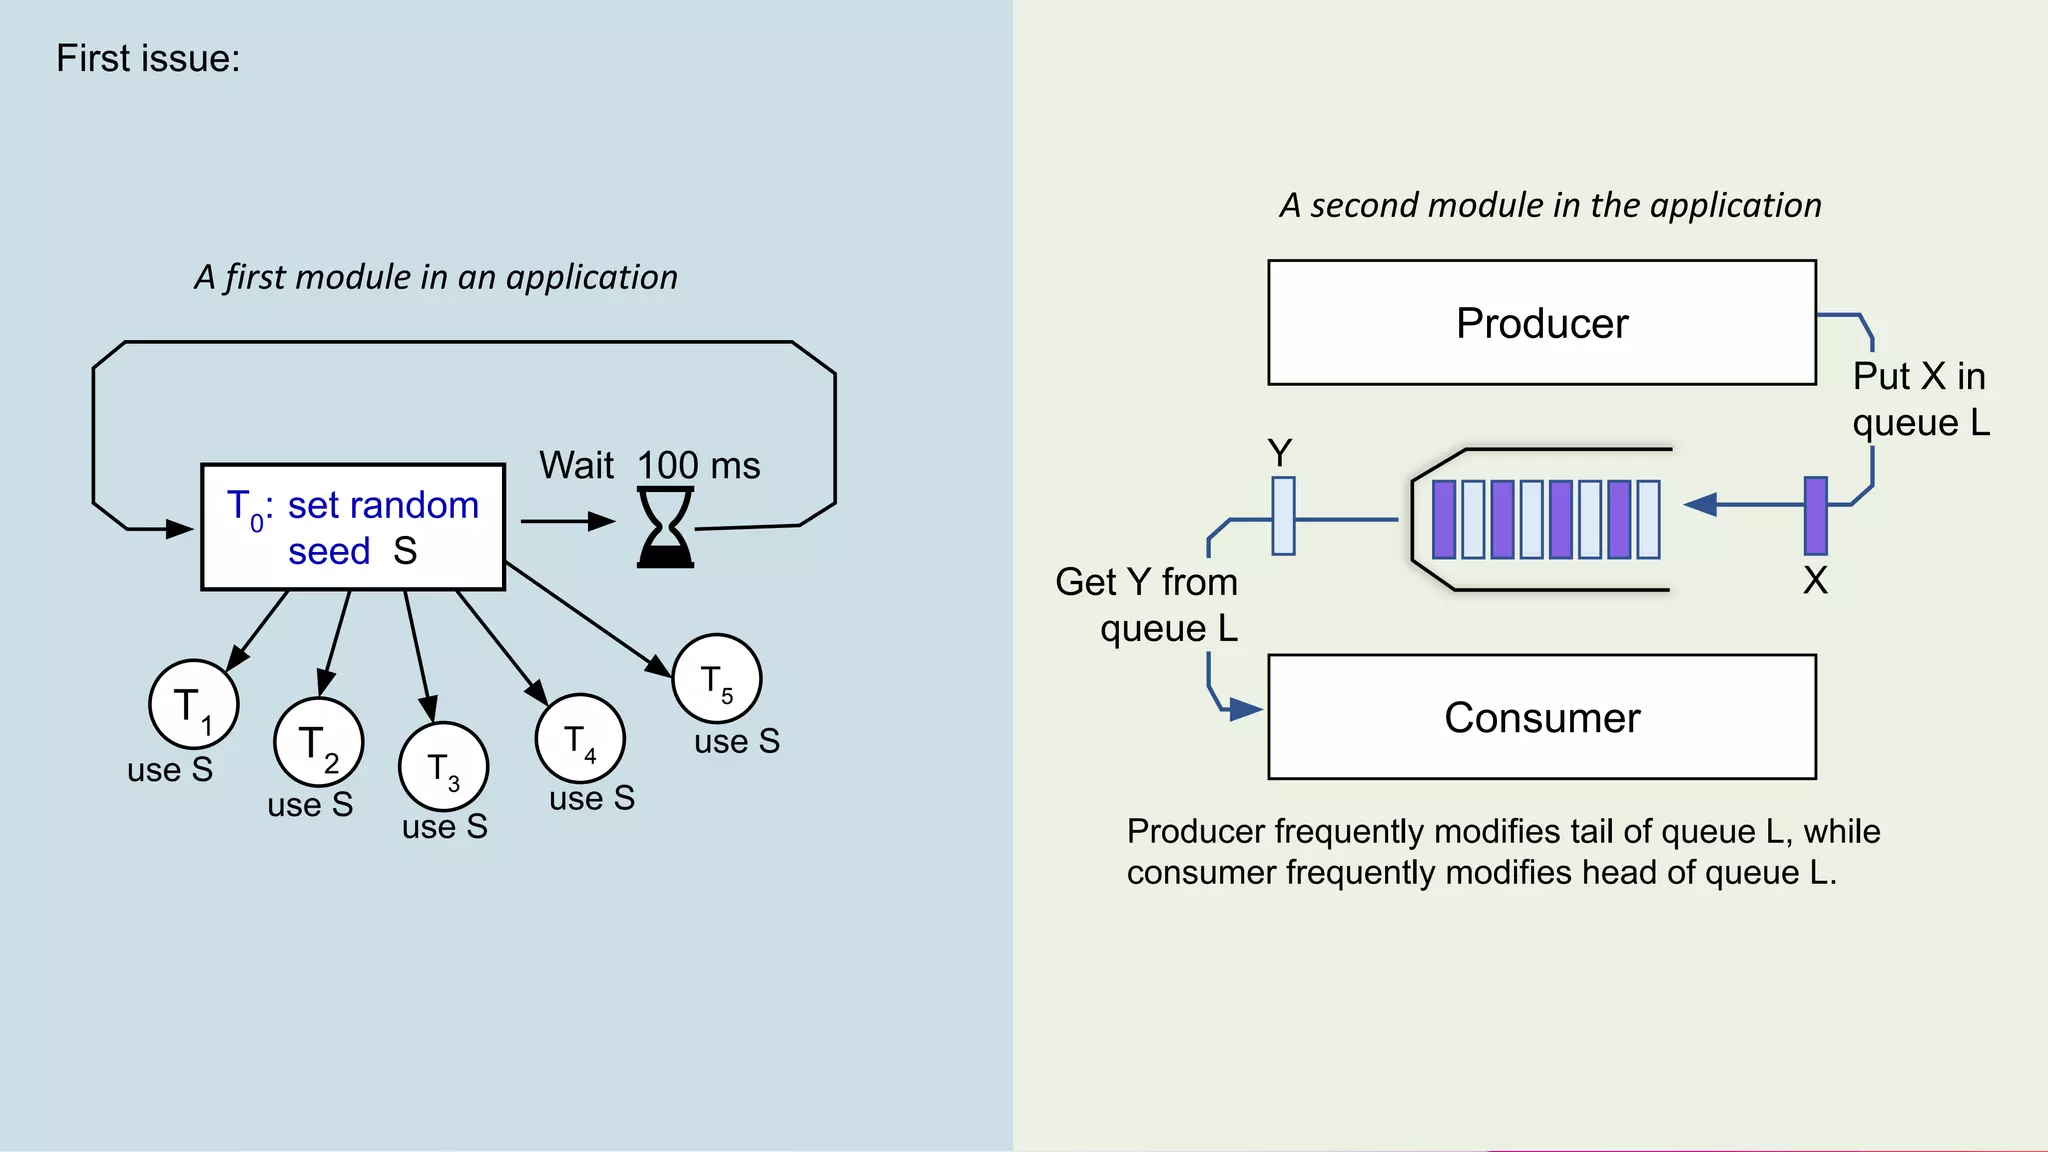
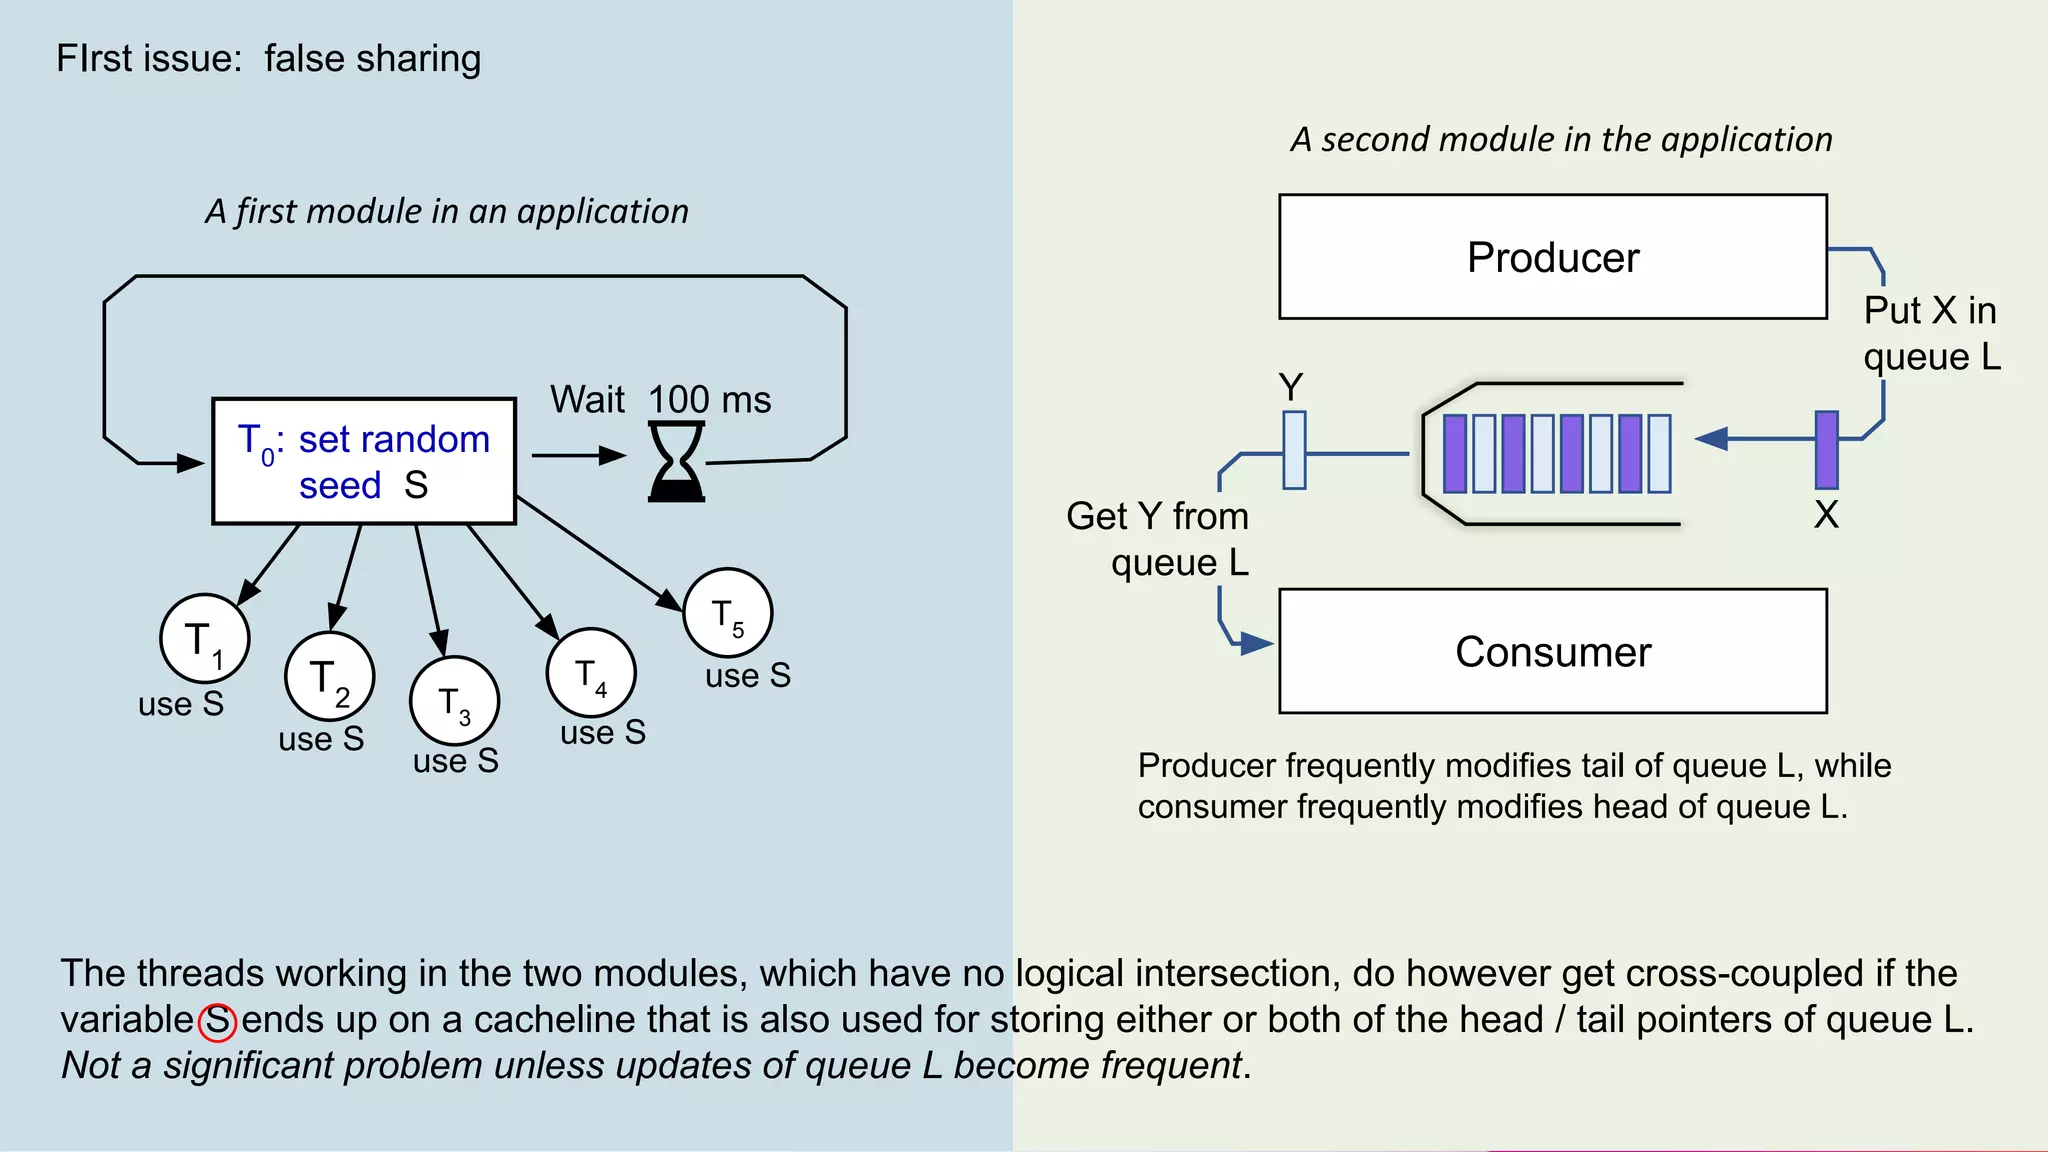
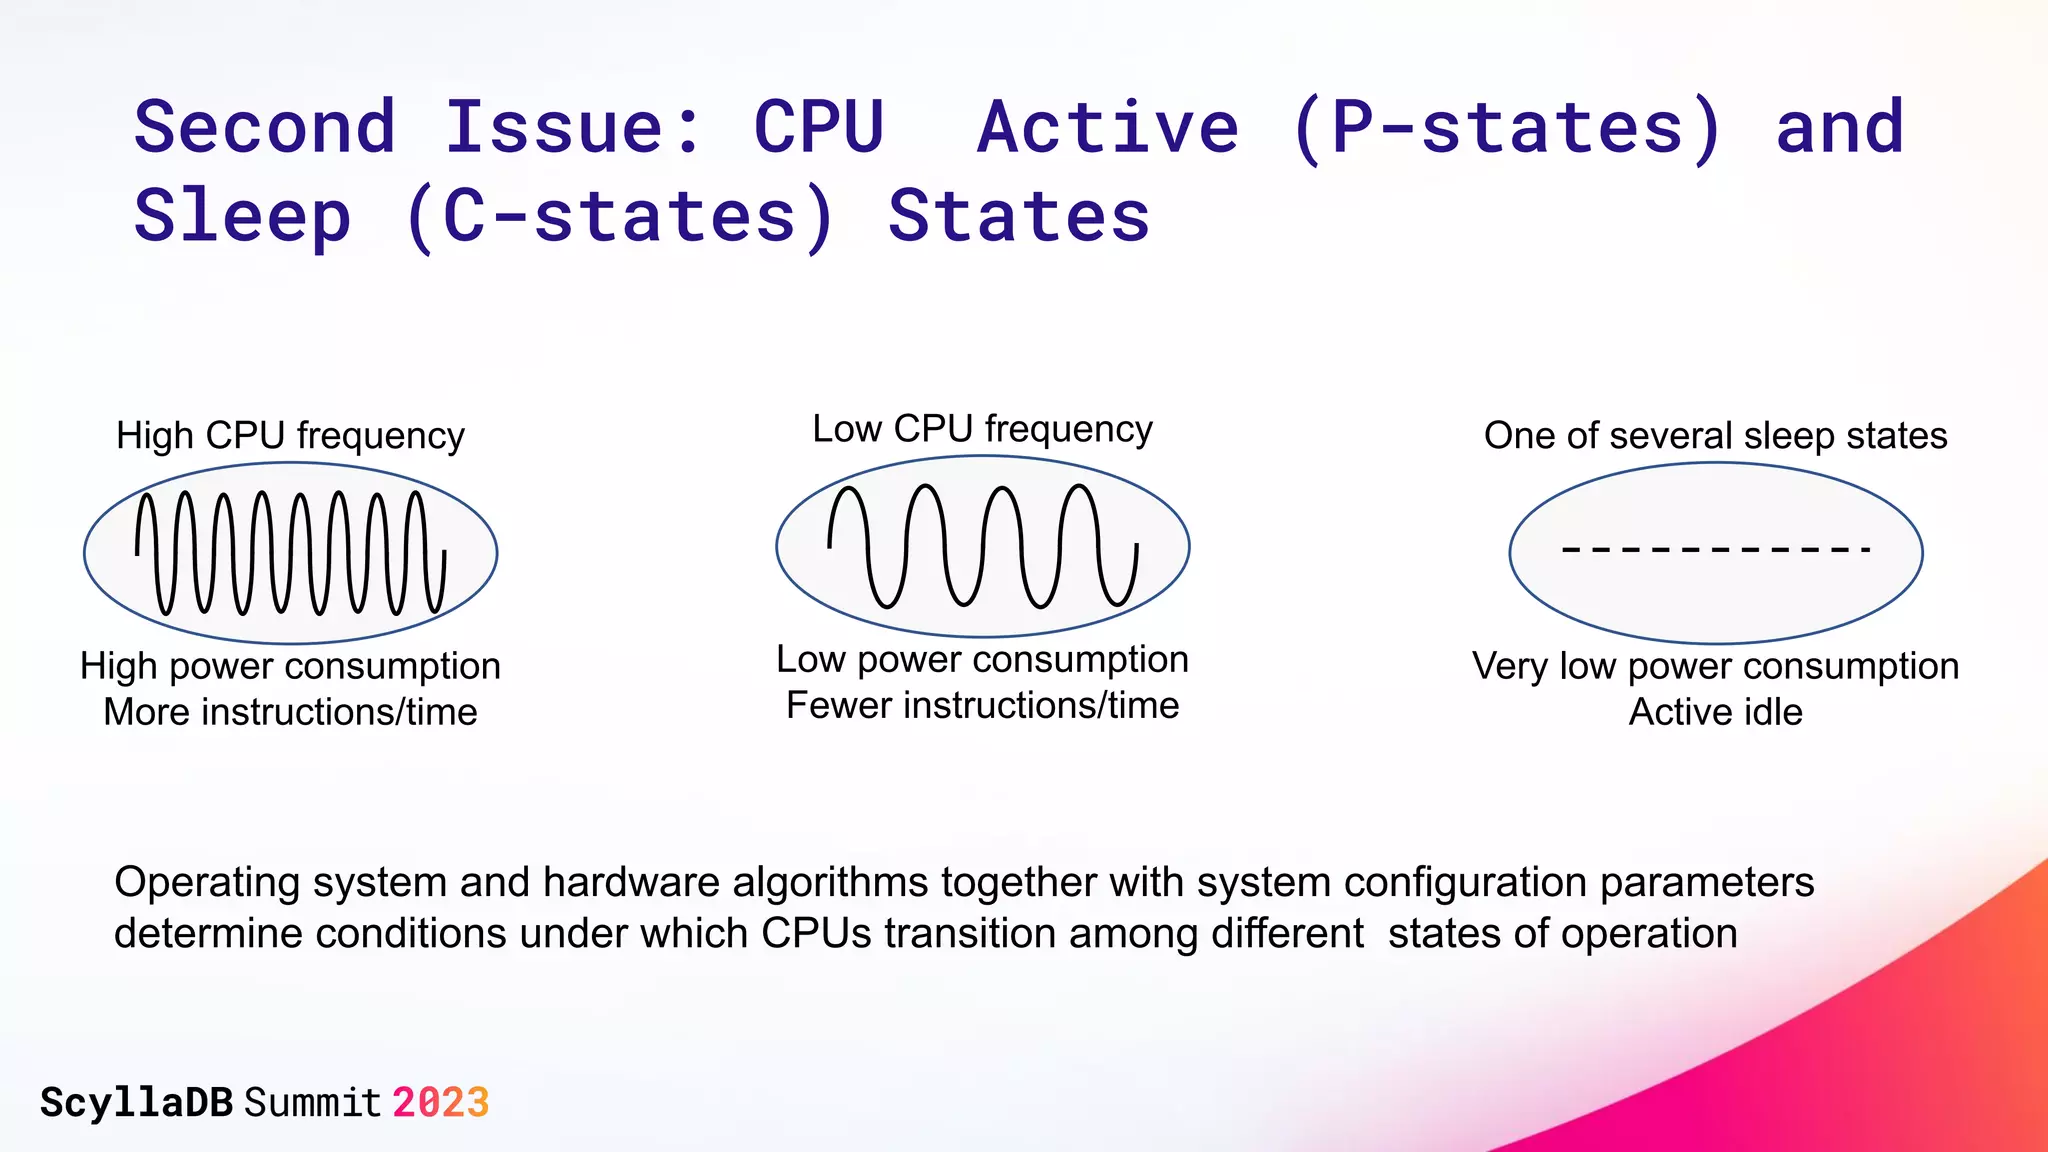
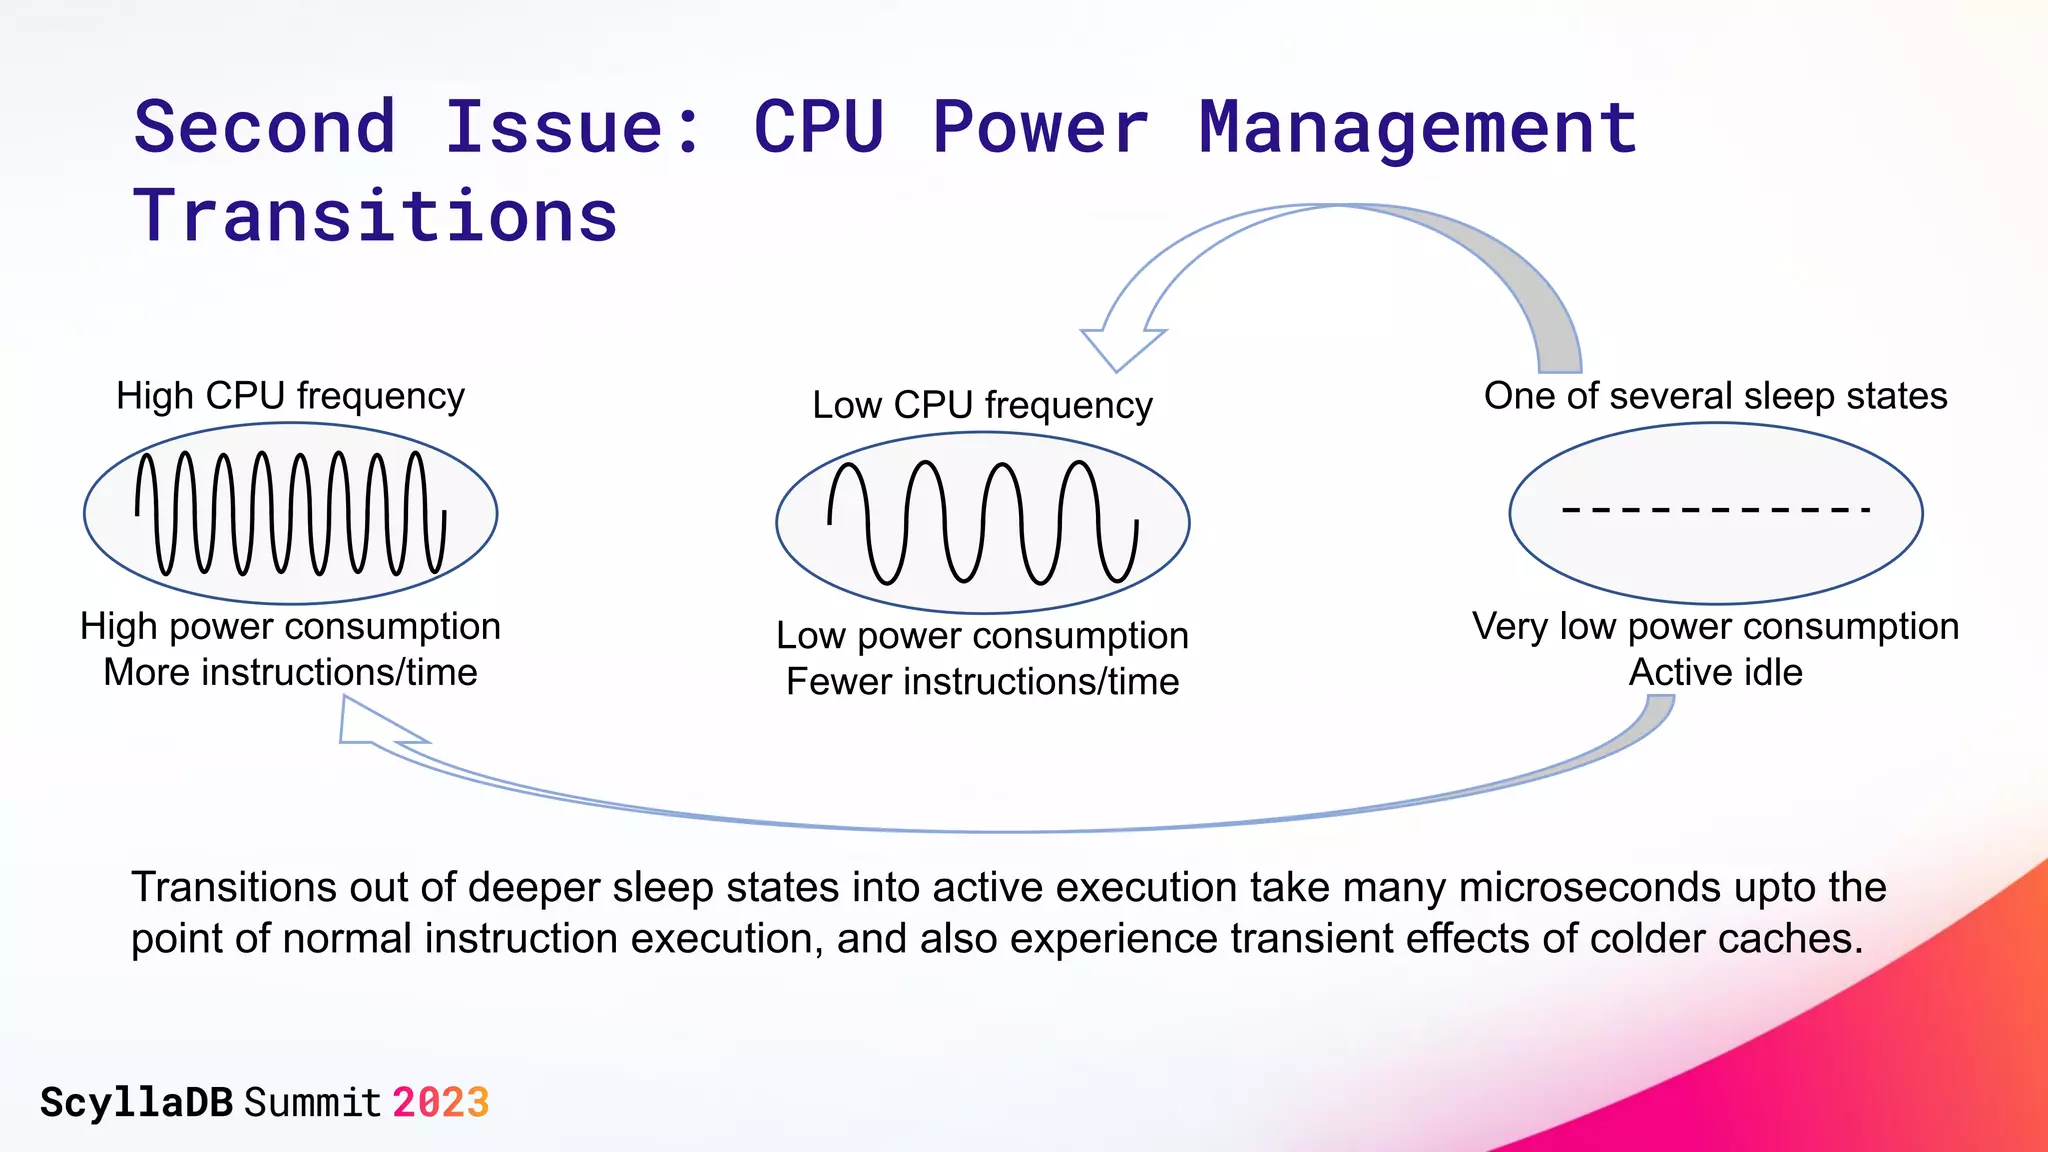
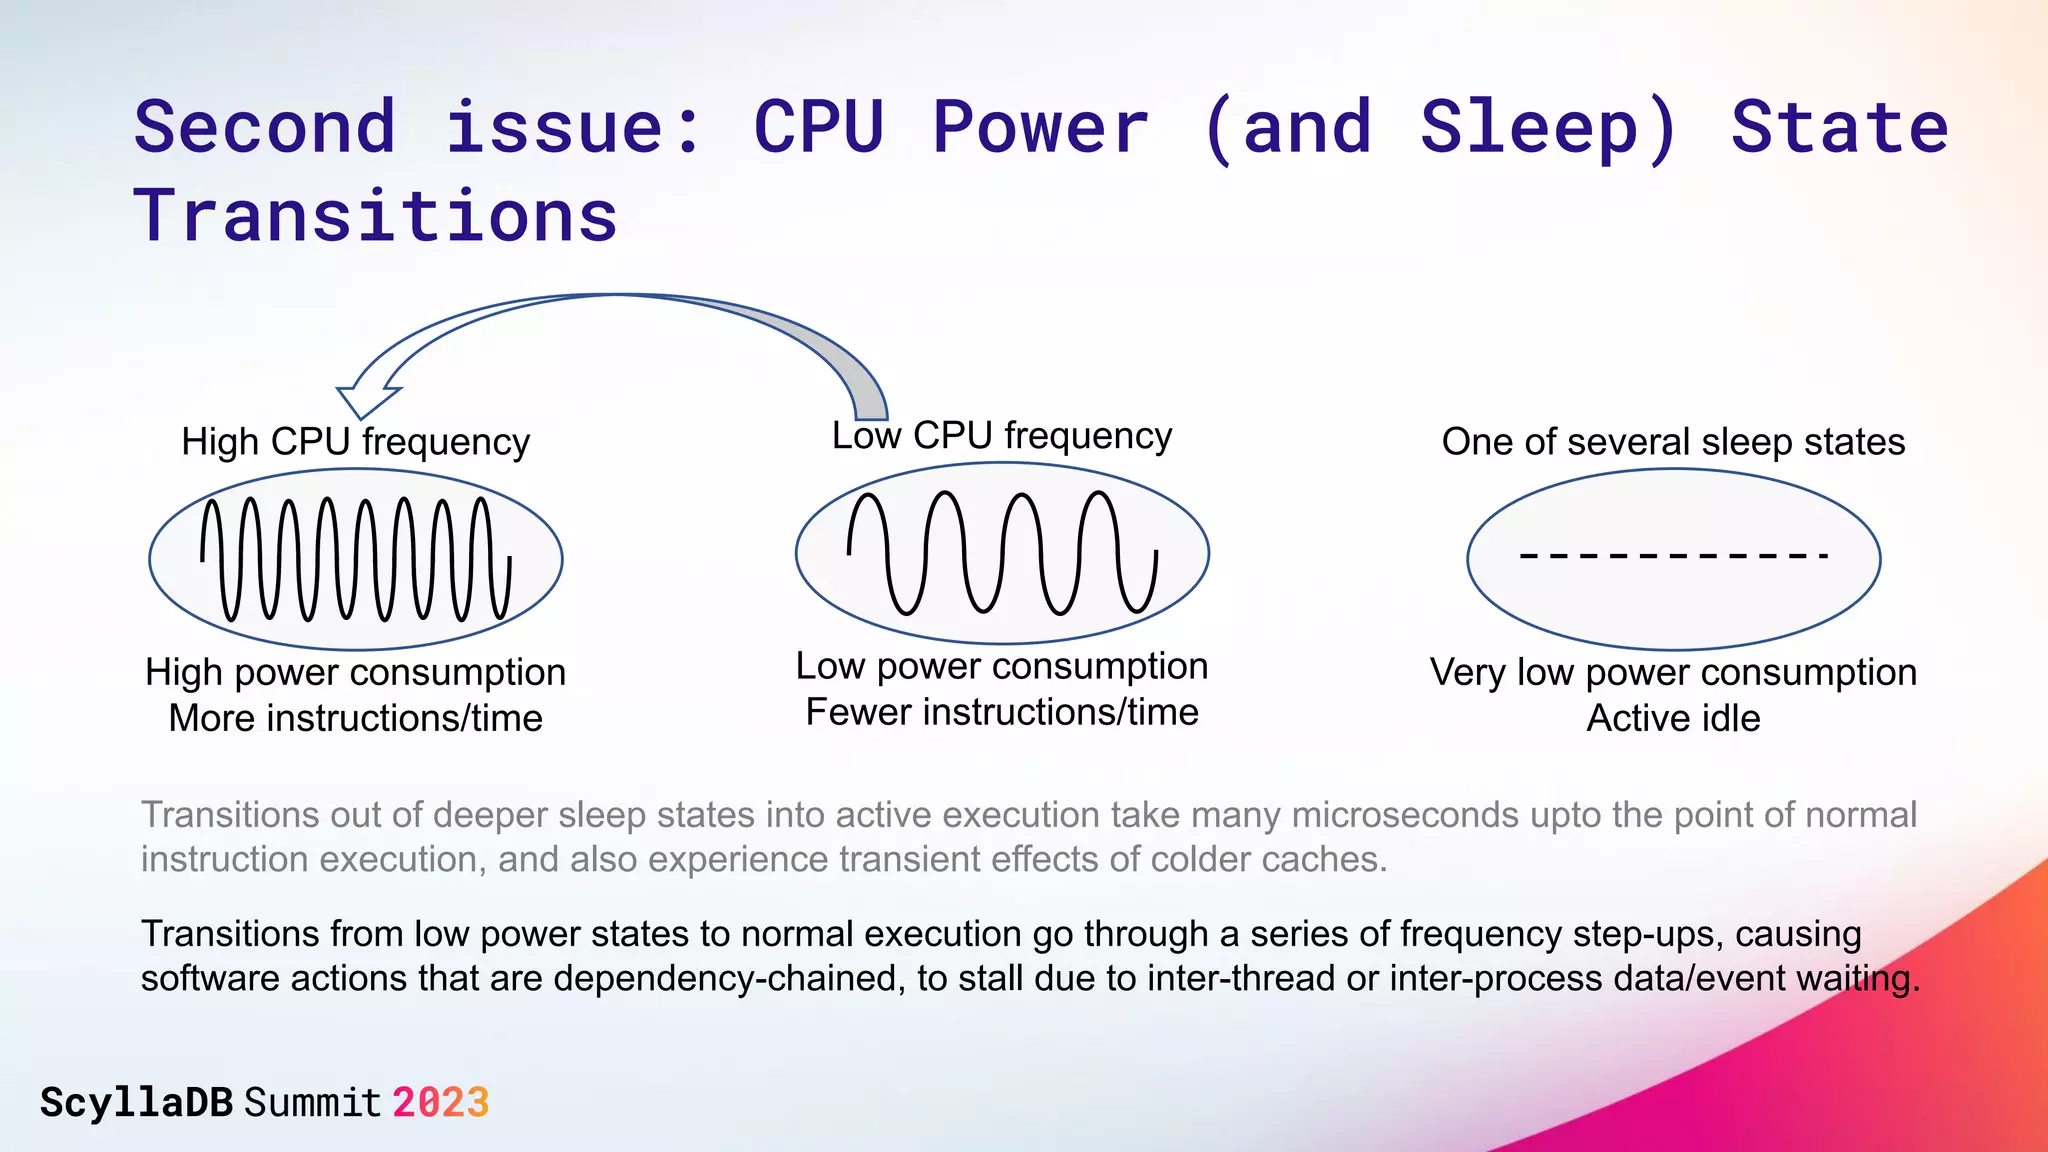
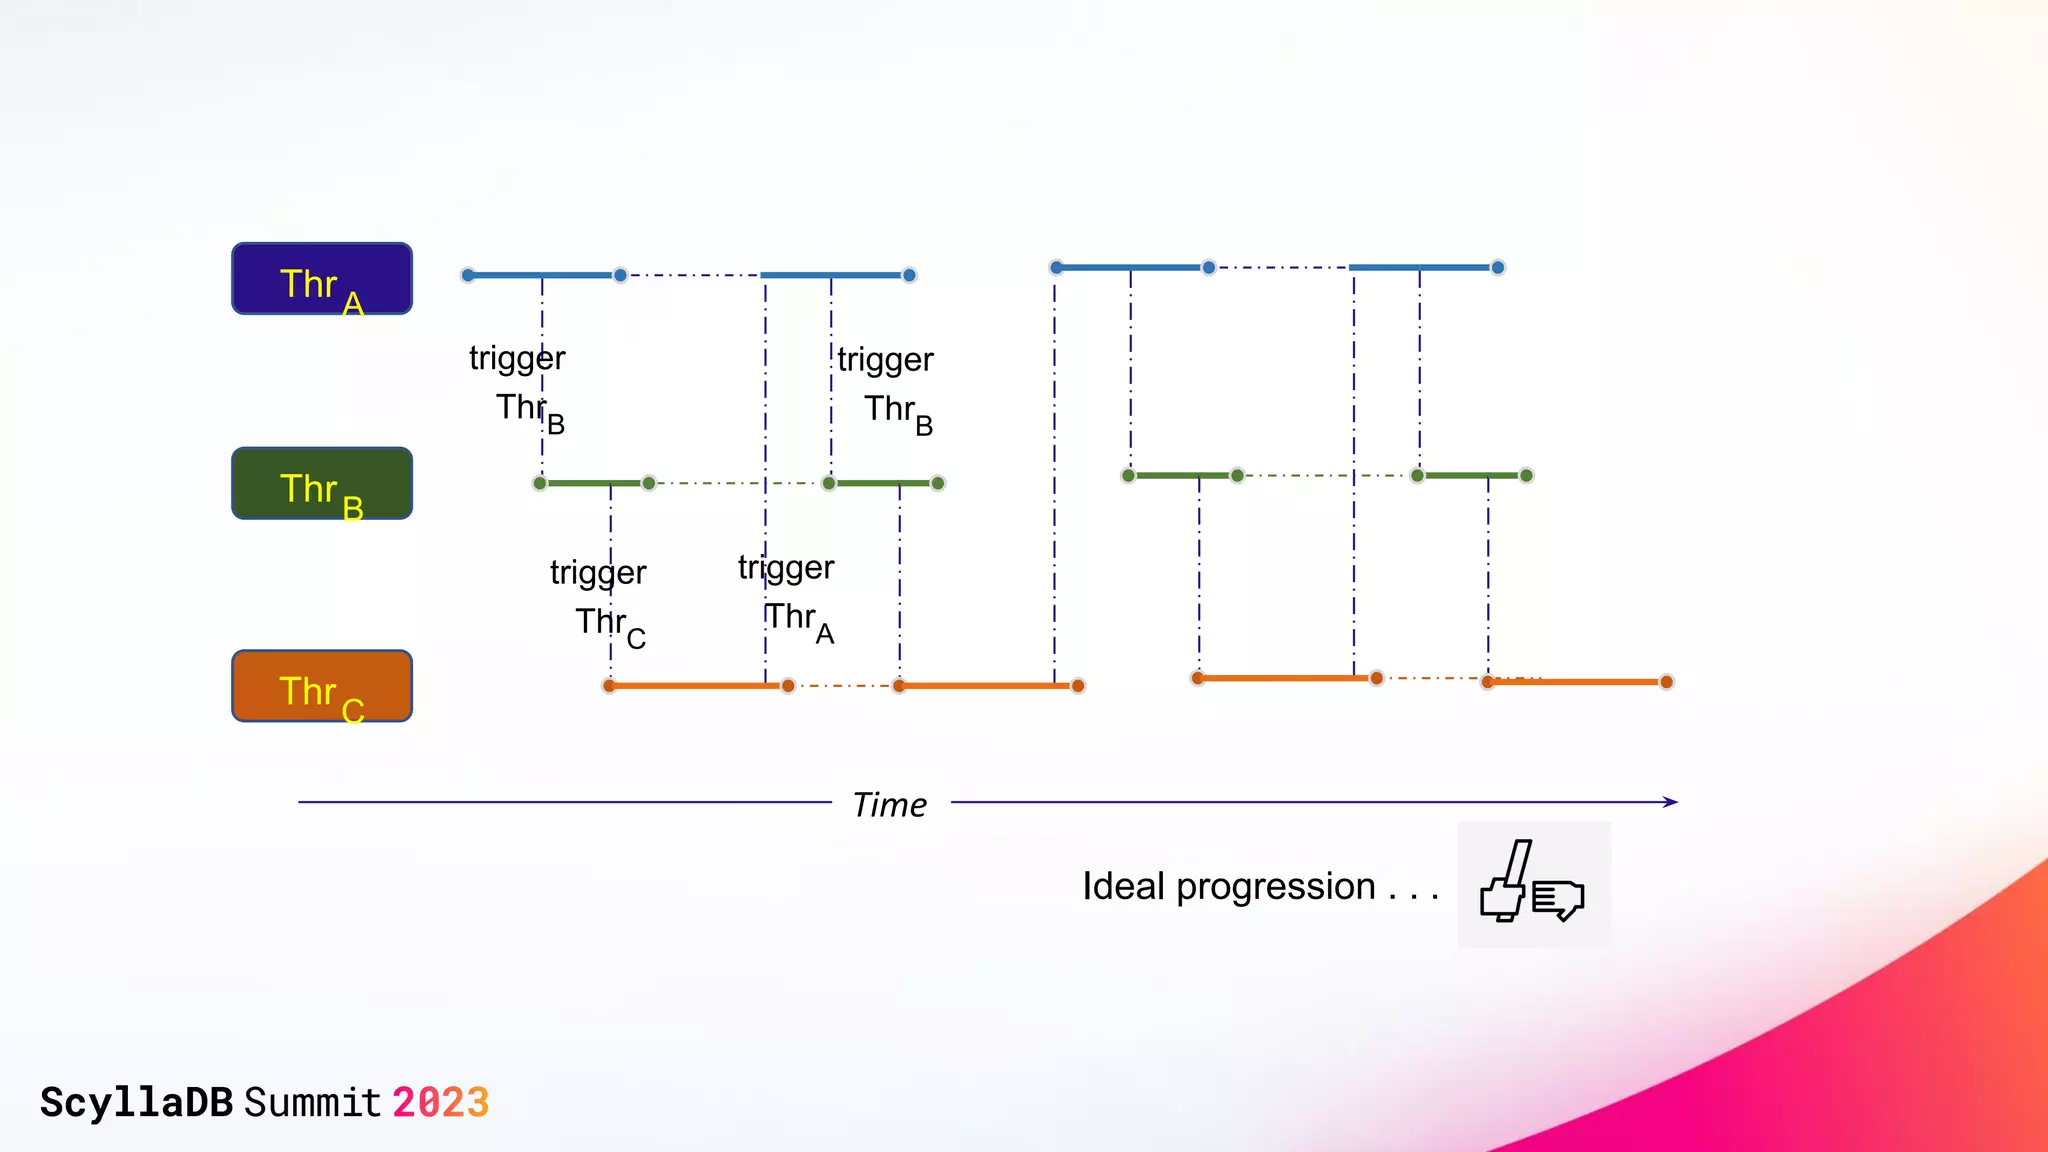
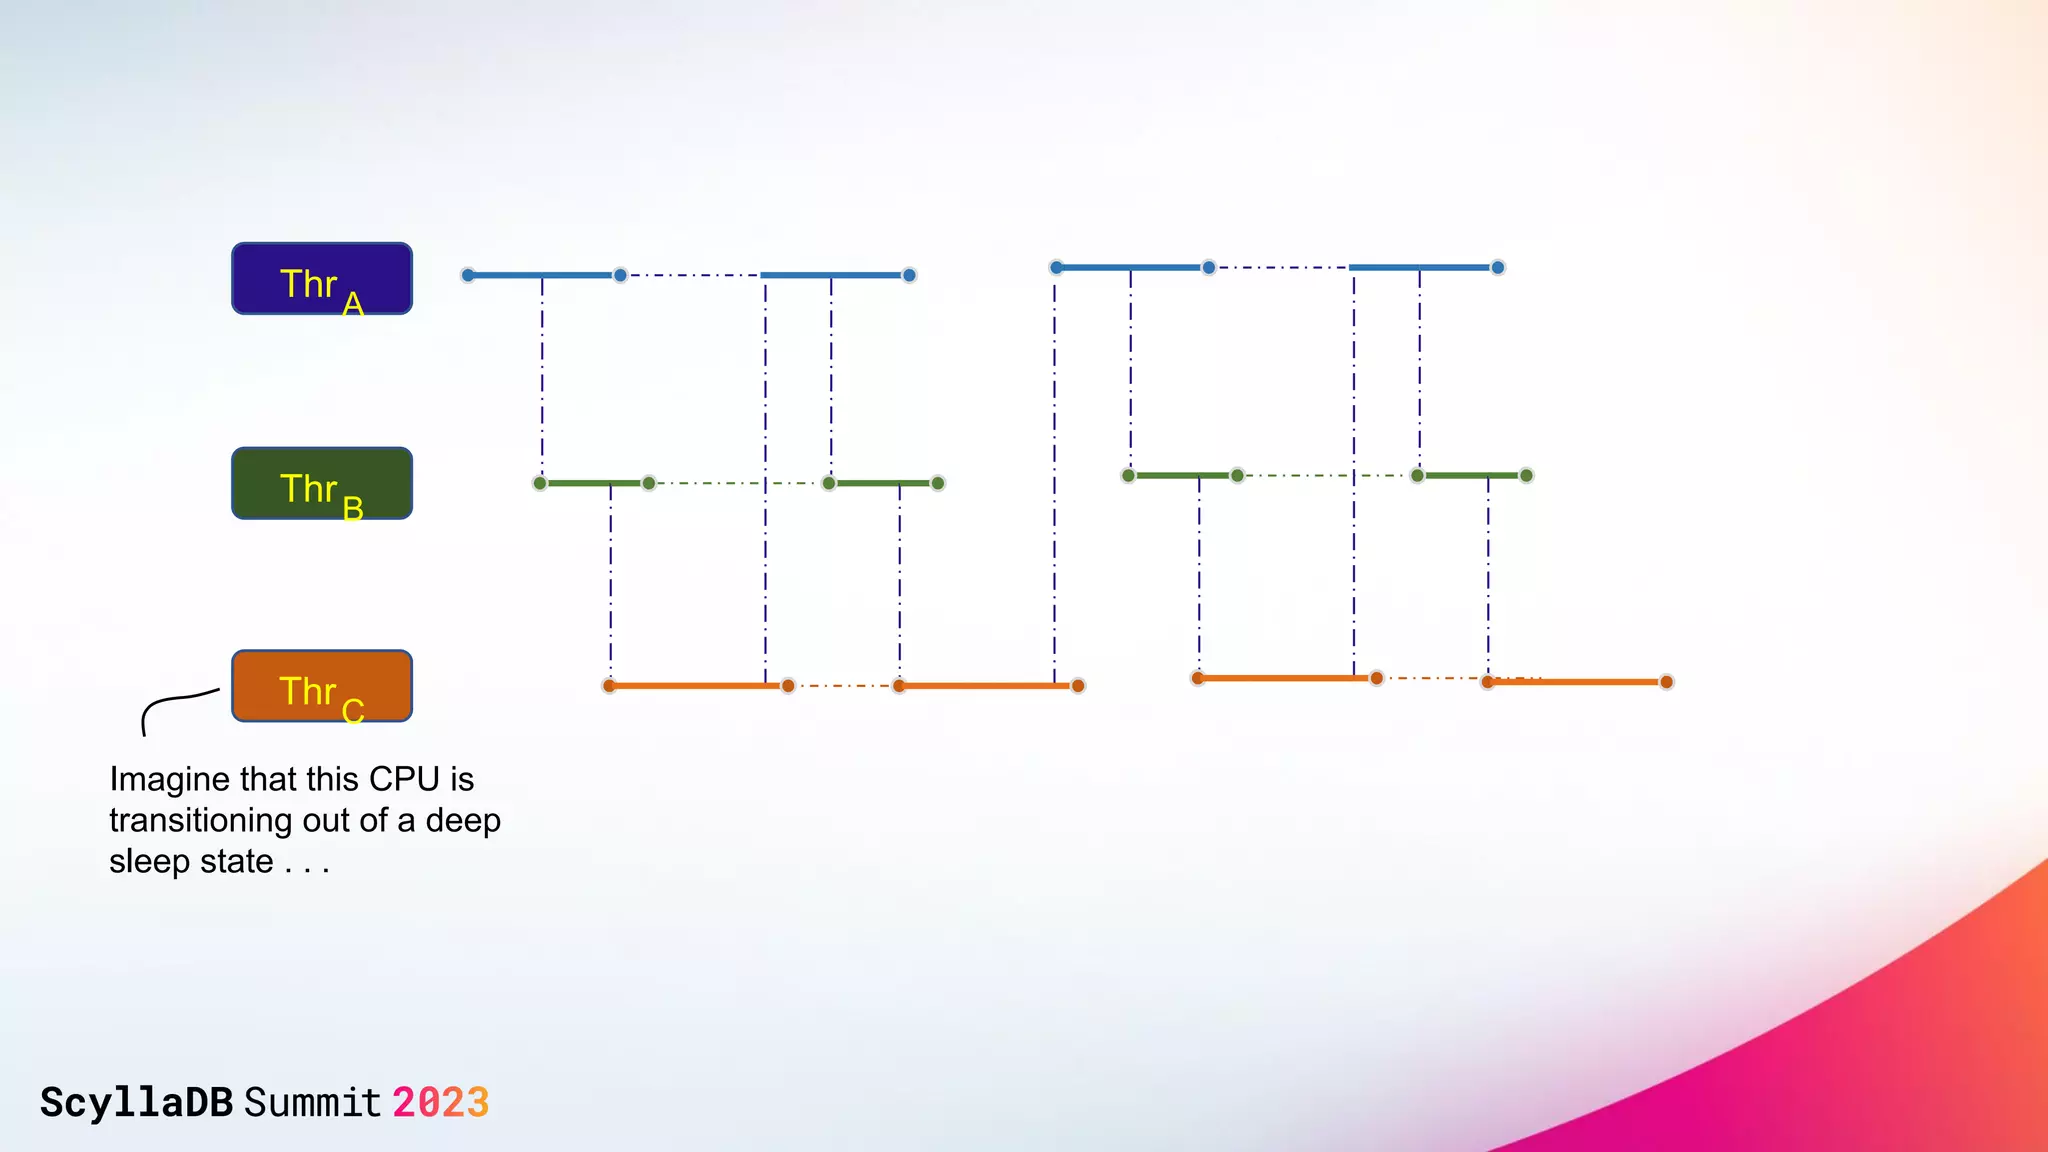
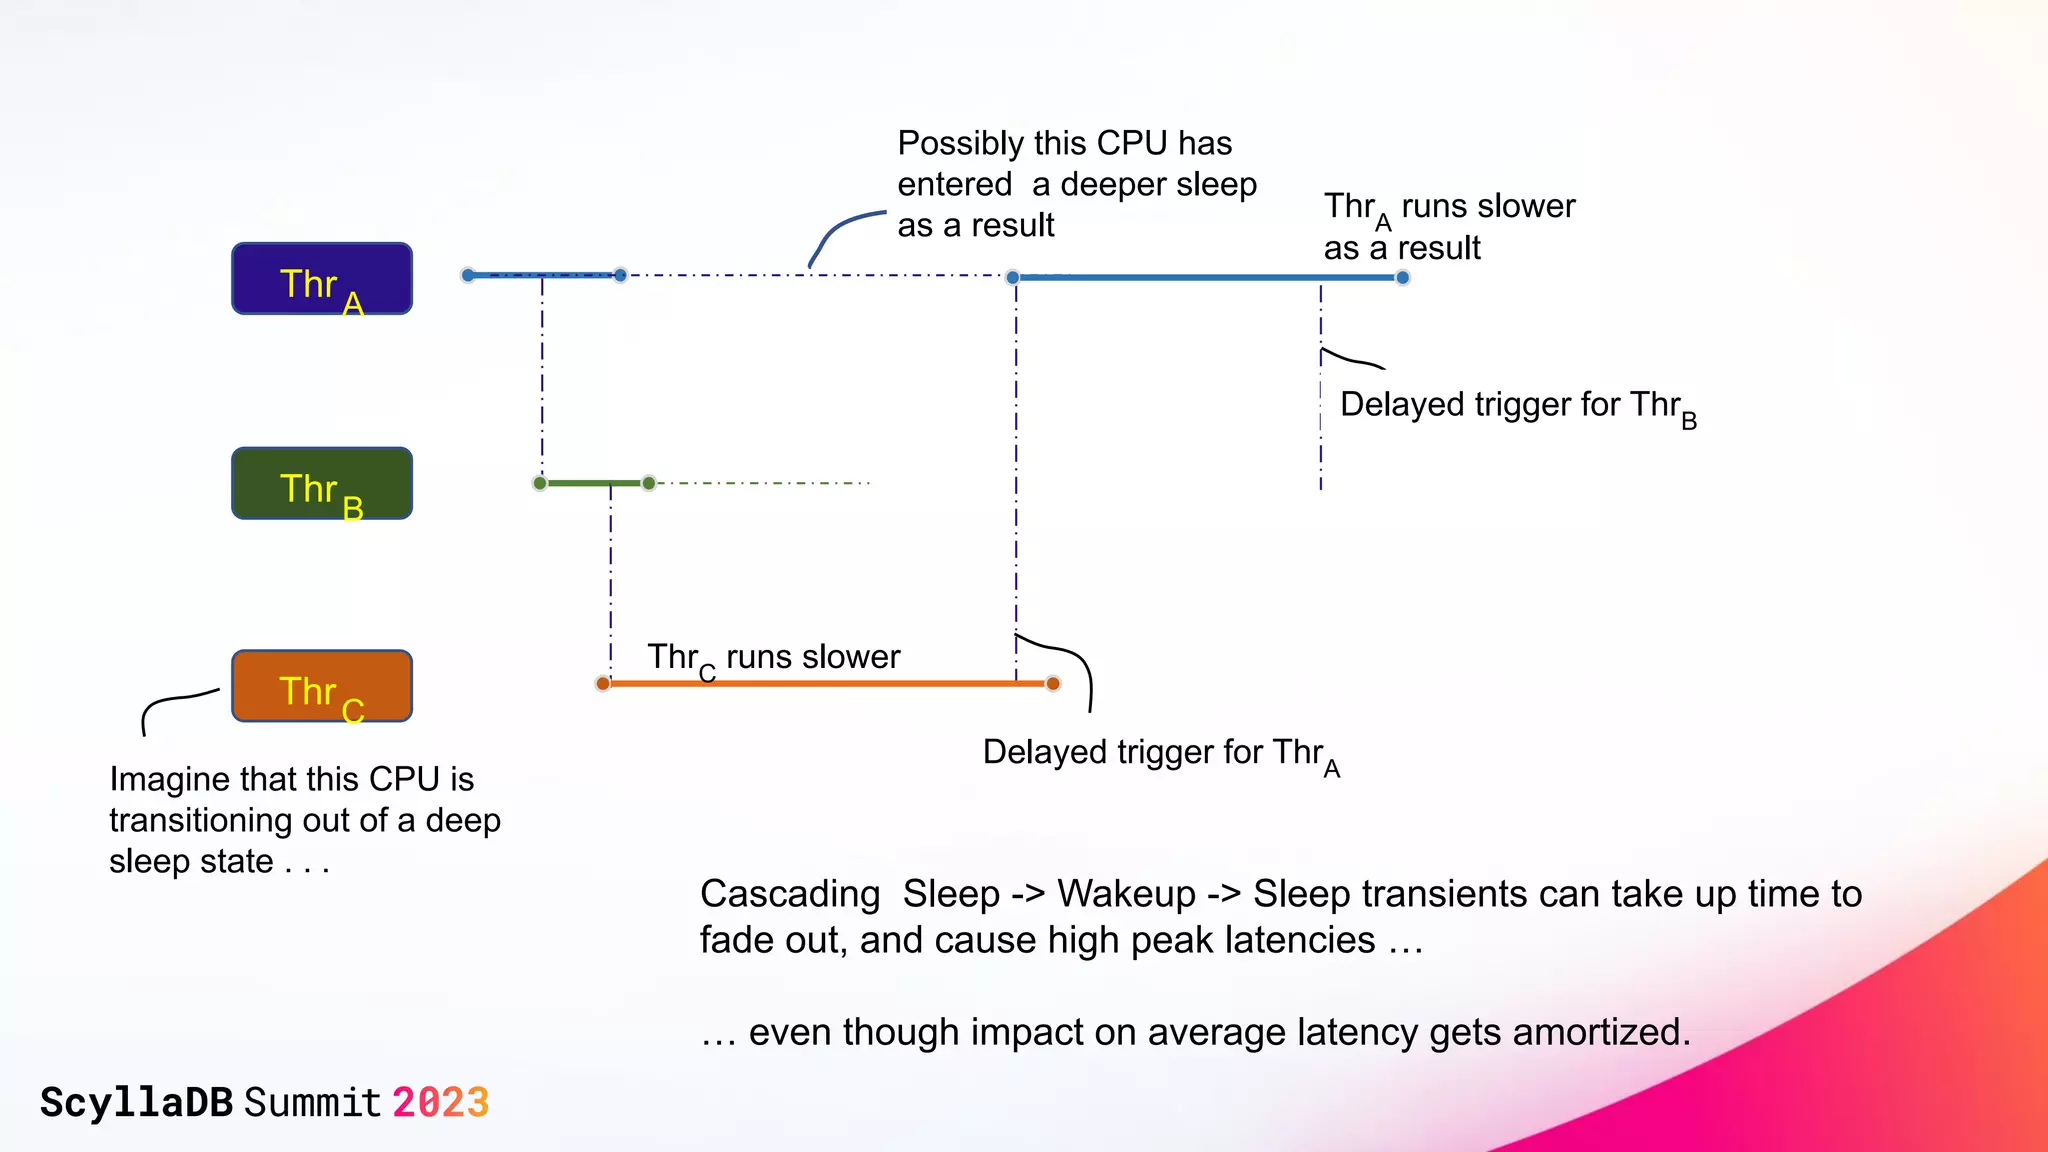
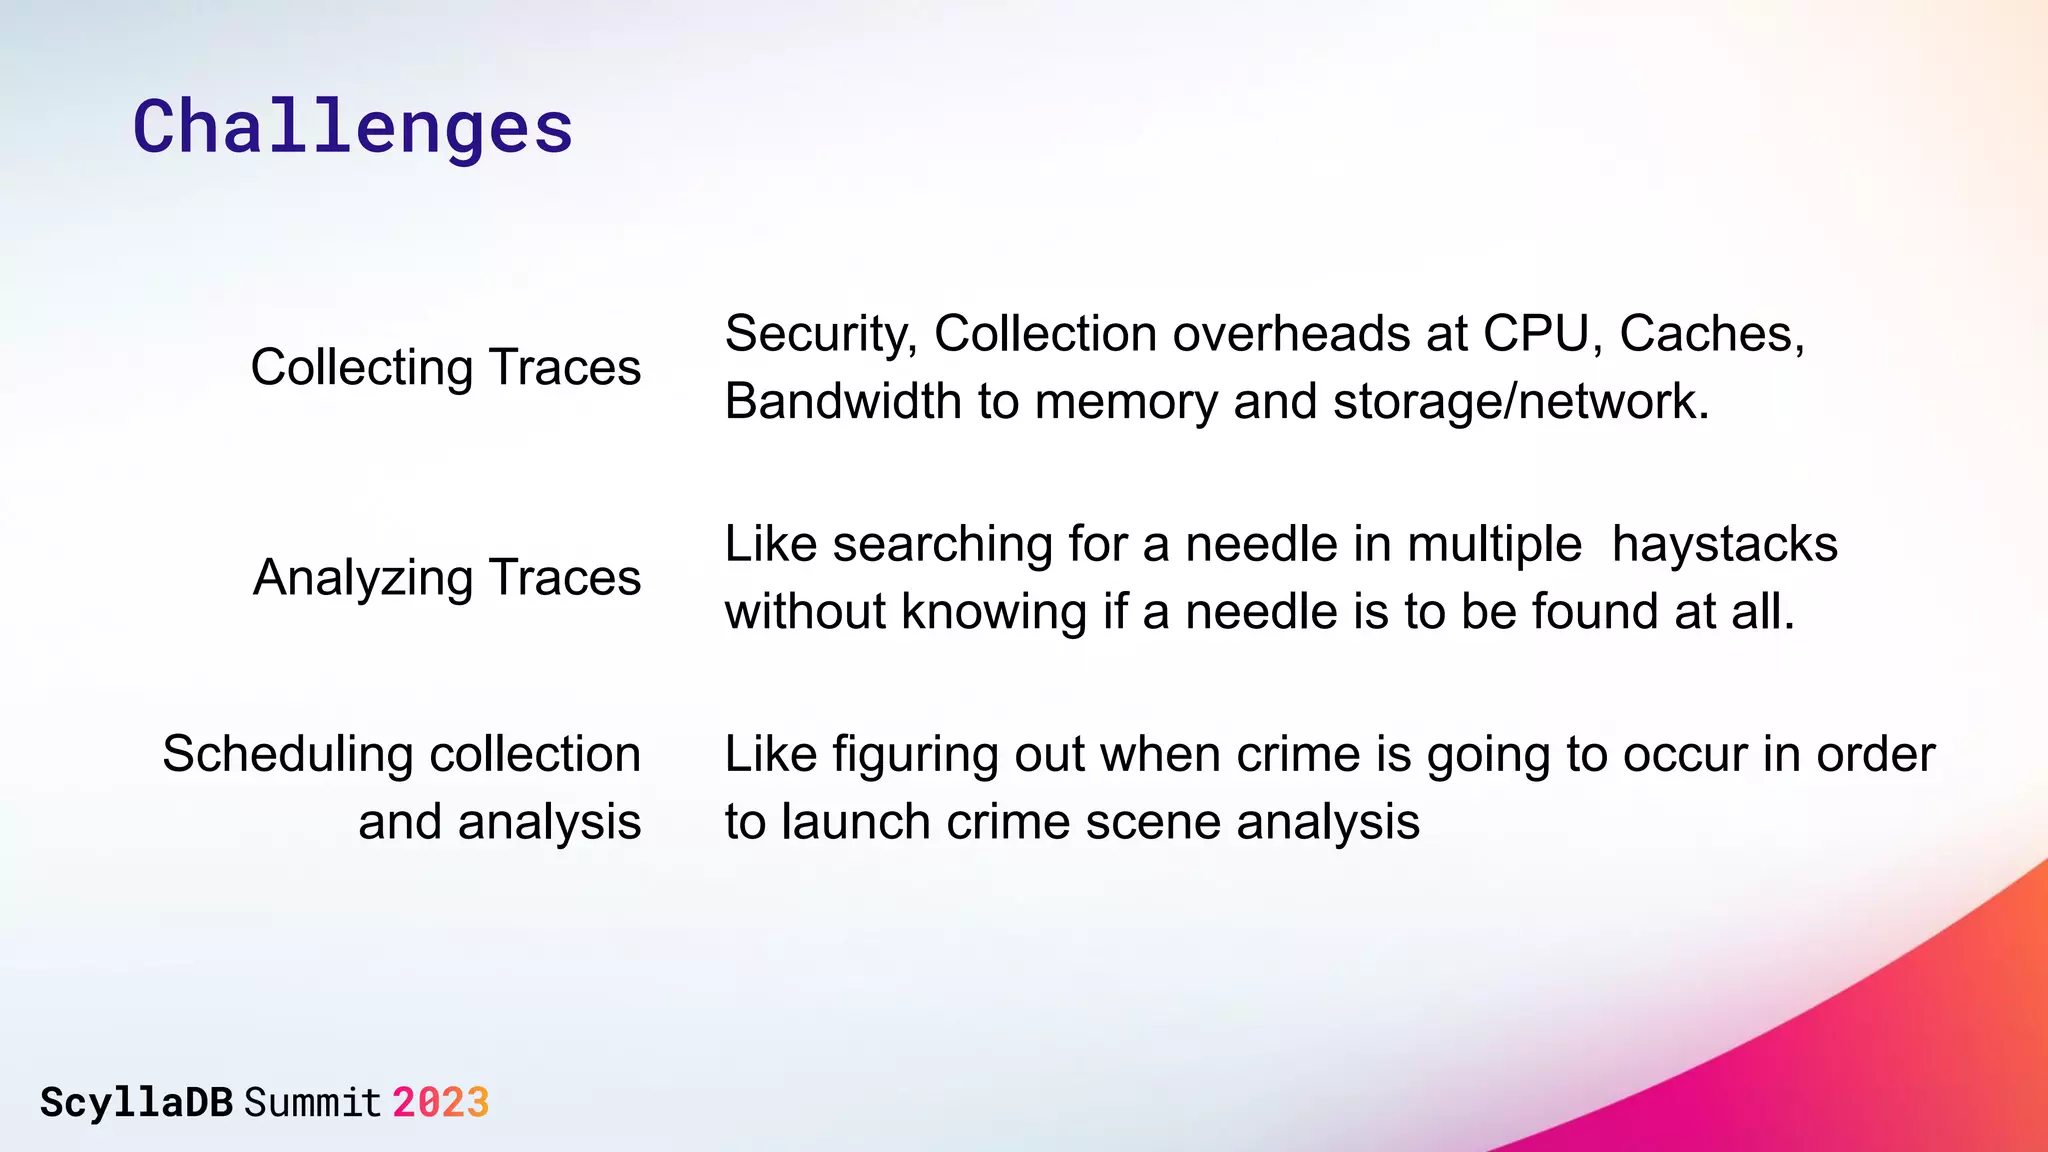
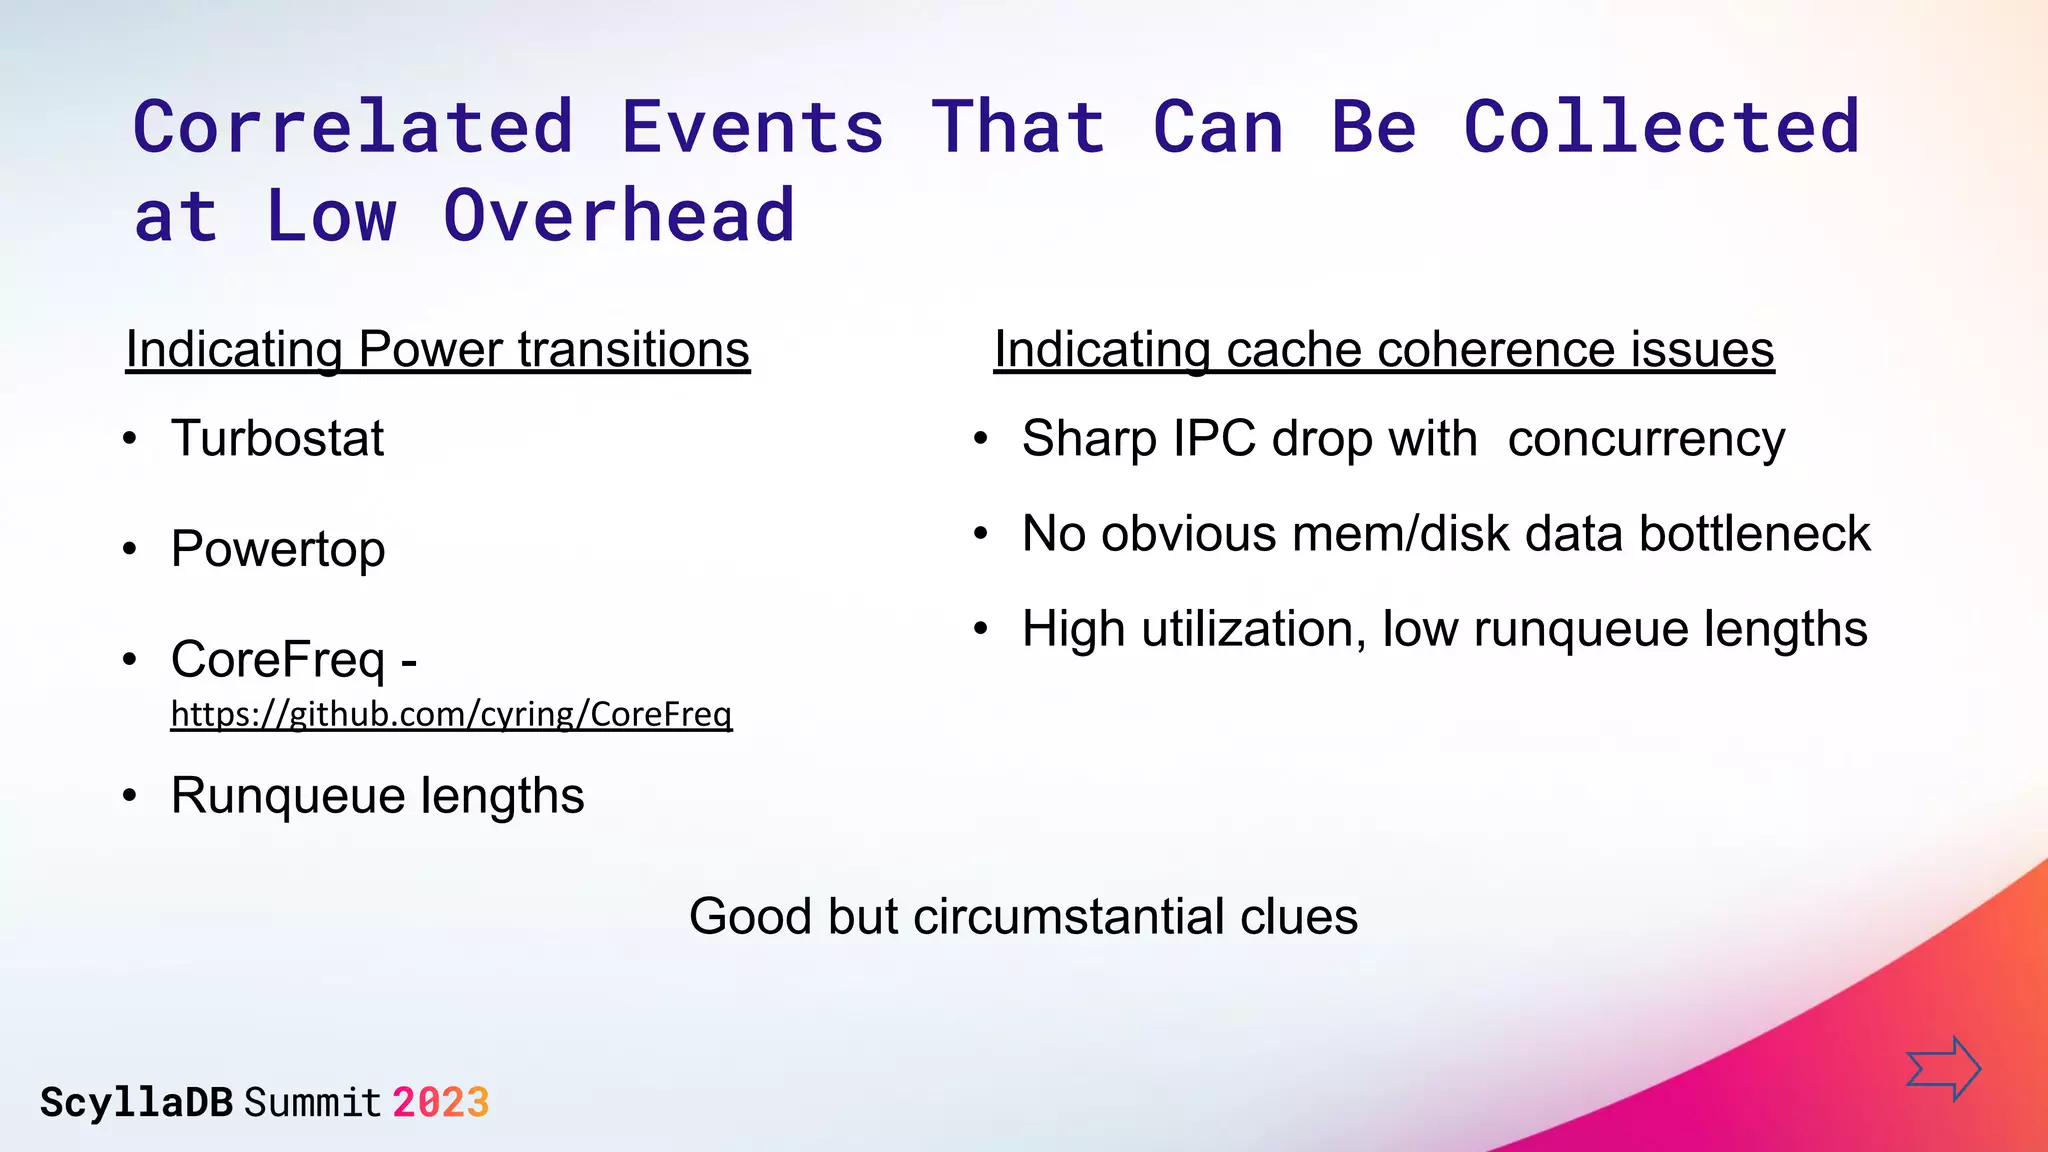
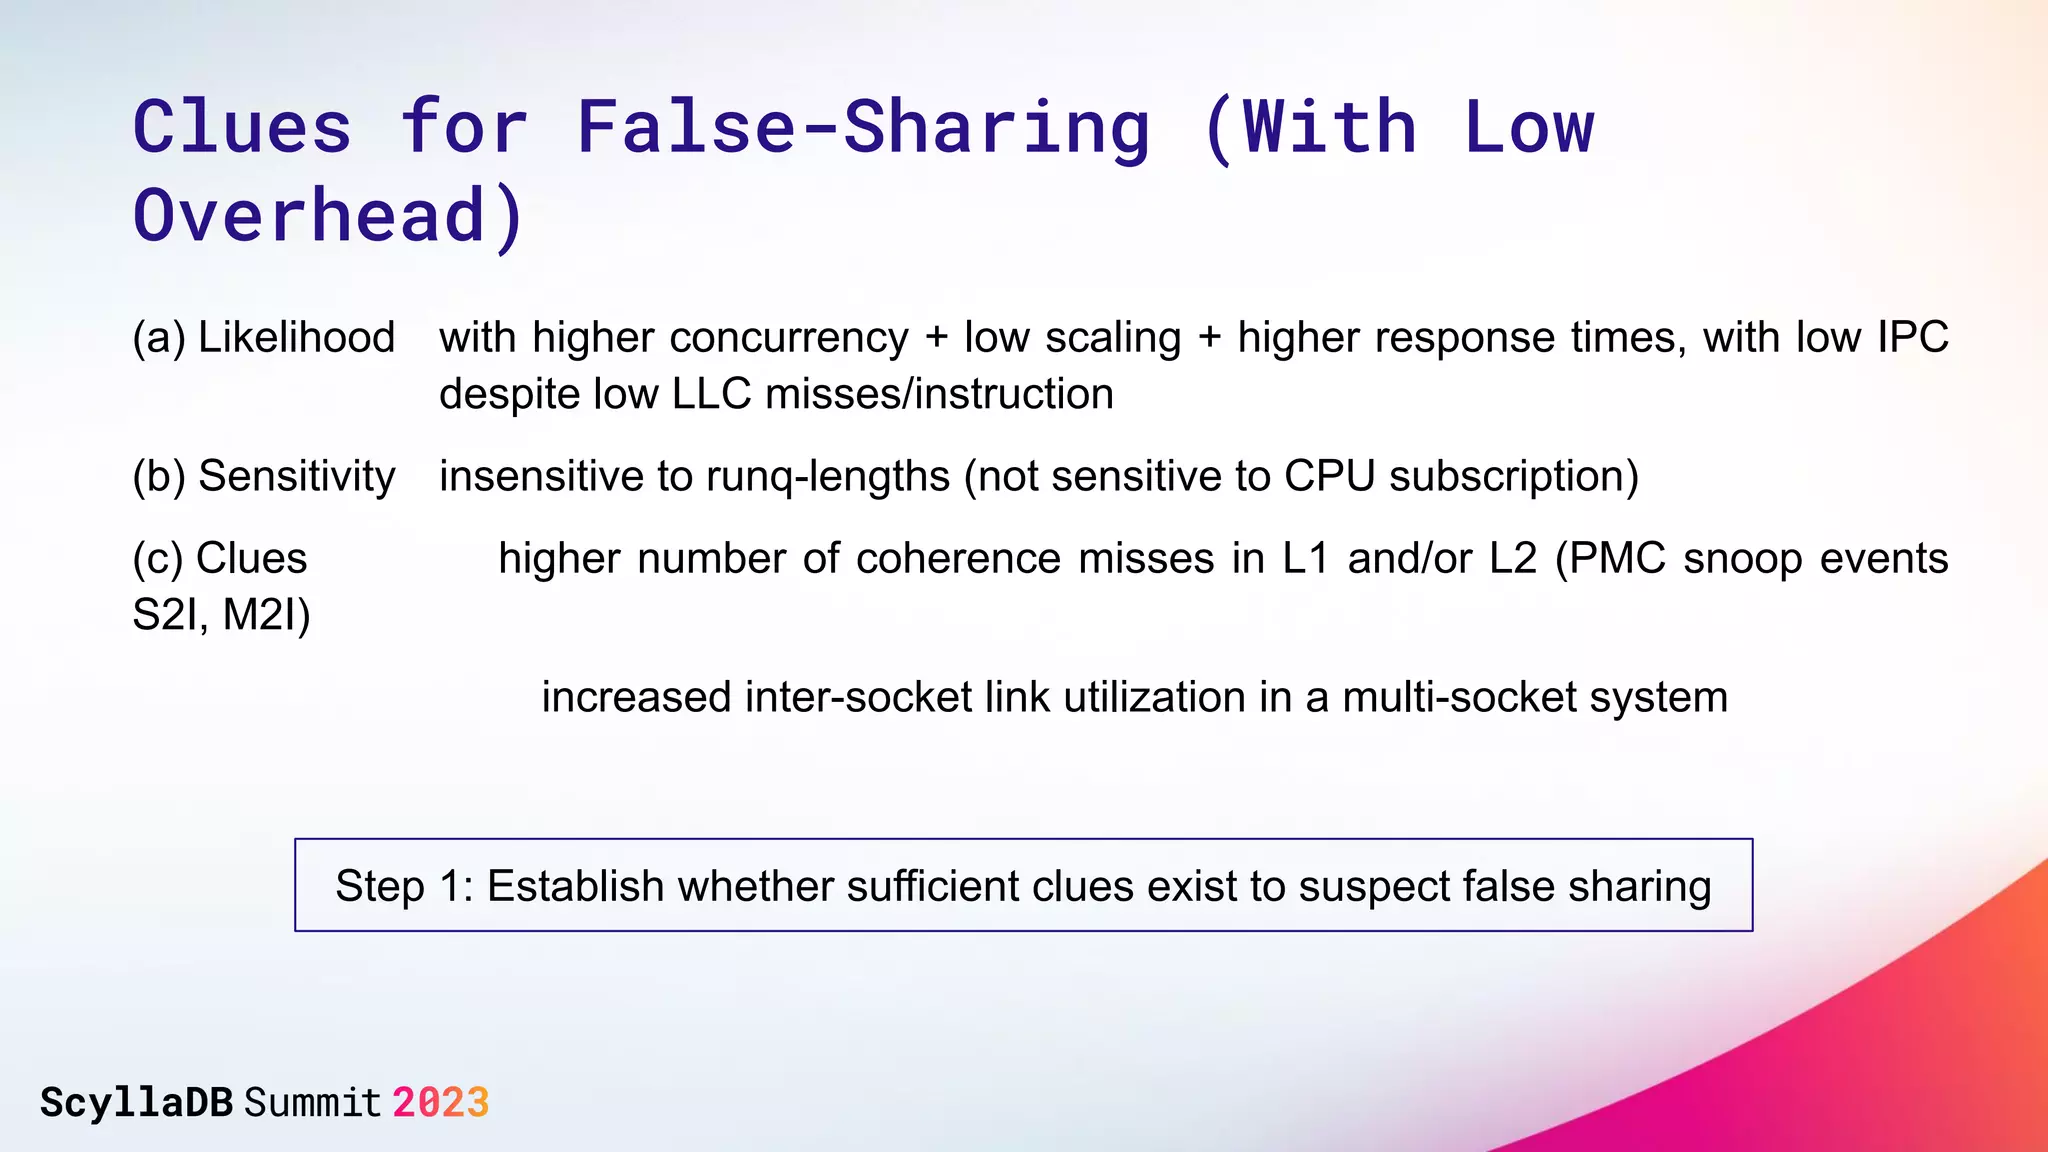
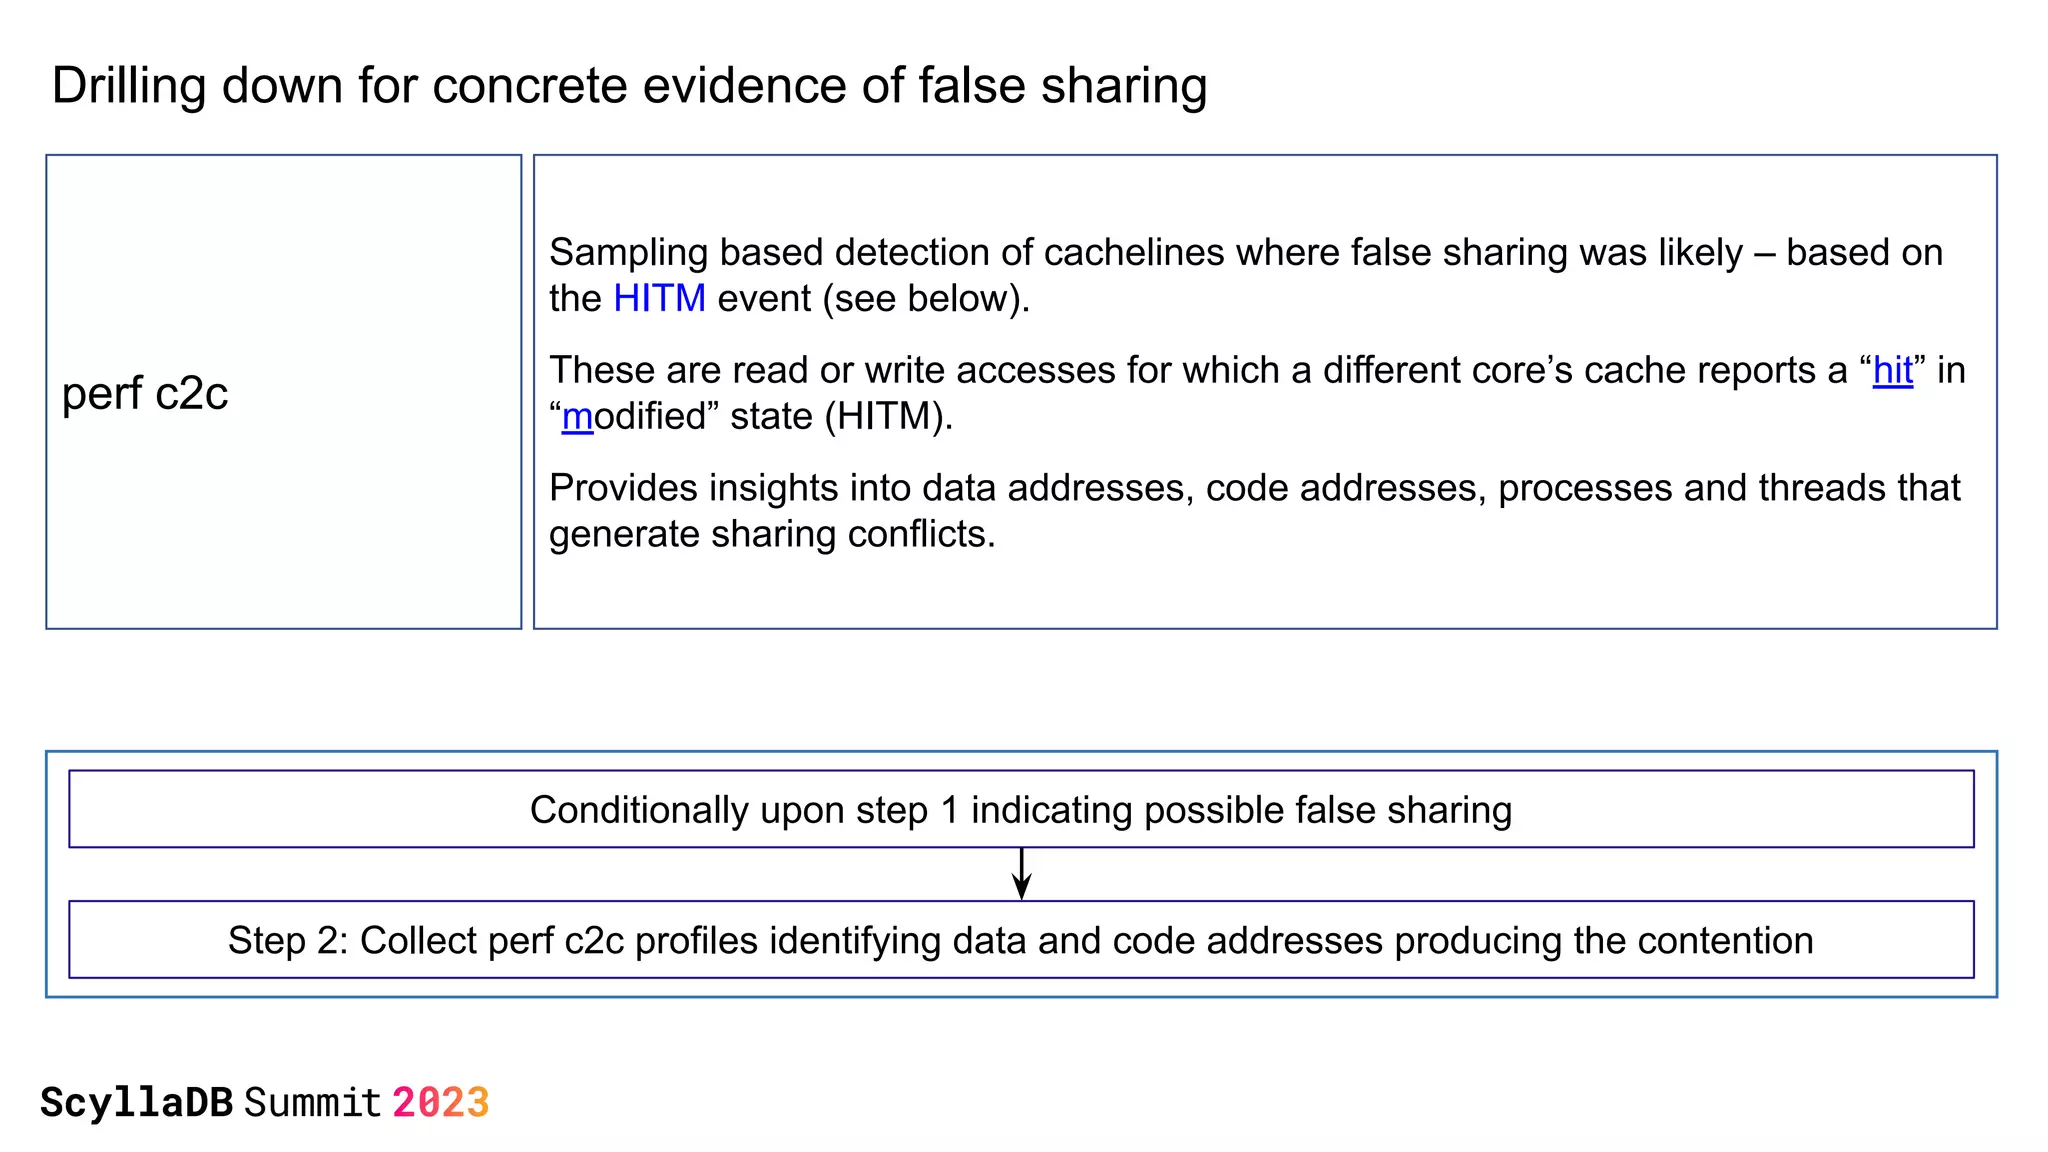
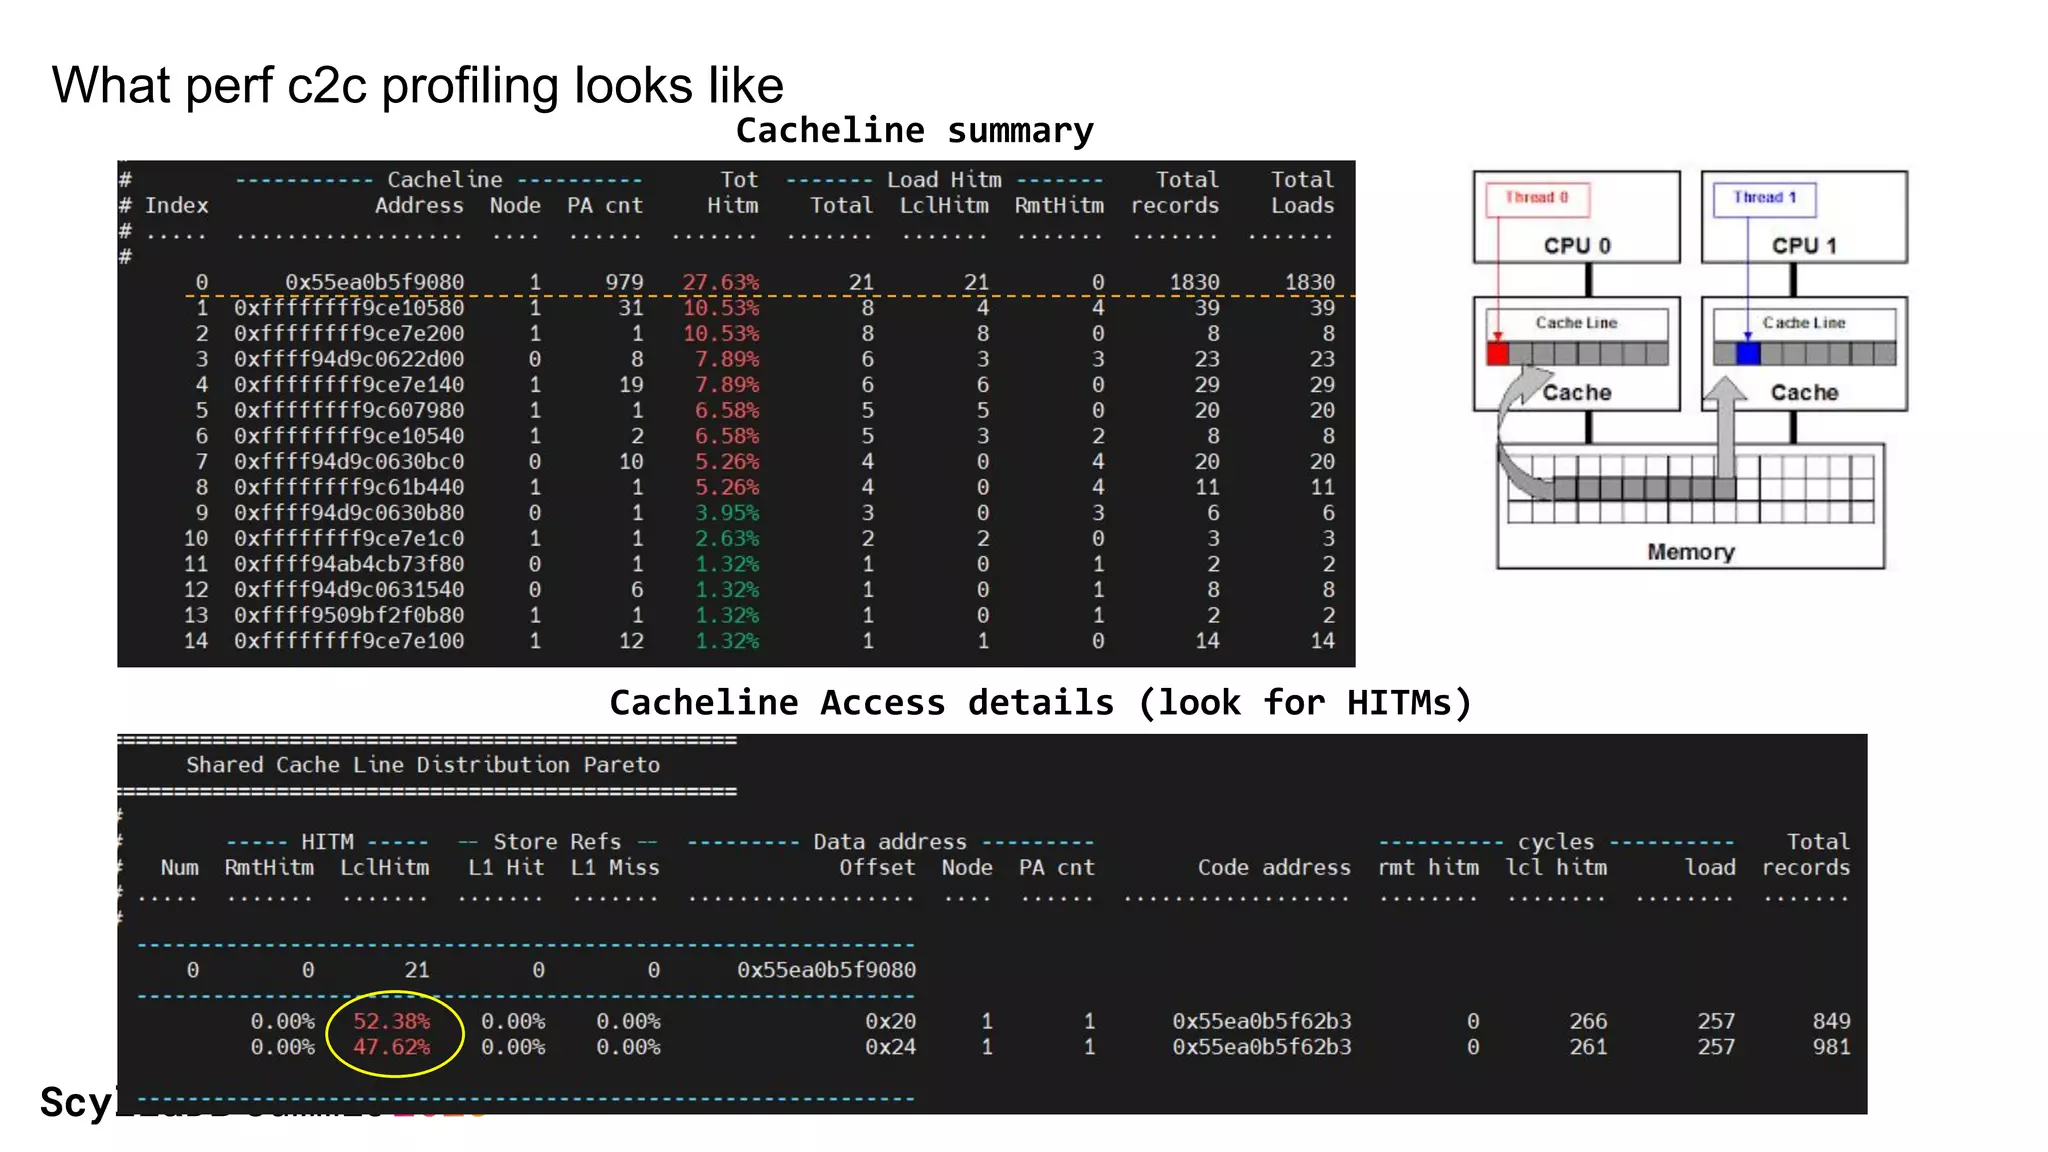

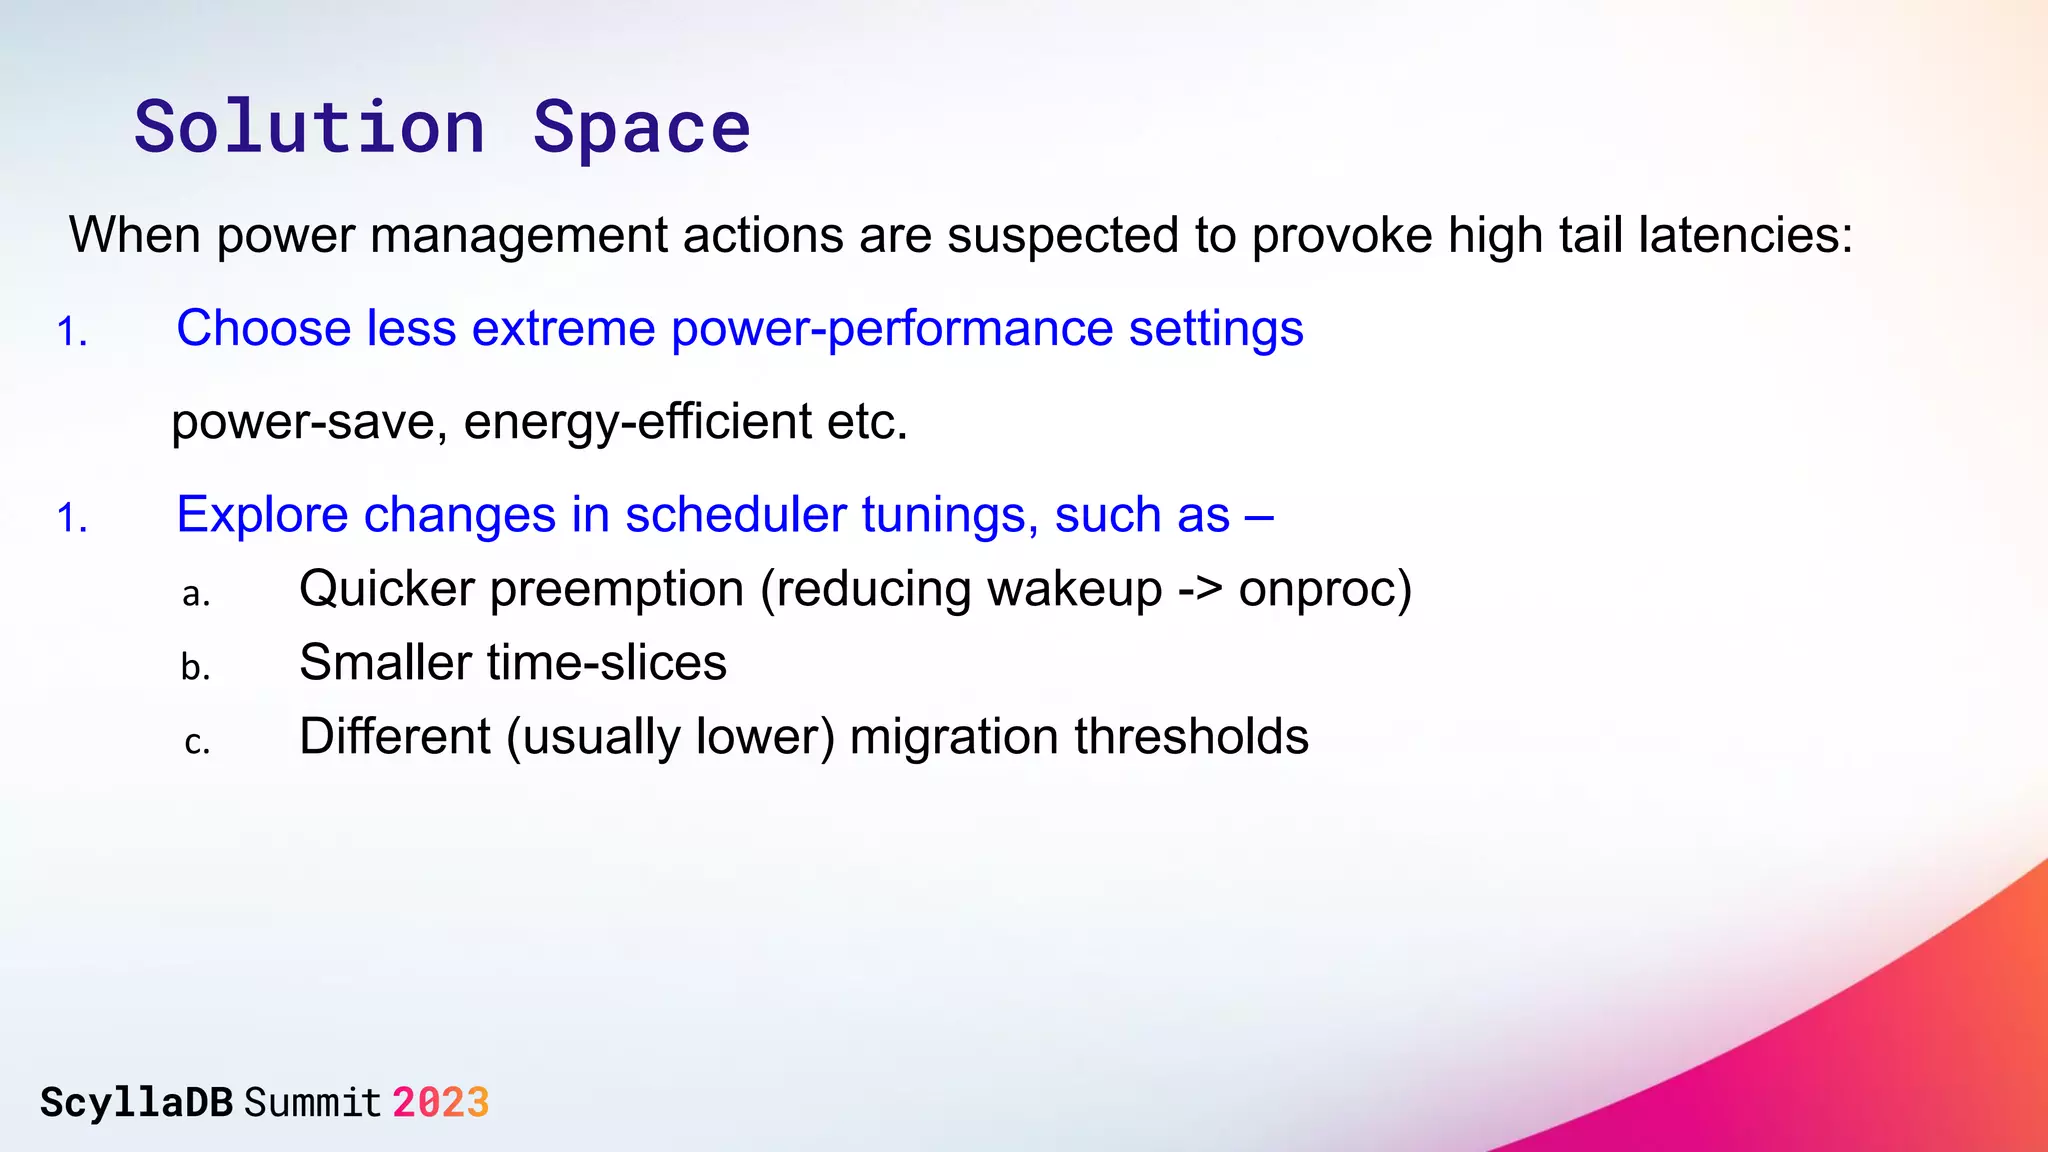
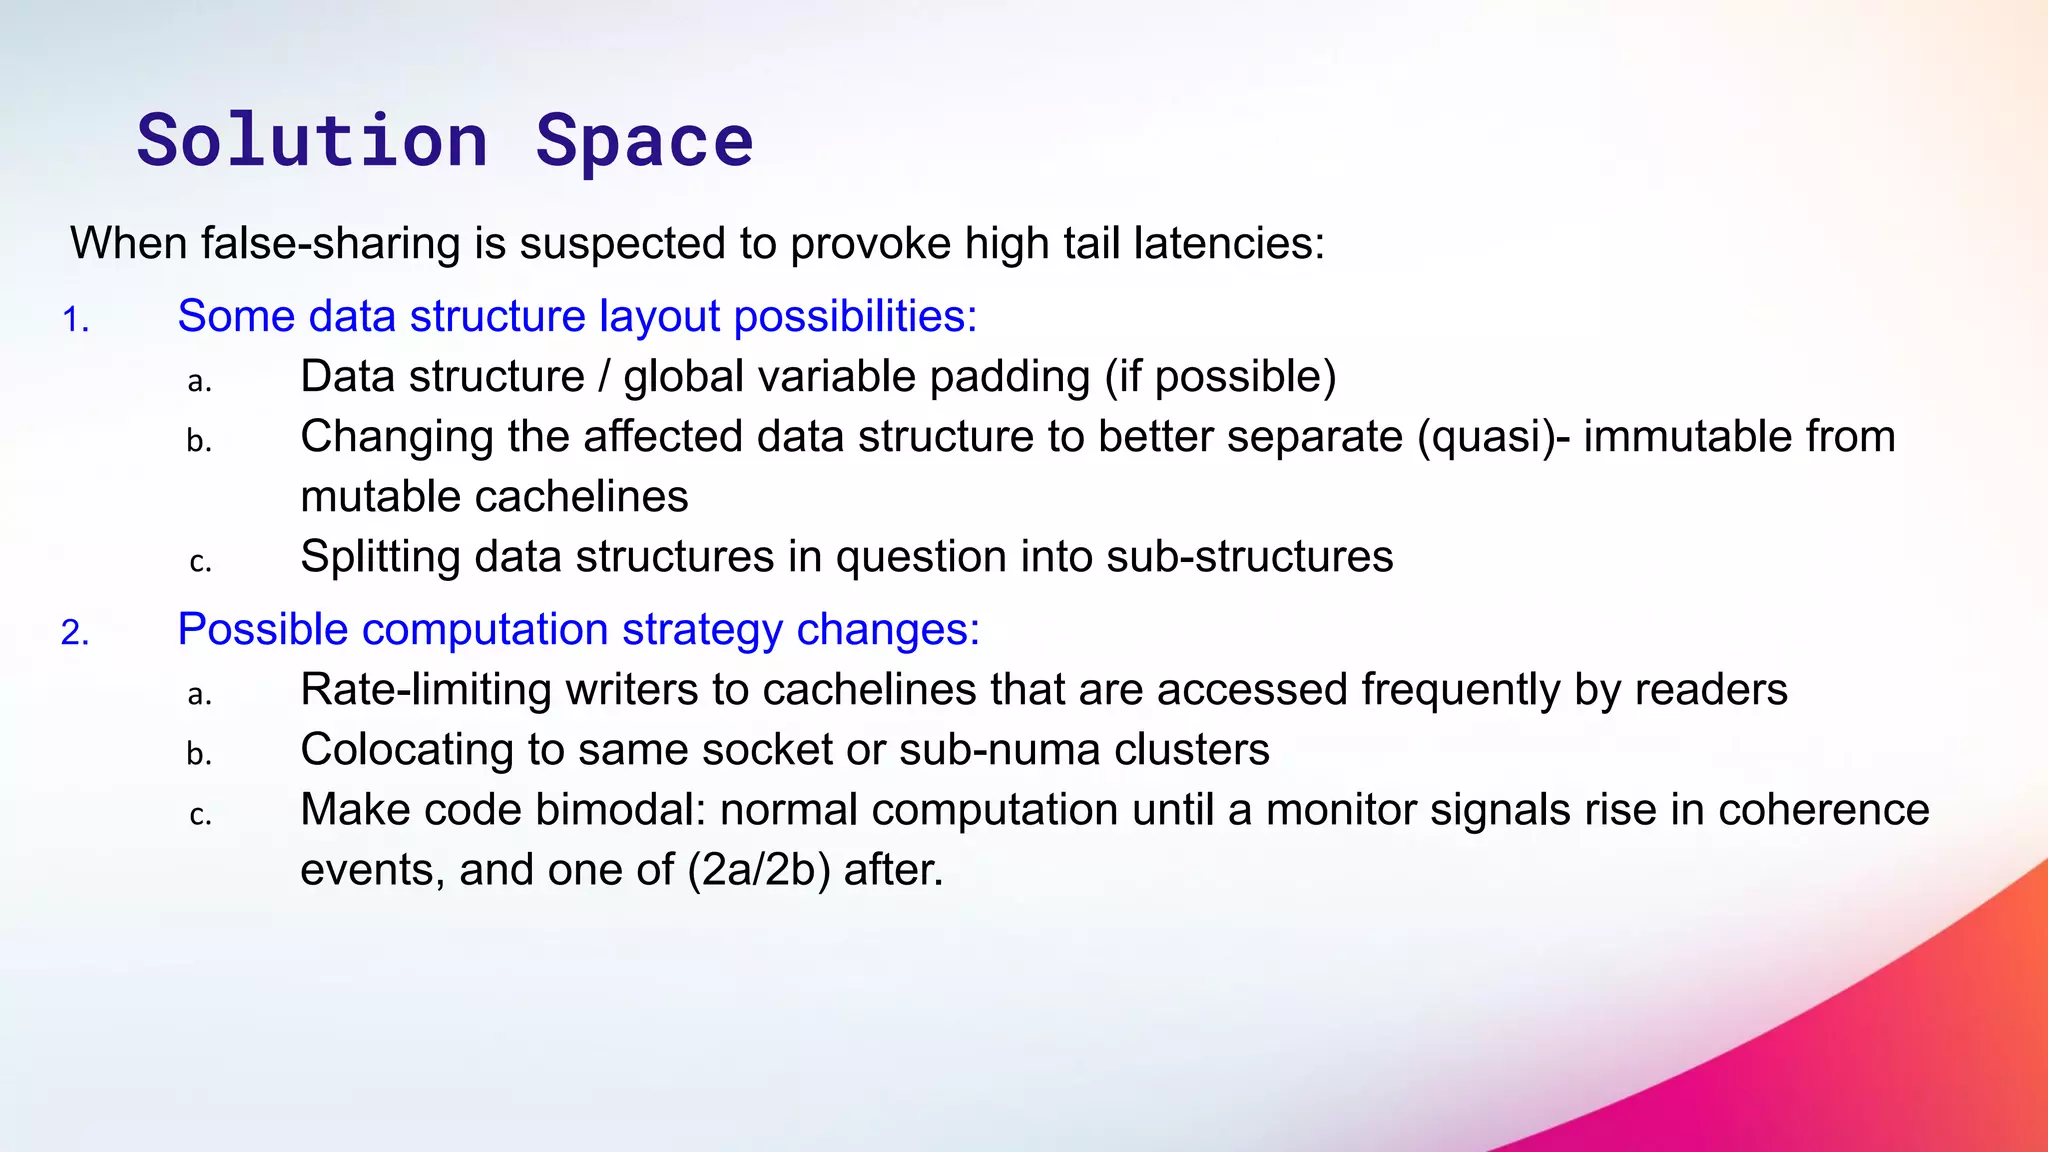
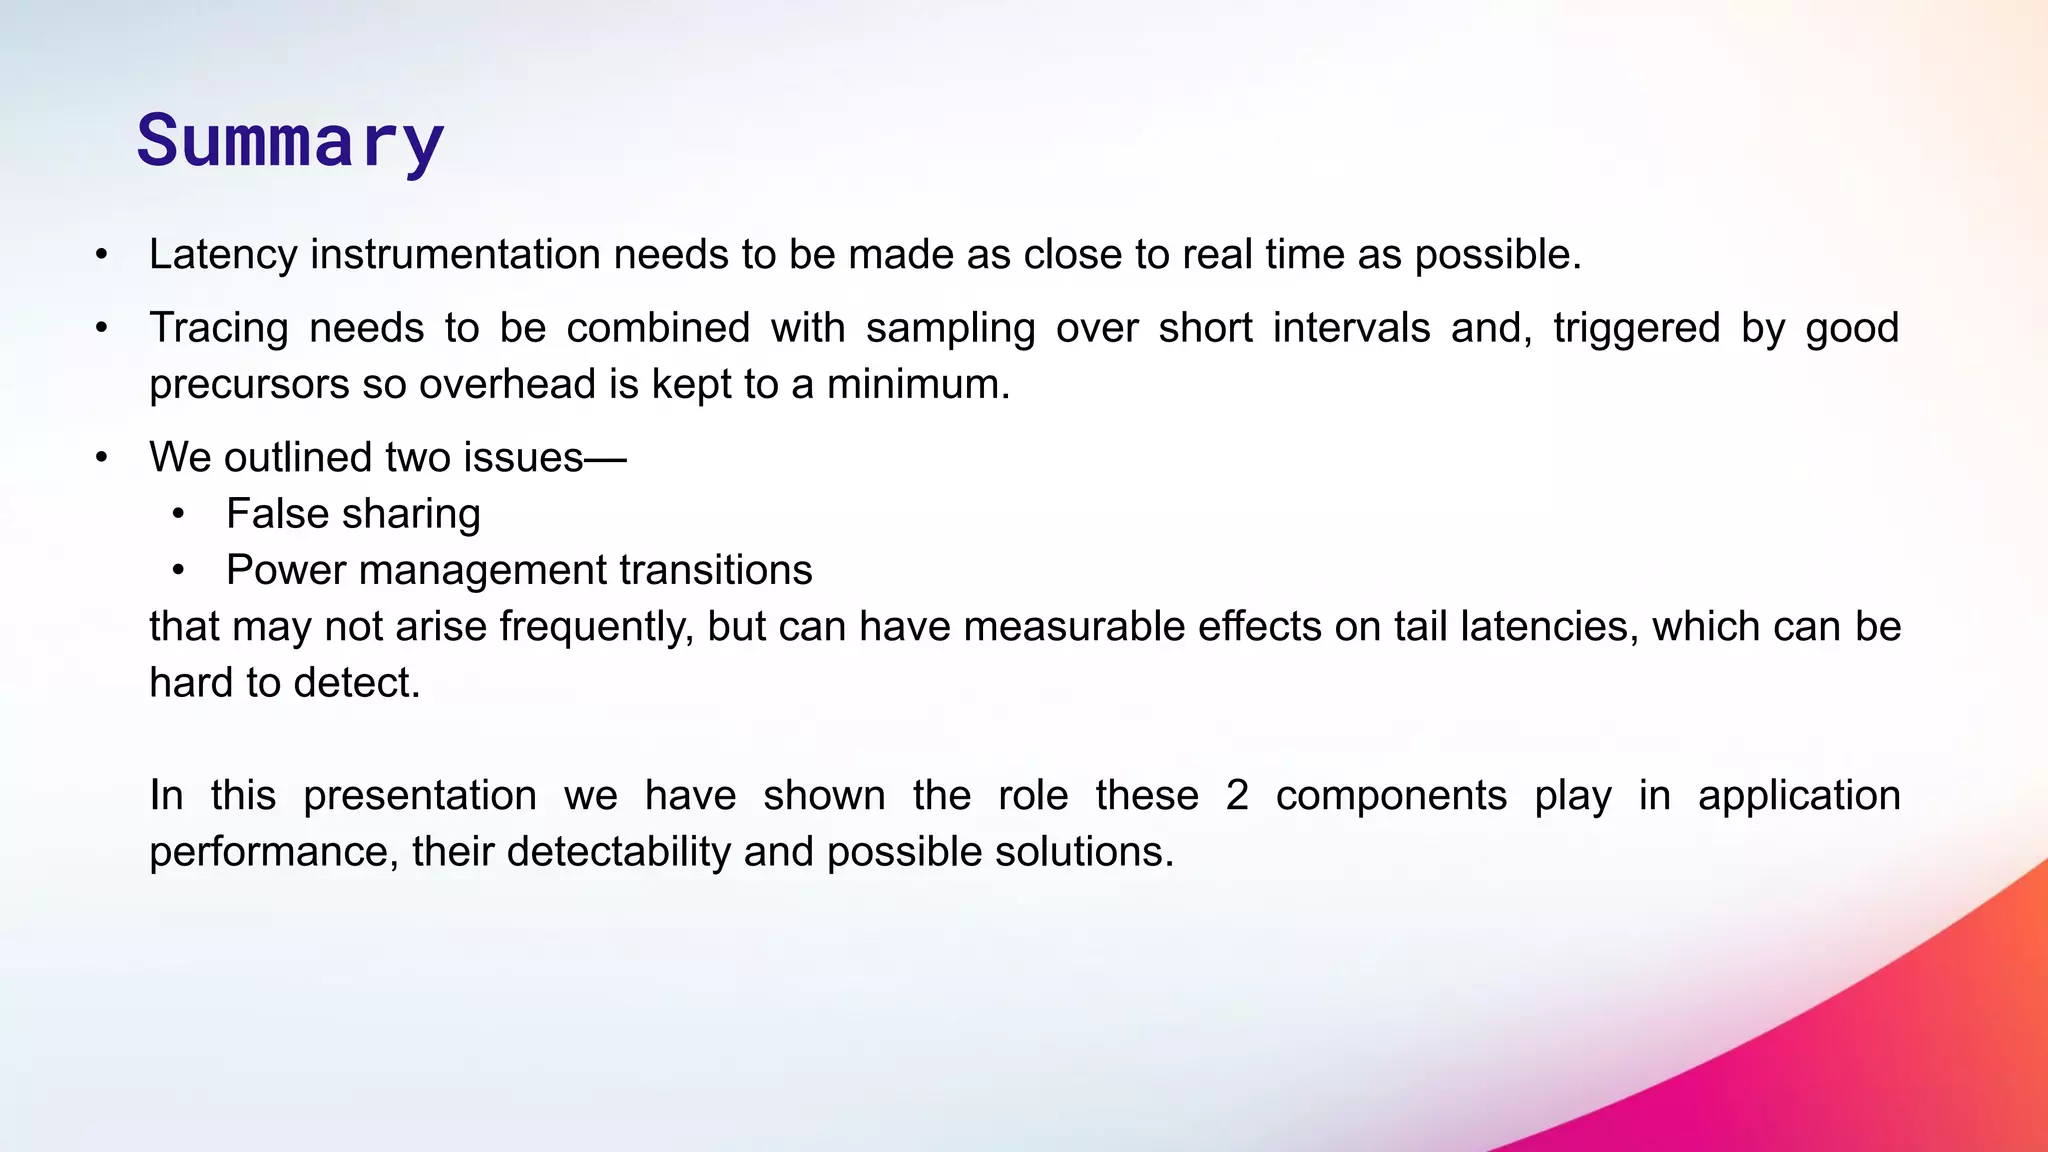

The document discusses two non-obvious sources of latency in applications: false sharing and CPU power management transitions, both of which can lead to unpredictable spikes in response times. It emphasizes the need for effective detection and mitigation strategies to address these issues, including instrumentation and profiling tools. The document concludes by highlighting the importance of understanding these latency causes to improve application performance.


![[BDD 2025 - Artificial Intelligence] Building AI Systems That Users (and Comp...](https://cdn.slidesharecdn.com/ss_thumbnails/ai-buildingaisystemsthatusersandcompanieslove-251124030845-038f7732-thumbnail.jpg?width=640&height=640&fit=bounds)


![[BDD 2025 - Full-Stack Development] Agentic AI Architecture: Redefining Syste...](https://cdn.slidesharecdn.com/ss_thumbnails/fs-agenticaiarchitectureredefiningsystemcommunication-251124030838-e6c70cc2-thumbnail.jpg?width=640&height=640&fit=bounds)


![[BDD 2025 - Mobile Development] Mobile Engineer and Software Engineer: Are we...](https://cdn.slidesharecdn.com/ss_thumbnails/md-mobileengineerandsoftwareengineerarewestillrelevantsidiqpermana-251127010650-55224ef1-thumbnail.jpg?width=640&height=640&fit=bounds)

![[BDD 2025 - Full-Stack Development] Digital Accessibility: Why Developers nee...](https://cdn.slidesharecdn.com/ss_thumbnails/fs-digitalaccessibilitywhydevelopersneedtoknowandcarein2025-251127011019-0674441d-thumbnail.jpg?width=640&height=640&fit=bounds)
![[BDD 2025 - Full-Stack Development] PHP in AI Age: The Laravel Way. (Rizqy Hi...](https://cdn.slidesharecdn.com/ss_thumbnails/fs-phpinaiagethelaravelway-251125012602-ef9d330e-thumbnail.jpg?width=640&height=640&fit=bounds)


![Support, Monitoring, Continuous Improvement & Scaling Agentic Automation [3/3]](https://cdn.slidesharecdn.com/ss_thumbnails/agenticcommunityseries-day3-cfd-251120170304-ddef8112-thumbnail.jpg?width=640&height=640&fit=bounds)
