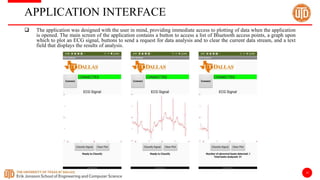
Cloud computing can be a useful tool to analyze bio signals; when that methodology is combined with the over-the-air transfer of data, it allows healthcare providers to access relevant information on a lightweight mobile interface. Here, we develop an Android application that receives an ECG signal over Bluetooth, plots the data stream, and allows a user to send a biosignal analysis request to determine if any abnormality is present in the ECG signal. The application can receive the result of the analysis within seconds of time, allowing healthcare providers to efficiently analyze incoming data.
UNIT-V FMM.HYDRAULIC TURBINE - Construction and working
Cloud-based ECG classification with mobile interface.pptx
1. CLOUD-BASED ECG CLASSIFICATION WITH MOBILE INTERFACE
Epperson, Joseph David (jde160530@utdallas.edu)
Hoff, Jason (jxj143230@utdallas.edu)
Noor Shoudha, Shamman (sxn170028@utdallas.edu)
2. 2
ECG NOISE FILTERING USING WAVELET TRANSFORM
Summary:
• We applied wavelet transform to denoise ECG signals.
• We investigated three types of mother wavelet basis functions: Daubechies filter (DB), Symmlet filter (Sym) and Coiflet filter
(C) for Signal-to-noise (SNR) values -6, 0, 6, 12, 18 and 24 DB for ECG signals from MIT-BIH Noise Stress Test Database.
• To analyze different denoising methods, we computed three benchmark metrics: Root-Mean-Square-Error (RMSE),
Percentage Root mean square Difference (PRD) and improvement to signal to noise ratio (𝑆𝑁𝑅𝑖𝑚𝑝).
Database:
• For clean and noisy ECG signals, we used the MIT-BIH Noise Stress Test Database.
• The ECG signals in this database have two types of signals: ML-II and V1. The record 118 is used for clean signals and
records 118e_6, 118e00, 118e06, 118e12, 118e18, 118e24 are used for ECG signals with SNR -6, 0, 6, 12, 18 and 24 DB,
respectively.
• Noise was added beginning after the first 5 minutes of each record, during two-minute segments alternating with two-minute
clean segments.
System Model:
• If we denote the clean, noisy and denoised ECG signals as 𝑥, 𝑥 and 𝑥, respectively, we can write the wavelet denoising
method as follows:
𝑥 = 𝐹𝐷𝑊𝑇(𝑥)
where, 𝐹𝐷𝑊𝑇 . denotes the discrete wavelet transform denoising filtering mechanism.
3. 3
METHODOLOGY
After downloading the ECG signals from the database, the first 5 minutes of data is
discarded as the starting 5 minutes of signal contains signal without any noise.
A 2 minutes window is constructed to extract 2 minutes of noisy data.
After windowing the noisy signal for 2 minutes, MATLAB function “wdenoise” is used to
filter the ECG signal using wavelet transform.
The function wdenoise(x, N, Name, Value) takes as input the following parameters:
x - Noisy signal
N - Level of wavelet transform
'Wavelet' - Type of mother wavelet basis function
'DenoisingMethod' - Denoising method to be used
'ThresholdRule' - Thresholding rule depends on the denoising methods used
'NoiseEstimate' - Level dependent or level independent noise estimate
4. 4
METHODOLOGY
For the ‘Wavelet’ property, we explored three different types of basis functions:
1. Daubechies filter with order 4
2. Coiflet filter with order 4
3. Symmlet filter with order 8
To compare the clean, noisy and denoised signals, we computed the following three benchmark metrics:
• Root-mean-square error (RMSE): RMSE is the root-mean-square error difference between the denoised (𝑥) and original
(𝑥) ECG signals. Smaller RMSE value implies better performance of denoising model.
𝑅𝑀𝑆𝐸 =
1
𝑁 𝑛=0
𝑁
𝑥 𝑛 − 𝑥 𝑛 2
• Percentage root mean square difference (PRD): PRD computes the total distortion present in the denoised signal. A lower
PRD represents a better quality of the denoised signal.
𝑃𝑅𝐷 = 𝑛=0
𝑁 𝑥 𝑛 −𝑥 𝑛 2
𝑛=0
𝑁 𝑥 𝑛 2 × 100
• Improvement to signal to noise ratio (SNRimp): SNRimp is the improvement in the SNR levels between the input and the
output.
SNRimp = SNRout − SNRin
𝑆𝑁𝑅𝑜𝑢𝑡 = 10 × log10
𝑛=0
𝑁 𝑥 𝑛 2
𝑛=0
𝑁 𝑥 𝑛 −𝑥 𝑛 2
𝑆𝑁𝑅𝑖𝑛 = 10 × log10
𝑛=0
𝑁 𝑥 𝑛 2
𝑛=0
𝑁 𝑥 𝑛 −𝑥 𝑛 2
11. 11
OBSERVATIONS
1. For DB4 filter, the denoising method “Minimax” with soft thresholding rule performed best in
terms of RMSE, PRD and SNRimp performance metrics.
2. The denoising filter DB4 shows RMSE, PRD improvement for V1 ECG signal. But for ML-II
signal, DB4 did not show RMSE and PRD improvement after denoising.
12. 12
ECG BEAT CLASSIFICATION USING BINARY SVM CLASSIFIER
Summary:
• We applied a binary SVM classifier to classify ECG beats.
• We applied the Pan-Tompkin algorithm to detect the QRS complex in the ECG signal.
• Using the detected QRS complex, we extracted the P and T peaks. After extracting the P, Q, R, S, and T peaks, we computed
multiple morphological features that represent timing, area, energy and correlation information of each ECG beat.
• Applying the binary SVM classifier, we achieved an overall classification accuracy of 98.6% classifying the ECG beats into
two classes: normal and abnormal.
Database:
• Five records from the MIT-BIH Arrhythmia Database were selected for this work. They contain half-hour excerpts of two-
channel ambulatory ECG recordings, obtained from 5 subjects of different ages ranging from 24 to 87. The ECG signals are
digitized at 360 samples per second per channel. The summary of the ECG records are given in Table 1:
Record Beat type
100 33 A, 2239 Normal
105 41 V, 2526 Normal
106 520 V, 1507 Normal
209 383 A, 2621 Normal
220 94 A, 1954 Normal
13. 13
METHODOLOGY
The methodology of the feature extraction and classification can be summarized into three
main categories: ECG beat detection, feature extraction, SVM training and testing. Figure 1
shows the overall methodology block diagram:
14. 14
METHODOLOGY
ECG beat detection:
The Pan-Tompkin algorithm was applied to detect the QRS complexes present in each ECG record. Figure 2 shows the steps of
the Pan-Tompkin algorithm.
Feature Extraction:
After extracting the location of the R peaks, the location of the P and T peaks were found using simple time thresholding and
peak-finding methods in MATLAB. Once all the P, Q, R, S and T peaks of each ECG beat were found, the following
morphological features were extracted from each beat. MATLAB ‘trapz’ function was used to find the area under curves.
1. QS Width: Distance between Q and S peaks
2. Pre RR-Interval: Distance between current and previous beats’ R peaks
3. Post RR-Interval: Distance between current and next beats’ R peaks
4. QR Width: Distance between Q and R peaks
5. RS Width: Distance between R and S peaks
6. Mean Power Spectral Density: Average square magnitude of fourier transform of ECG beat
7. Area Under QR: Area covered by ECG signal from Q to R peaks
8. Area Under RS: Area covered by ECG signal from R to S peaks
16. 16
METHODOLOGY
SVM Training and Testing:
After detecting the ECG beats and extracting their features, a feature matrix is formed with each row
representing the feature vector of size 8 for each beat.
From the annotation files of MIT-BIH Arrhythmia Database, the labels of each ECG beats (normal or
abnormal) are extracted and saved for SVM training.
All the beats are divided into two classes: normal (label 1) and abnormal (label 0). As the database is highly
imbalanced in terms of number of normal and abnormal beats, both the normal and abnormal beats are divided
into training and testing sets separately.
We used 60% of the beats for training and 40% for testing the trained SVM model. Radial Basis Function
(RBF) or Gaussian kernel is used in MATLAB to train the SVM model.
After the training is complete, the trained model is used to classify the test ECG beats. Table 2 shows a
summary of the training and testing sets.
Number of beats 11992
Normal beats 10946 (6568 training, 4378 testing)
Abnormal beats 1046 (628 training, 418 testing)
17. 17
RESULT
We achieved an overall accuracy of 98.46% with the 8 morphological features of ECG beats.
True negative (actual abnormal - predicted abnormal) 93.06%
True positive (actual normal - predicted normal) 99.13%
False negative (actual normal - predicted abnormal): 0.87%
False positive (actual abnormal - predicted normal) 6.94%
Overall accuracy 98.60%
18. 18
• Summary:
• Cloud computing can be a useful tool to analyze bio signals; when that
methodology is combined with over-the-air transfer of data, it allows
healthcare providers to access relevant information on a lightweight
mobile interface.
• Here, we develop an Android application that receives an ECG signal
over Bluetooth, plots the data stream, and allows a user to send a bio
signal analysis request to determine if any abnormality is present in the
ECG signal.
• The application can receive the result of the analysis within seconds of
time, allowing healthcare providers to efficiently analyze incoming data.
• Methodology:
• In this project, we used previously described processes with a new
interface to analyze ECG signals from MIT-BIH Arrhythmia Database in
MATLAB. This was done by connected a user via Android application to
a server capable of applying the Pan-Tompkin algorithm to find the P, Q,
R, S, and T waves of an ECG signal. The server can extract the features
of the processed waves and use them as inputs of a supervised machine
learning algorithm. We implemented this Support Vector Machine
(SVM) to learn the characteristics of normal and abnormal heartbeats
from the morphological features of the extracted waves.
• The trained model that was obtained from our SVM can be used as a tool
during ECG analysis. We have created an Android application that can
be used to interface with an ECG signal access point, such as a server
with stored data. By inputting a new ECG signal into the classifier, we
can compare the feature vector of the new signal against our SVM model
to determine the number of beats that were analyzed, in addition to the
number of abnormal beats that were detected. Figure 1 illustrates the
flow of data.
CLOUD-BASED ECG CLASSIFICATION WITH MOBILE INTERFACE
19. 19
APPLICATION INTERFACE
The application was designed with the user in mind, providing immediate access to plotting of data when the application
is opened. The main screen of the application contains a button to access a list of Bluetooth access points, a graph upon
which to plot an ECG signal, buttons to send a request for data analysis and to clear the current data stream, and a text
field that displays the results of analysis.
20. 20
HARDWARE
The prototype of the device created for this project used external, off-the-shelf hardware for wireless communication. A
SparkFun BlueSMiRF Silver was integrated with an Arduino Mega 2560 and an LG gram laptop for the server to mobile
device communication. A Google Pixel 2 XL was used as the mobile device for testing.
21. 21
SOFTWARE
Serial communication for data transfer via Bluetooth was used between the MATLAB application and the Pixel 2 XL
device. The EGC signal was transferred in 12-byte packages to stay below the limit of the serial buffer. The Arduino
sketch was written using the Software Serial library to send incoming serial data to the BlueSMiRF for outgoing serial
communication, and incoming data from the BlueSMiRF to the outgoing serial port of the Arduino.
The Android application was developed with MIT App Inventor 2, which provided a cloud-based GUI for Android
development and live testing.
22. 22
VIDEO DEMONSTRATION
The following video demonstrates the final result of this project titled “Cloud-based ECG classification
with mobile interface”: