Download as PDF, PPTX


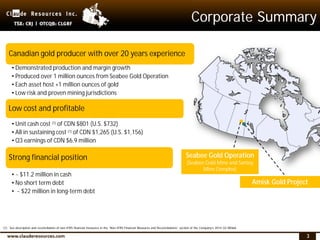
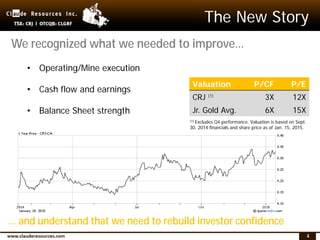
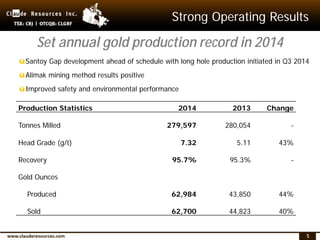
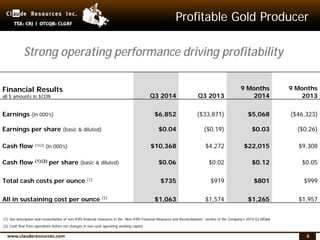
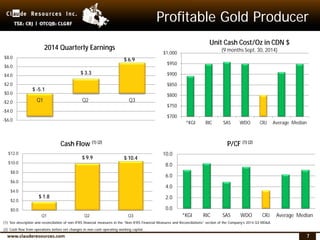
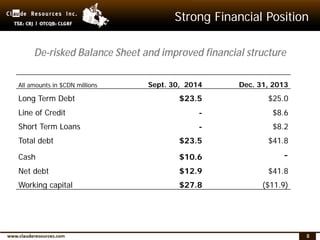
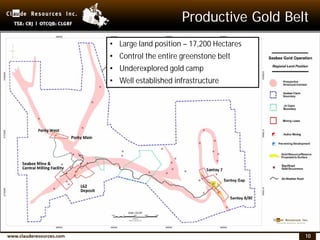
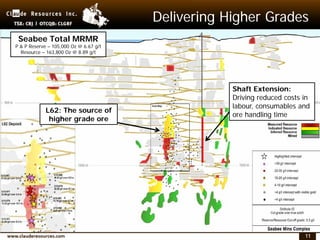
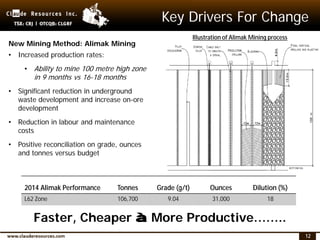
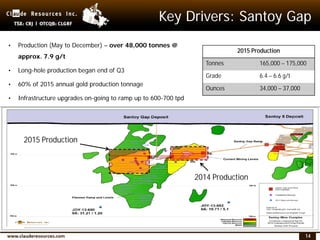
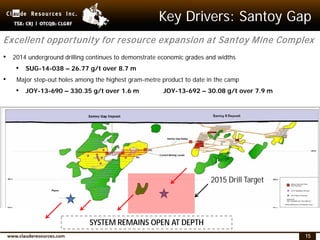

Claude Resources Inc. held a corporate presentation at the BMO Metals & Mining Conference in 2015. The presentation highlighted the company's strong operating and financial results in 2014, including record gold production and lower unit costs. It also outlined plans for continued production growth and cost reductions in 2015 from its Seabee Gold Operation in Saskatchewan. Key drivers included expanding production from the higher grade Santoy Gap zone and ongoing exploration success extending mineralization. The presentation concluded by emphasizing Claude's track record of delivering profitable gold production and focus on sustaining strong operating margins.


