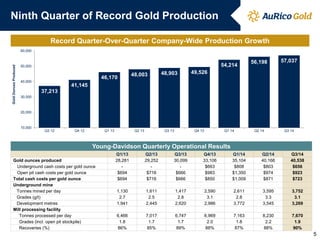
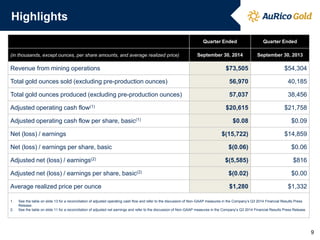
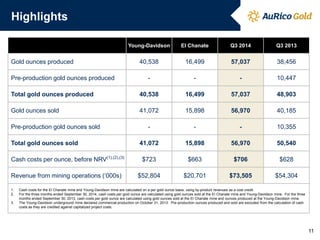
- Aurico Gold reported financial results for Q3 2014 with revenue of $73.5 million, a 36% increase from Q3 2013, due to higher gold production and sales.
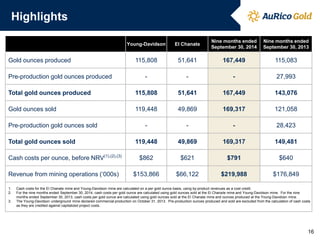
- Gold production was 57,037 ounces, a 48% increase from the prior year, driven by the ramp up of operations at the Young-Davidson mine.
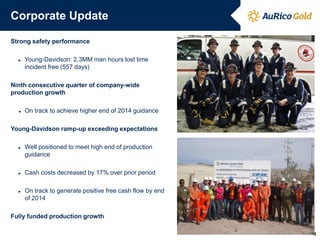
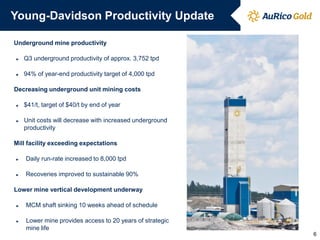
- Cash costs per ounce decreased 17% at Young-Davidson from the previous quarter and the mine is expected to generate positive cash flow by the end of 2014.