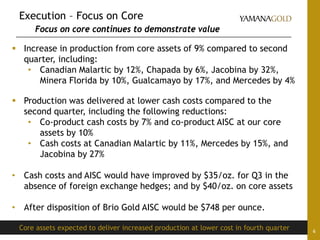
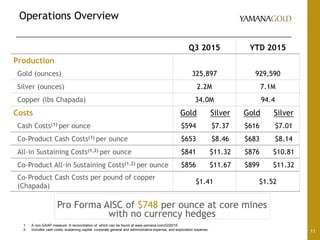
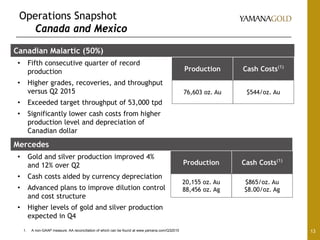
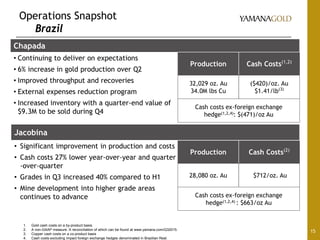
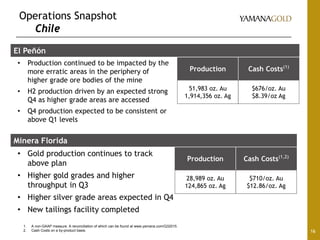
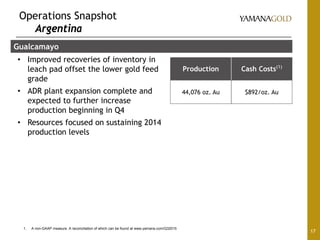
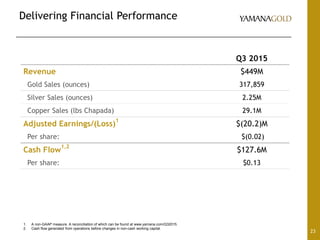
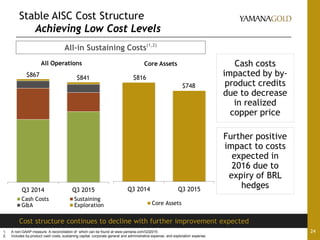
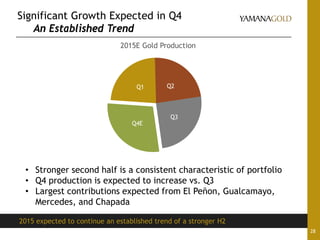
- Yamana Gold reported its third quarter 2015 results with increased production from its core assets, including a 9% rise compared to the previous quarter. Cash costs also decreased across several core mines.
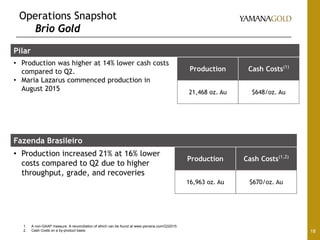
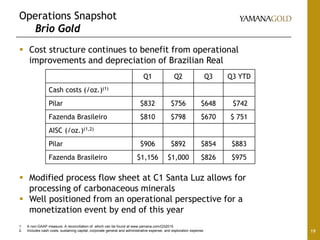
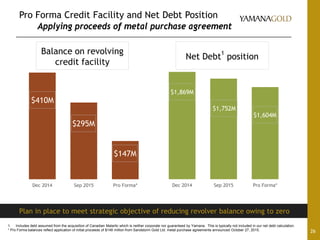
- The company is advancing the monetization of its non-core Brio Gold assets to strengthen its balance sheet. It has also entered metal purchase agreements that provided $150 million in cash.
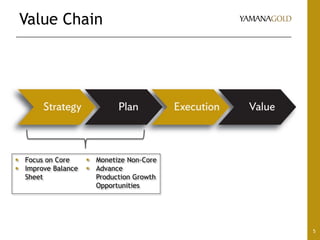
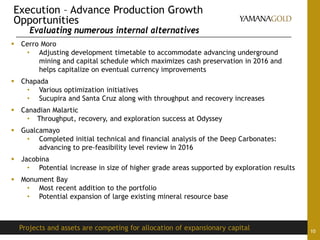
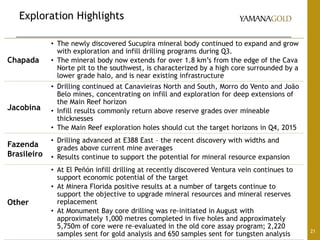
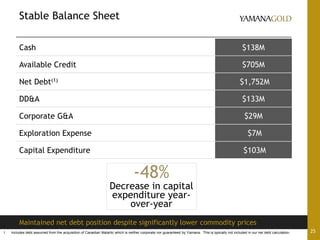
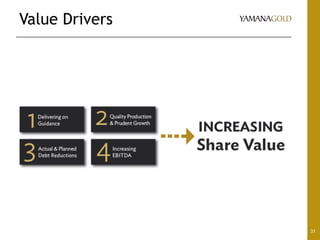
- Yamana aims to reduce debt by monetizing assets and is evaluating growth opportunities across its portfolio to maximize production and cash flow over the long run.