Download to read offline

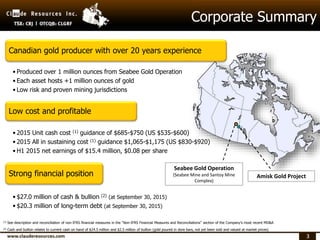
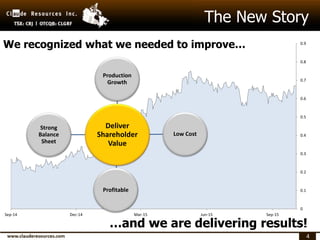
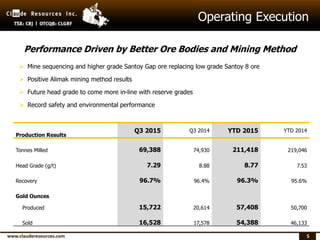
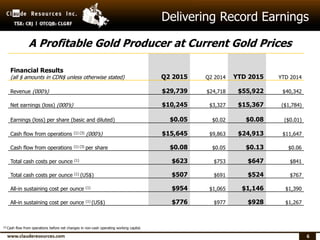
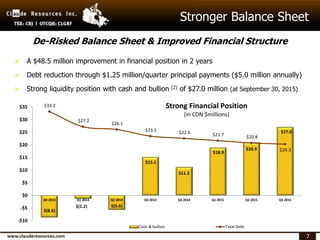
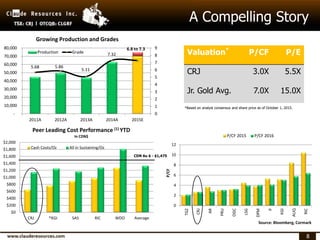

- The document discusses Claude Resources' corporate presentation from October 2015. - It highlights the company's focus on delivering shareholder value through production growth, being a low-cost and profitable producer, and maintaining a strong balance sheet. - Key drivers of future performance mentioned include higher-grade ore from the Santoy Gap zone and improved efficiency from the Alimak mining method at Seabee.


