Download to read offline

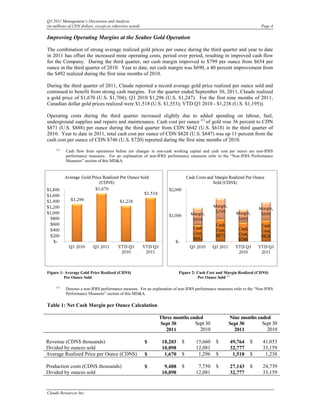
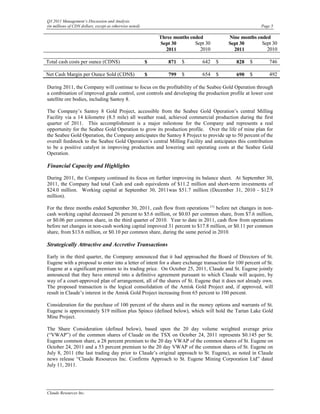
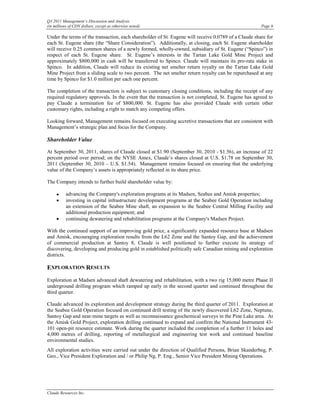
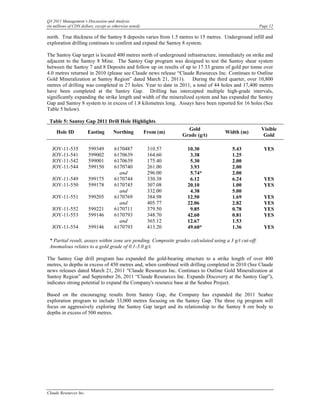
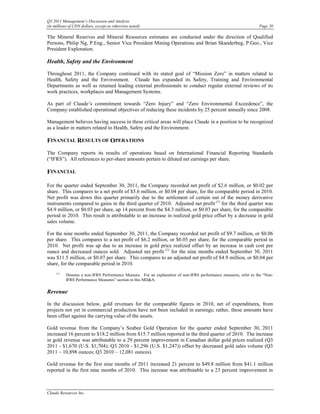
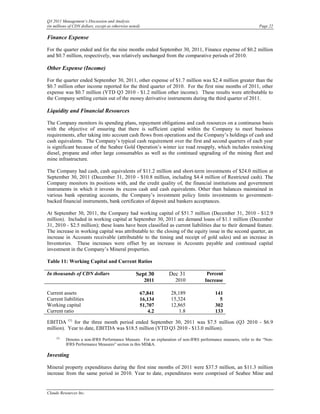
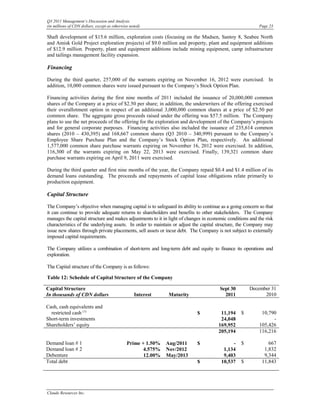
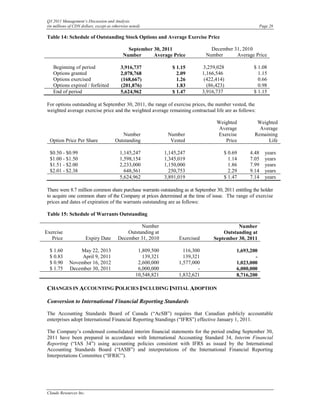
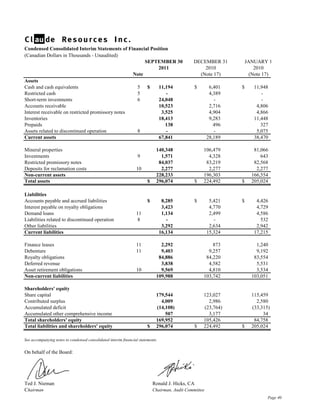
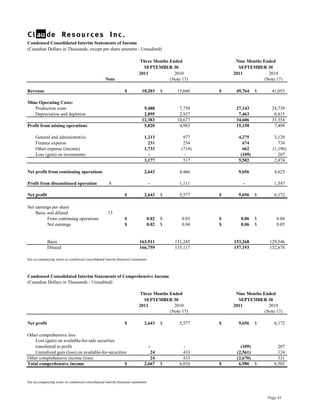
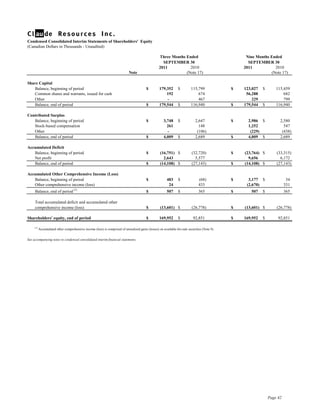
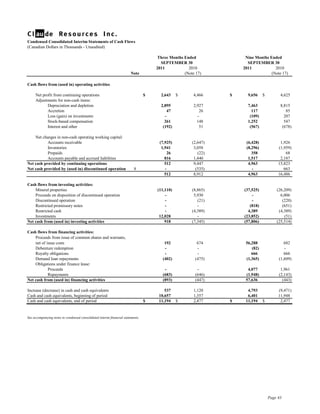
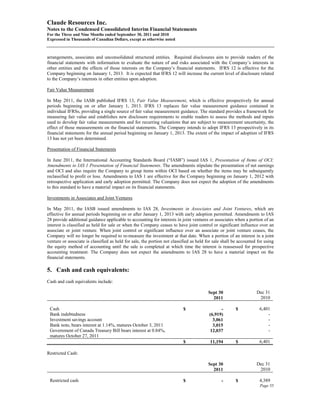

This document provides an overview and financial highlights of Claude Resources Inc. for the third quarter of 2011. Key points include: - Net profit of $2.6 million for Q3 2011 and $9.7 million for the first nine months of 2011. Adjusted net profit was up 14% for Q3 compared to the previous year. - Gold sales of 10,898 ounces in Q3 2011 and 32,777 ounces for the first nine months of 2011. - $35.2 million in cash and cash equivalents with working capital of $51.7 million as of September 30, 2011. - Drilling programs expanded at the Seabee Gold Operation and positive results from drilling


