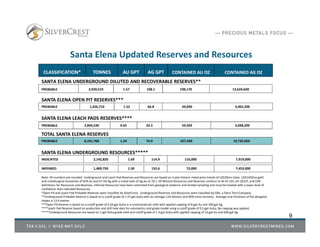
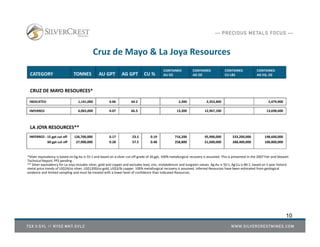
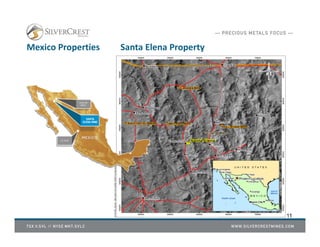
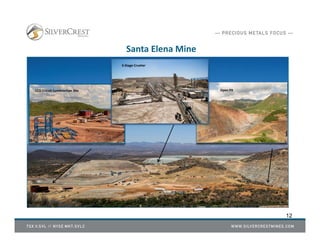
SilverCrest Mines Inc. (TSX‐V: SVL; NYSE MKT: SVLC) is a Canadian precious metals producer headquartered in Vancouver, BC. SilverCrest’s flagship property is the 100%‐owned Santa Elena Mine, located 150 km northeast of Hermosillo, near Banamichi in the State of Sonora, México. The mine is a high‐grade, epithermal gold and silver producer, with an estimated life of mine cash cost of US$8 per ounce of silver equivalent (55:1 Ag: Au). SilverCrest anticipates that the 2,500 tonnes per day open pit heap leach facility at the Santa Elena mine should recover approximately 625,000 ounces of silver and 33,000 ounces of gold in 2013. An expansion plan is well underway to nearly double the annual metals production in 2014 at the Santa Elena Mine (open pit and underground). Exploration programs have rapidly advanced the definition of a large polymetallic deposit at the La Joya property in Durango State with stated resources nearing 200 million ounces of Ag equivalent.
2. Disclaimer
The information provided in this presentation is not intended to be a comprehensive review of all matters and developments concerning the Company. It should be read in
conjunction with all other disclosure documents of the Company. The information contained herein is not a substitute for detailed investigation or analysis. No securities commission
or regulatory authority has reviewed the accuracy or adequacy of the information presented.
FORWARD-LOOKING STATEMENTS
This presentation contains “forward‐looking statements” within the meaning of Canadian securities legislation and the United States Securities Litigation Reform Act of 1995. Such
forward‐looking statements concern the Company’s anticipated results and developments in the Company’s operations in future periods, planned exploration and development of
its properties, plans related to its business and other matters that may occur in the future. These statements relate to analyses and other information that are based on expectations
of future performance, including silver and gold production and planned work programs. Statements concerning reserves and mineral resource estimates may also constitute
forward‐looking statements to the extent that they involve estimates of the mineralization that will be encountered if the property is developed and, in the case of mineral reserves,
such statements reflect the conclusion based on certain assumptions that the mineral deposit can be economically exploited.
Forward‐looking statements are subject to a variety of known and unknown risks, uncertainties and other factors which could cause actual events or results to differ from those
expressed or implied by the forward‐looking statements, including, without limitation: risks related to precious and base metal price fluctuations; risks related to fluctuations in the
currency markets (particularly the Mexican peso, Canadian dollar and United States dollar); risks related to the inherently dangerous activity of mining, including conditions or events
beyond our control, and operating or technical difficulties in mineral exploration, development and mining activities; uncertainty in the Company’s ability to raise financing and fund
the exploration and development of its mineral properties; uncertainty as to actual capital costs, operating costs, production and economic returns, and uncertainty that
development activities will result in profitable mining operations; risks related to reserves and mineral resource figures being estimates based on interpretations and assumptions
which may result in less mineral production under actual conditions than is currently estimated and to diminishing quantities or grades of mineral reserves as properties are mined;
risks related to governmental regulations and obtaining necessary licenses and permits; risks related to the business being subject to environmental laws and regulations which may
increase costs of doing business and restrict our operations; risks related to mineral properties being subject to prior unregistered agreements, transfers, or claims and other defects
in title; risks relating to inadequate insurance or inability to obtain insurance; risks related to potential litigation; risks related to the global economy; risks related to the Company’s
status as a foreign private issuer in the United States; risks related to all of the Company’s properties being located in Mexico and El Salvador, including political, economic, social and
regulatory instability; and risks related to officers and directors becoming associated with other natural resource companies which may give rise to conflicts of interests.
Should one or more of these risks and uncertainties materialize, or should underlying assumptions prove incorrect, actual results may vary materially from those describedi n the
forward‐looking statements. The Company’s forward‐looking statements are based on beliefs, expectations and opinions of management on the date the statements are made. For
the reasons set forth above, investors should not place undue reliance on forward‐looking statements. he information contained herein is nota a substitute for detailed investigation
or analysis. No securities commission or regulatory authority has reviewed the accuracy or adequacy of the information presented.
All monetary figures are expressed in United States dollars unless otherwise specified.
Qualified Person
Under National Instrument (NI 43-101) Standards of Disclosure for Mineral Projects, the Qualified Person for this presentation is N. Eric Fier, CPG, P.Eng. and Chief Operating Officer
for SilverCrest Mines Inc., who has reviewed and approved its contents. 2
3. Experienced & Successful Management Team
J. Scott Drever, BSc., Chairman & CEO (45 years experience)
Strategic Planning, Mergers & Acquisitions. Management and operational experience with several production companies, including
Placer Dome and Blackdome Mining.
Barney Magnusson, CA, CFO (35 years experience)
Served as an Officer and Director of 6 mining (Dayton Mines, High River Gold Mines) companies that developed, constructed or
operated 8 precious metals mines in North and South America.
N. Eric Fier, CPG, P.Eng., President & COO (25 years experience)
Operations, Project Evaluation & Management. Previously with Newmont Mining, Eldorado Gold, Pegasus Gold Corp. Involvement
in construction and operations of 4 successful mines, including Santa Elena. Several major international discoveries.
Brent McFarlane, BSc., VP Operations (25 years experience)
Managed all phases of open pit and underground mining projects and instrumental in leading Mexican and Int’l projects through
feasibility, construction, and production while working for Minefinders, Kappes Cassiday, TVI Pacific, Marston, and Pegasus Gold.
Marcio Fonseca, P.Geo., VP Corporate Development (20 years experience)
Served as Division Director at Macquarie Metals & Energy Capital with focus on equity and debt financing for the mining sector
over the last 9 years. Prior to that, he held corporate positions in business development, project development, operations and
exploration with Vale and Phelps Dodge in Latin America.
Graham C. Thody, CA, Director (30 years experience)
Corp. finance and public company management. Director and President of UEX Corp., Chairman of the Board of Geologix.
George W. Sanders, Director (30 years experience)
Experience in mining and exploration finance. Previously with Canaccord Capital Corp., Richmont Mines Inc., Consolidated Cinola
Mines Ltd., and Shore Gold Inc.
Ross Glanville, P.Eng., CGA, Director (40 years experience)
Experience in mining, exploration finance, valuations and fairness opinions. Director of Archon Minerals Limited, Clifton Star
Resources Inc. and Starfield Resources Inc. 3
FOUNDERS
4. 4
Overview of SilverCrest
BUILDING THE NEXT MID-TIER SILVER-GOLD PRODUCER
•1,222,351 million Ag Eq oz
•347.5K oz Ag | 14.7K oz Au
H1 2013
Production
•$ 7.74 per Ag Eq oz ($425 Au Eq)
•$14.56 per Ag Eq oz (ALL IN)
H1 2013
Cash Cost
•$ 8.9 million
•31%
H1 2013
Earnings & Margin
•19.7 million Ag oz
•327,430 Au oz
Reserves
Santa Elena
(April 30,2013)
•Santa Elena (Underground):
•Indicated: 7.9 mill Ag oz, 116,000 Au oz
•La Joya:
•Inferred: 198.6 million Ag Eq oz
Resources*
(April 30, 2013)
•1 Operating (Santa Elena)
•1 Development – PEA (La Joya)
Asset Stages
•2013: 2.49 million Ag Eq oz
•2014: 3.5 – 4 million Ag Eq oz
Estimated
Production
•Mexico: Sonora & DurangoGeographic
Location
*Additional details on Resources on slide 10 & 11NOTE: Ag Eq based on 55:1 ratio
5. Capital Structure & Trading History
SVL SHARE STRUCTURE
Issued & Outstanding: 108,843,205
Options: 6,325,000
Fully Diluted Shares: 115,168,205
Average Option Price: CAD $1.41
MANAGEMENT & KEY SHAREHOLDERS
Fully Diluted (as of September 6, 2013)
J. Scott Drever, President: 2,391,226
Barney Magnusson, CFO: 2,570,727
N. Eric Fier, COO: 2,157,027
Sprott Asset Management: 7.1%
Wellington Management: 6.7%
Libra Advisors: 5.7%
AGF Investments: 3.7%
J.P. Morgan Chase & Co: 1.4%
Independent Directors: 1,720,300
TRADING SUMMARY TSX.V NYSE MKT
90 ‐ Day Avg. Daily Volume: 362,807 257,561
52 Week High / Low: $2.96 / $1.19 $3.05/$1.13
Share Price (Sept. 6, 2013): CAD $2.22
Market Cap: CAD $242 M
Working Capital (June 30, 2013): $41.6 M
Line of Credit $40 M
5
6. 6
Strong Financial Performance
Revenue & Cash Flow Growth
Strong Working Capital of $41.6 M at
June 30, 2013 & Line of Credit of $40 M
¹ Higher grade areas were mined in this quarter.
¹ Higher working capital due to bought deal financing and cash flow from operations.
‐
5.00
10.00
15.00
20.00
25.00
USD($millions)
Revenue
Cash flow
0
10
20
30
40
50
60
USD($millions)
Working Capital
Working Capital
8. 8
Cash Operating Cost & ALL IN Cash Operating Cost
2013 EST Budget 2012
Cash operating cost ¹ $ 19,822,454 18,307,681
General and Admin expenses $ 7,273,798 5,568,582
Santa Elena Reserve & Resource definition drilling $ 4,705,000 5,644,469
Santa Elena Sustaining capital $ 901,540 1,703,919
Total 2013 est. expense $ 32,702,792 31,224,651
Ag equiv. ounces sold 2,432,136 2,477,623
Cash Cost per Ag equiv. ounce sold $ 8.15 7.39
ALL IN cash cost per Ag equiv. ounce sold ² $ 13.45 12.60
¹ 2013 EST does not reflect inventory adjustments
² ALL IN” includes total direct costs + sustaining capital + corporate G&A expense + exploration expense.
9. CLASSIFICATION* TONNES AU GPT AG GPT CONTAINED AU OZ CONTAINED AG OZ
PROBABLE 3,920,510 1.57 108.1 198,170 13,624,640
PROBABLE 1,426,710 1.52 66.8 69,830 3,062,200
PROBABLE 2,844,530 0.65 33.3 59,420 3,048,200
SANTA ELENA UNDERGROUND DILUTED AND RECOVERABLE RESERVES**
SANTA ELENA OPEN PIT RESERVES***
INDICATED 2,142,820 1.69 114.9 116,000 7,919,000
INFERRED 1,489,750 1.50 155.6 72,000 7,453,000
Santa Elena Updated Reserves and Resources
9
SANTA ELENA LEACH PADS RESERVES****
SANTA ELENA UNDERGROUND RESOURCES*****
PROBABLE 8,191,760 1.24 74.9 327,430 19,735,050
TOTAL SANTA ELENA RESERVES
Note: All numbers are rounded. Underground and Leach Pad Reserves and Resources are based on 3 year historic metal price trends of US$28/oz silver, US$1450/oz gold
and metallurgical recoveries of 92% Au and 67.5% Ag with a metal ratio of Ag:Au at 70:1. All Mineral Resources and Reserves conform to NI 43‐101, 43‐101CP, and CIM
definitions for Resources and Reserves. Inferred Resources have been estimated from geological evidence and limited sampling and must be treated with a lower level of
confidence than Indicated Resources.
*Open Pit and Leach Pad Probable Reserves were classified by SilverCrest. Underground Reserves and Resources were classified by EBA, a Tetra Tech Company.
**Underground Probable Reserve is based on a cutoff grade of 1.47 gpt AuEq with an average 11% dilution and 90% mine recovery. Average true thickness of the designed
stopes is 13.4 metres.
***Open Pit Reserve is based on a cutoff grade of 0.20 gpt AuEq in a constrained pit shell with applied capping of 8 gpt Au and 300 gpt Ag.
****Leach Pad Reserve based on production and drill hole data for volumetrics and grade model using a cutoff grade of 0.5 gpt AuEq. No capping was applied.
*****Underground Resources are based on 1 gpt AuEq grade shell and cutoff grade of 1.4 gpt AuEq with applied capping of 12 gpt Au and 600 gpt Ag.
10. CATEGORY TONNES AU GPT AG GPT CU %
CONTAINED
AU OZ
CONTAINED
AG OZ
CONTAINED
CU LBS
CONTAINED
AG EQ. OZ
INDICATED 1,141,000 0.06 64.2 2,300 2,353,400 2,479,900
CRUZ DE MAYO RESOURCES*
INFERRED 6,065,000 0.07 66.5 13,300 12,967,100 13,698,600
LA JOYA RESOURCES**
INFERRED : 15 gpt cut off
60 gpt cut off
126,700,000
27,900,000
0.17
0.28
23.5
57.5
0.19
0.48
716,200
258,800
95,900,000
51,600,000
533,200,000
288,400,000
198,600,000
100,800,000
Cruz de Mayo & La Joya Resources
*Silver equivalency is based on Ag:Au is 55:1 and based on a silver cut‐off grade of 30 gpt, 100% metallurgical recovery is assumed. This is presented in the 2007 Fier and Stewart
Technical Report; PFS pending .
** Silver equivalency for La Joya includes silver, gold and copper and excludes lead, zinc, molybdenum and tungsten values. Ag:Au is 50:1, Ag:Cu is 86:1, based on 5 year historic
metal price trends of US$24/oz silver, US$1200/oz gold, US$3/lb copper. 100% metallurgical recovery is assumed. Inferred Resources have been estimated from geological
evidence and limited sampling and must be treated with a lower level of confidence than indicated Resources.
10
12. Santa Elena Mine
1. SANTA ELENA HIGH GRADE OPEN PIT
12
CCD Circuit Construction Site Open Pit
3-Stage Crusher
13. Santa Elena Production Data
(1) Silver equivalence is based on market spot prices per ounce of silver and gold at the quarter end dates. All numbers are rounded.
Santa Elena Mine Operating Highlights Q2 2013 Q1 2013 Q2 2012
Silver ounces produced 194,022 153,481 139,850
Gold ounces produced 7,463 7,225 8,584
Silver equivalent ounces produced ⁽¹⁾ 665,684 556,667 646,553
Silver ounces sold 181,398 157,088 124,739
Gold ounces sold 7,375 7,370 8,679
Silver equivalent ounces sold 647,504 568,380 637,050
Tonnes ore mined 339,256 257,726 269,802
Tonnes waste mined 856,144 1,100,362 1,283,493
Waste / ore ratio 2.52 4.27 4.76
Ore tonnes crushed 307,091 259,597 317,958
Average ore tonnes crushed per day 3,375 2,884 3,494
Average silver ore grade (gpt) loaded on pad 65.99 62.38 39.45
Average gold ore grade (gpt) loaded on pad 1.48 1.55 1.35
Silver ounces delivered to pad 651,572 520,614 403,264
Gold ounces delivered to pad 14,612 12,938 13,764
Ag: Au Ratio (1) 63.2:1 55.8:1 59.0:1
13
14. 14
Santa Elena Mine Expansion Plan Capex Schedule
($ Millions) TOTAL 2013
(Revised EST)
2012 2011
Mill Complex 58.7 53.2 5.5 ‐
Underground Development 12.6 8.1 3.5 1.0
Drilling & Pre‐Feasibility 10.7 4.7 5.0 1.0
(*) Excludes $5 M contingency included in PFS
82.0 ⁽*⁾ 66.0 14.0 2.0
Pre Feasibility released in July 2013
Decline ramp, UG development and drilling in process
Construct, 3,000 tonnes per day conventional mill by Q1 2014
Mill feed from Open Pit and Underground in 2014
15. Santa Elena Mine Expansion – Construction August 2013
1. SANTA ELENA HIGH GRADE OPEN PIT
15
16. Santa Elena Mine Expansion – Pre-Feasibility Study, April 2013
1. SANTA ELENA HIGH GRADE OPEN PIT
16
Item Base Case Spot Price
Gold Price (US$/oz.) $ 1,450 $ 1,250
Silver price (US$/oz.) $ 28 $ 19.5
IRR (%) 88% 49%
DCF NPV @ 5% in millions $223.7 $108.7
Payback (production years) 1.1 1.7
Base Case Economic Analysis Results ¹
Production
Gold Ounces Sold ‐ post refiner 262,739
Silver Ounces Sold ‐ post refiner 12,118,926
Revenue US$(000)
Gross Sales $684,931
Operating Expenses
Total Operating Costs ² $282,223
Freight & Refining $5,579
Capital Expenses
Total Capital Costs ³ $87,813
Pre-Tax Cash Flow
Total Cash Flow ⁴ $302,481
1 The economic analysis considers SilverCrest delivering a remaining 31,000 ounces of gold at a price of US$350/oz. under the Sandstorm Agreement. It does not include the effect of the
option held by Sandstorm to participate in the future underground mine production.
2 Operating cost per AgEQ oz. sold varies between $9.6 and $12.6 over the life of mine
3 Excludes sunk costs, up to April 30, 2013, closure costs and working capital, including contingency
4 Includes deductions of $5 million for closure costs and $1.8 million for working capital
17. Santa Elena Expansion Operating Cost Estimates
1. SANTA ELENA HIGH GRADE OPEN PIT
17
Mining Method Open Pit Open Pit Underground Leach Pad
Process Method Heap Leach CCD Mill CCD Mill CCD Mill
Mining Cost/T ore $2.42 $2.50 $25 ¹ $0.25 to 0.75
Mining Cost/T waste $1.52 $2.00 NA NA
Processing Cost/T
2
$6.65 $20.50 $20.50 $18.50
General & Administration
3
$3.30 $3.00 $3.00 $3.00
Overall Metal Recoveries:
Gold 63% 92% 92% 92%
Silver 40% 67.5% 67.5% 67.5%
1 Underground mining costs, dilution and mine recovery are based on stope type, either long hole (69% of design stopes) or cut and fill (31% of designed
stopes) mining method.
2 Processing includes crushing, milling, site refining and dry stack tailings disposal.
3 Estimated based on current operations and may vary on an annual basis.
18. Santa Elena 3D View of Stope Layout – Looking Northwest
1. SANTA ELENA HIGH GRADE OPEN PIT
18
$17/t $17/t $38/t
Open Pit
1 km
400 mtr
19. Santa Elena Expansion Production Profile (3000 tpd Mill)
Long Hole Stoping Upfront
Long
1. SANTA ELENA HIGH GRADE OPEN PIT
19
0
1,000,000
2,000,000
3,000,000
4,000,000
5,000,000
6,000,000
7,000,000
2013 2014 2015 2016 2017 2018 2019 2020 2021
Ounces
Au : Ag - 55:1Ag Eq Oz's of Au Produced Ag Oz's Produced
NOTE : Production Profile based on “Expansion PFS April 2013” results.
An estimated 750,000 tonnes of open pit ore will be placed on the pad in 2013 and accounted for in early 2014 as additional ore for reprocessing during the
mine life.
Currently-OpenPit
POTENTIAL FOR EXTENDING OR INCREASING IN PRODUCTION:
A) Additional Santa Elena Resources
B) La Joya Coming On Stream
20. 20
Potential Mill Feed Schedule 2013 - 2024
Source 2013 2014 2015 2016 2017 2018 2019 2020 2021 2022 2023 2024
Open Pit (until August 2014)
Underground (to commence Q3|2014)
Heap Leach Reprocessing (to commence Q3|2014)
Cruz de Mayo
(1)
(2)
Note (1): Resources (hatched)
Note (2): Open pit ore still to be put on pad in 2013 (hatched) as leach pad material
Reserves by January 2014
21. Santa Elena Expansion - Mill Plan (Ultimate Foot Print)
Open Pit
Leach Pad
Phase 1
Leach Pad
Phase 2
Merrill Crowe Plant
Future Crushing
Circuit
Waste Dump
Future CCD
Circuit , 3000 tpd
Underground Decline Portal
21
Production Well
A
A'
22. *Looking North – Ultimate pit and U/G development: Est. Reserves in pink and Est. Resources in grey.
Drill holes: red dots 2005-2011, blue 2012-13, green stars Newly Reported
Santa Elena Mine Expansion – MMZ Long Section A-A’ *
OPEN
OPEN
OPEN
Current Ramp
Original Surface
Location
El Cholugo & El Cholugo Dos
Tortuga
Ongoing U/G drilling
(1st Production Stopes)
148
152
166
160
181144
175
183
182142 179
180155
171
158
176
145 168
173
161
151
165
OPEN
200m
Ultimate Pit
22
23. Tortuga
El Cholugo
MMZ
Open Pit
Santa Elena Mine – El Cholugo and Tortuga Discoveries
A
A’
B
B’
Underground
Ramp
Tortuga
In Pit Wall
El Cholugo
In Pit Wall
100m
N
23
24. Santa Elena Mine – Tortuga Long Section B-B’
*
100m
Ultimate
Pit
*Looking Northeast – Ultimate pit, Ag Eq ratio is 55:1 Ag:Au
Drill holes: Red dots 2005-2011, Green stars Newly Reported
99 (projected)
52
98
97
19
169
143
150
167
149
146
157
177
178
164
170
163
162
174
154
156
172
147
153
159
Greater than 150 gpt Ag Eq*,
ave. 3 m width
OPEN
OPEN
OPEN
24
25. La Joya Project: Geological Model - Phase I & II Drill Program (completed)
25
Conceptual Starter Pit
26. La Joya Resource Sections A-A’ (Looking NE)
26
“Potential Starter Pit Parameters”:
8-10 year mine life
Low strip ratio
5,000 – 7,000 tpd throughput
Est. 4 to 5 million Ag Eq oz/year
28. La Joya Resource Estimate & Preliminary Metallurgy
28
ZONE
Ag Eq* Cut-off
gpt
Tonnage
(000) Ag gpt Au gpt Cu % Ag Eq gpt
Ag Oz
(000)
Au oz
(000) Cu lbs (000)
Ag Eq* Oz
(000)
Total 15 126,700 23.5 0.17 0.19 48.7 95,900 716.2 533,200 198,600
30 71,200 34.4 0.22 0.28 69.8 78,700 524.8 436,800 159,800
60 27,900 57.5 0.28 0.48 112.2 51,600 258.8 288,400 100,800
**Classified by EBA, A Tetra Tech Company and conforms to NI 43‐101, 43‐101CP, and CIM definitions for resources. All numbers are rounded. Inferred Resources have been
estimated from geological evidence and limited sampling and must be treated with a lower level of confidence than Measured and Indicated Resources. Mineralization boundaries
used in the interpretation of the geological model and resource estimate are based on a cutoff grade of 15 gpt Ag Eq using the metal price ratios described below.
Note: all the metal grades are based on weighted average values.
* Silver equivalency (Ag Eq) includes silver, gold and copper and excludes lead, zinc, molybdenum and tungsten values. Ag:Au is 50:1, Ag:Cu is 86:1, based on 5 year historic
metal price trends of US$24/oz silver, US$1200/oz gold, US$3/lb copper.
** Contact composite was collected and analyzed to target tungsten and molybdenum recoveries.
Batch Cleaner Flotation Test Results – Baseline
Current Resource Estimate (PEA focus on 60 gpt cut-off)
Composite
Head Assay
3rd Cleaner Concentrate
Assay Recovery (%)
Cu % Ag gpt Au gpt Ag Eq* gpt Mo % Cu % Ag gpt Au gpt Ag Eq* gpt Mo % Cu Ag Au Mo
Manto 0.34 45.0 0.15 81.7 0.004 36.3 4,700 3.40 7,991 0.27 86.7 84.3 18.2 59.6
Structure 0.46 58.0 0.25 110.0 0.003 34.3 3,980 9.45 7,402 0.17 82.7 76.7 42.4 59.7
Contact** 0.07 4.0 0.10 15.0 0.011 16.7 670 17.40 2,976 2.02 83.6 63.7 66.4 65.4
29. Investment Highlights
Unhedged High Grade, Low Cost Producer
Excellent Profit Margins, Strong Balance Sheet
Strong Earnings And Cash Flow
Significant Increase In Production by 2014
Good Organic Growth Opportunities
Expanding Resources & Reserves
Building The Next Mid‐Tier Silver‐Gold Producer
Personnel In Place For Future Growth
Upcoming Catalysts 2013
Quarterly Production Data & Financial Statements
Santa Elena Expansion Updates
Santa Elena Exploration Results
La Joya Preliminary Economic Assessment
29Santa Elena CCD Tank Construction
30. 30
Institutional Holdings Analyst Coverage
Institutional Investors
Sprott Inc
Wellington Management
Libra Advisors
AGF Investments
JP Morgan Chase
I.G. Investment Management
Tocqueville Asset Management
Great West Life
US Global Investors
Firm Analyst
Canaccord Genuity Nicholas Campbell
Cormark Securities Graeme Jennings
Dundee Capital Chris Lichtenheldt
Euro Pacific Capital Inc. Heiko Ihle
Haywood Securities Benjamin Asuncion
Jennings Capital Kwong-Mun Achong Low
PI Financial Corp Philip Ker
Raymond James Chris Thompson
Stonecap Securities Christos Doulis
32. Contact Us
Tel: (604) 694‐1730
Toll Free: 1‐866‐691‐1730
Fax: (604) 694‐1761
info@silvercrestmines.com
www.silvercrestmines.com
Suite 501 ‐ 570 Granville Street
Vancouver, BC V6C 3P1
SILVERCRESTMINES.COM MEDIA PRESENTATIONS
Scan the QR codes above for more info.
Get the FREE mobile app: http://gettag.mobi
32