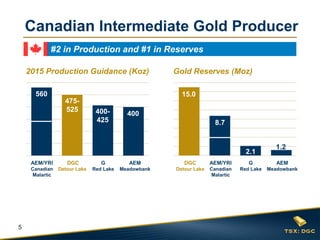
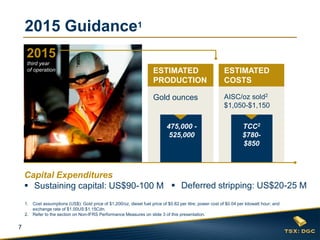
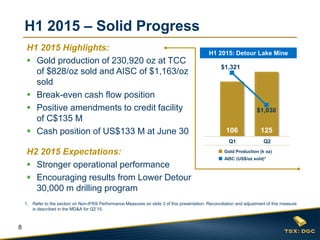
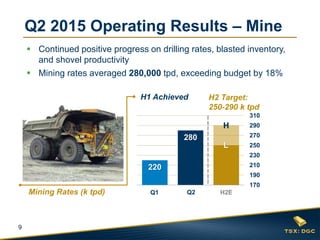
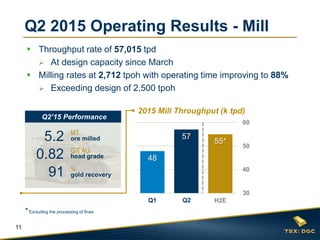
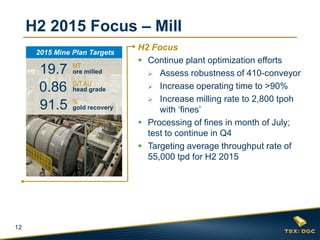
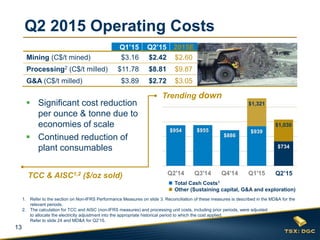
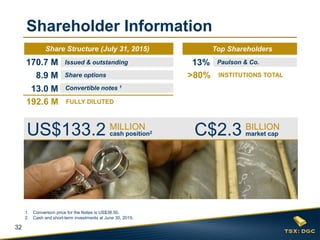
1
CANADA’S INTERMEDIATE
GOLD PRODUCER
Cormark’s One on One Gold Marketing
Toronto – September 3, 2015
2
Forward Looking Information
This presentation contains certain forward-looking information and statements as defined in applicable securities law (referred to herein as
“forward-looking statements”). Forward-looking statements include, but are not limited to, statements with respect to 2015 guidance for
production, total cash costs, all-in sustaining costs, capital costs, deferred stripping costs, and exploration costs; expected throughput,
mining and recovery rates; expected future production and mining activities; opportunities to optimize the mine operation; timeline for the
life of mine plan update, and exploration program; and opportunities to optimize the mine operation.
Forward-looking statements involve known and unknown risks, uncertainties and other factors which may cause actual results, performance
or achievements to be materially different from any of its future results, performance or achievements expressed or implied by forward-
looking statements. These risks, uncertainties and other factors include, but are not limited to, assumptions and parameters underlying the
life of mine update not being realized, a decrease in the future gold price, discrepancies between actual and estimated production, changes
in costs (including labour, supplies, fuel and equipment), changes to tax rates; environmental compliance and changes in environmental
legislation and regulation, exchange rate fluctuations, general economic conditions and other risks involved in the gold exploration and
development industry, as well as those risk factors discussed in the section entitled “Description of Business - Risk Factors” in Detour
Gold’s 2014 AIF and in the continuous disclosure documents filed by Detour Gold on and available on SEDAR at www.sedar.com.
Such forward-looking statements are also based on a number of assumptions which may prove to be incorrect, including, but not limited to,
assumptions about the following: the availability of financing for exploration and development activities; operating and sustaining capital
costs; the Company’s ability to attract and retain skilled staff; sensitivity to metal prices and other sensitivities; the supply and demand for,
and the level and volatility of the price of, gold; the supply and availability of consumables and services; the exchange rates of the Canadian
dollar to the U.S. dollar; energy and fuel costs; the accuracy of reserve and resource estimates and the assumptions on which the reserve
and resource estimates are based; market competition; ongoing relations with employees and impacted communities and general business
and economic conditions. Accordingly, readers should not place undue reliance on forward-looking statements. The forward-looking
statements contained herein are made as of the date hereof, or such other date or dates specified in such statements.
All forward-looking statements in this presentation are necessarily based on opinions and estimates made as of the date such statements
are made and are subject to important risk factors and uncertainties, many of which cannot be controlled or predicted. Detour Gold and the
Qualified Persons who authored the associated Technical Report undertake no obligation to update publicly or otherwise revise any
forward-looking statements contained herein whether as a result of new information or future events or otherwise, except as may be
required by law.
3
Notes to Investors
The scientific and technical content of this presentation was reviewed, verified and approved by Drew Anwyll, P.Eng., Senior Vice President Technical
Services, and exploration results was reviewed, verified and approved by Guy MacGillivray, P.Geo., Exploration Manager , both Qualified Person as
defined by Canadian Securities Administrators National Instrument 43-101 “Standards of Disclosure for Mineral Projects”.
Qualified Persons
Non-IFRS Financial Performance Measures
The Company has included non-IFRS measures in this presentation: total cash costs, all-in sustaining costs, adjusted net loss and adjusted net loss per
share. The Company believes that these measures, in addition to conventional measures prepared in accordance with IFRS, provide investors an improved
ability to evaluate the underlying performance of the Company. The non-IFRS measures are intended to provide additional information and should not be
considered in isolation or as a substitute for measures of performance prepared in accordance with IFRS. These measures do not have any standardized
meaning prescribed under IFRS, and therefore may not be comparable to other issuers. Other companies may calculate these measure differently.
Detour Gold reports total cash costs on a sales basis. Total cash costs include production costs such as mining, processing, refining and site
administration, less non-cash share-based compensation and net of silver sales divided by gold ounces sold to arrive at total cash costs per gold ounce
sold. The measure also includes other mine related costs incurred such as mine standby costs and current inventory write downs. Production costs are
exclusive of depreciation and depletion. Production costs include the costs associated with providing the royalty in kind ounces.
Commencing in 2015, the Company adopted all-in sustaining costs on a prospective basis. The Company believes this measure more fully defines the total
costs associated with producing gold. The Company calculates all-in sustaining costs as the sum of total cash costs (as described above), share-based
compensation, corporate general and administrative expense, exploration and evaluation expenses that are sustaining in nature, reclamation cost
accretion, sustaining capital including deferred stripping, and realized gains and losses on hedges due to operating and capital costs, all divided by the gold
ounces sold to arrive at a per ounce figure.
Costs excluded from all-in sustaining costs are non-sustaining capital expenditures and exploration costs that are expected to materially increase
production, financing costs and tax expense. Consequently, this measure is not representative of all of the Company’s cash expenditures. In addition, the
calculation of all-in sustaining costs does not include depreciation and depletion expense as it does not reflect the impact of expenditures incurred in prior
periods.
Adjusted net earnings (loss) and adjusted basic earnings (loss) per share are used by management and investors to measure the underlying operating
performance of the Company. Presenting these measures from period to period helps management and investors evaluate earnings trends more readily in
comparison with results from prior periods. Adjusted net earnings (loss) is defined as net earnings (loss) adjusted to exclude specific items that are
significant, but not reflective of the underlying operations of the Company, including: fair value change of the convertible notes, the impact of foreign
exchange gains and losses, including the foreign exchange on deferred income and mining taxes, non-cash unrealized gains and losses on derivative
instruments, accretion on convertible notes, unwinding of discount on decommissioning and restoration provisions, impairment provisions and reversals
thereof, and other non-recurring items. Adjusted basic net earnings (loss) per share is calculated using the weighted average number of shares outstanding
under the basic method of loss per share as determined under IFRS.
4
Unique Investment Opportunity
Mining-friendly Jurisdiction
 Large-scale, long mine life
 Largest gold producing mine not
controlled by a senior producer
 Growing cash flow profile
 Production growth opportunities
 Favourable exposure to
Canadian Dollar
DOMINANT
GOLD PRODUCER
IN CANADA
5
2015 Production Guidance (Koz)
#2 in Production and #1 in Reserves
DGC
Detour Lake
AEM/YRI
Canadian
Malartic
AEM
Meadowbank
G
Red Lake
Canadian Intermediate Gold Producer
400-
425
560
475-
525
400
Gold Reserves (Moz)
DGC
Detour Lake
AEM/YRI
Canadian
Malartic
AEM
Meadowbank
G
Red Lake
2.1
15.0
8.7
1.2
6
2015 Drivers to Success
Execution of Plan
 Gold production increase with higher
mining and milling rates
 Strengthen balance sheet
Added Benefits
 Significant leverage to gold price and
Canadian dollar
 Low power and favourable diesel costs
Near to Long-Term Value Enhancements
 Plant optimization (with limited capital)
 Development of Block A
 Exploration potential
7
2015 Guidance1
TCC2
$780-
$850
AISC/oz sold2
$1,050-$1,150
Capital Expenditures
 Sustaining capital: US$90-100 M
475,000 -
525,000
Gold ounces
ESTIMATED
COSTS
ESTIMATED
PRODUCTION
 Deferred stripping: US$20-25 M
1. Cost assumptions (US$): Gold price of $1,200/oz, diesel fuel price of $0.82 per litre; power cost of $0.04 per kilowatt hour; and
exchange rate of $1.00US:$1.15Cdn.
2. Refer to the section on Non-IFRS Performance Measures on slide 3 of this presentation.
2015
third year
of operation
8
H1 2015 – Solid Progress
106 125
$1,321
$1,030
$750
$850
$950
$1,050
$1,150
$1,250
$1,350
0
20
40
60
80
100
120
140
H1 2015: Detour Lake Mine
■ AISC (US$/oz sold)1
■ Gold Production (k oz)
Q1 Q2
1. Refer to the section on Non-IFRS Performance Measures on slide 3 of this presentation. Reconciliation and adjustment of this measure
is described in the MD&A for Q2’15.
H1 2015 Highlights:
 Gold production of 230,920 oz at TCC
of $828/oz sold and AISC of $1,163/oz
sold
 Break-even cash flow position
 Positive amendments to credit facility
of C$135 M
 Cash position of US$133 M at June 30
H2 2015 Expectations:
 Stronger operational performance
 Encouraging results from Lower Detour
30,000 m drilling program
9
 Continued positive progress on drilling rates, blasted inventory,
and shovel productivity
 Mining rates averaged 280,000 tpd, exceeding budget by 18%
220
280
170
190
210
230
250
270
290
310
Q1A Q2A H2EQ1 Q2Mining Rates (k tpd)
Q2 2015 Operating Results – Mine
H1 Achieved H2 Target:
250-290 k tpd
H
L
10
Successful re-build of ROM stockpiles
at Q2 end (1.7 Mt @ 0.71 g/t) provides
operational flexibility for H2 2015:
 Focus on delivering higher grade to mill
 Accelerate Phase 2 pre-stripping
 On target for east end pit access to
higher grade (former Campbell pit area)
 Maximize TMA placement efficiency
(using CAT795 trucks)
H2 2015 Mine Plan Focus
Targeting 250,000
to 290,000 tpd for
remainder of 2015
11
 Throughput rate of 57,015 tpd
 At design capacity since March
 Milling rates at 2,712 tpoh with operating time improving to 88%
 Exceeding design of 2,500 tpoh
48
57
55*
30
40
50
60
Q1'15 Q2'15 H2E
Q2 2015 Operating Results - Mill
2015 Mill Throughput (k tpd)
MT
ore milled
0.82 G/T AU
head grade
%
gold recovery
5.2
91
Q2’15 Performance
Q1 Q2
*Excluding the processing of fines
12
H2 2015 Focus – Mill
H2 Focus
 Continue plant optimization efforts
 Assess robustness of 410-conveyor
 Increase operating time to >90%
 Increase milling rate to 2,800 tpoh
with ‘fines’
 Processing of fines in month of July;
test to continue in Q4
 Targeting average throughput rate of
55,000 tpd for H2 2015
MT
ore milled
0.86 G/T AU
head grade
%
gold recovery
19.7
91.5
2015 Mine Plan Targets
13
$954 $955
$886
$939
$734
Q2'14 Q3'14 Q4'14 Q1'15 Q2'15
Q2 2015 Operating Costs
 Significant cost reduction
per ounce & tonne due to
economies of scale
 Continued reduction of
plant consumables
TCC & AISC1,2 ($/oz sold)
Trending down
Q2’15
$1,321
$1,030
1. Refer to the section on Non-IFRS Performance Measures on slide 3. Reconciliation of these measures is described in the MD&A for the
relevant periods.
2. The calculation for TCC and AISC (non-IFRS measures) and processing unit costs, including prior periods, were adjusted
to allocate the electricity adjustment into the appropriate historical period to which the cost applied.
Refer to slide 24 and MD&A for Q2’15.
Q1’15 Q2’15 2015E
Mining (C$/t mined) $3.16 $2.42 $2.60
Processing2 (C$/t milled) $11.78 $8.81 $9.87
G&A (C$/t milled) $3.89 $2.72 $3.05
 Total Cash Costs1
 Other (Sustaining capital, G&A and exploration)
14
1. Includes US$2.0 M NAC settlement payment.
 Q2 Sustaining Capital
Mine
$30 M
TMA
$34 M
Other
$13 M
Mill
$9 M
Water Management
$10 M
14
Q2 2015 Capital Expenditures
Q1’15 Q2’15 2015E
Sustaining Capital $19.8 M $25.8 M $90-100 M
Capitalized Stripping $10.0 M - $20-25 M
Total (US$) $29.8 M $25.8 M $110-125 M
Breakdown of 2015 Sustaining
Capital (US$)
~90% of costs in Cdn$
Mine $7.5 M
Mill $5.2 M
TMA $6.5 M
Other $6.6 M1
15
Benefiting from a Weak Cdn $
$1,000
$1,100
$1,200
$1,300
$1,400
$1,500
Budget 2015 1-Jan-15 1-Sep-15
$Cdn $US
Gold Performance
YTD
$Cdn: +10%
$US: -3%
$/oz
FX rate 1.15 1.16 1.32
YTD 2015 Gold Price
in US Dollars vs Canadian Dollars
$1,380 $1,372
$1,505
$1,200
$1,182
$1,142
16
Prudent Financial Management
Hedge up to 50% of 2015 Gold Production
Forward sales on 35,000 oz @ US$1,276/oz
Currency Exchange Contracts
Zero-cost collars for US$40 M with a ceiling
of 1.21; Forward contracts for US$40 M at
average 1.26
Hedge ~50% of Next 3 Months’ Diesel Use
Purchasing diesel product (~6 M litres) at
effective hedge price of US$0.46/litre
As at June 30, 2015:
Mark-to-market value of US$3 M
No addition to
hedging programs in
Q2’15
17
 Optimize capital vs mine output (at gold price of US$1,200/oz
long-term)
 Evaluate production ranging from 110 to 140 Mt annually
(equivalent to mining rates of 300,000 to 385,000 tpd)
 Include Block A as a second feed source (at earliest 2018)
 Evaluate the use of Block A pit as waste rock dump and TMA cell
 Evaluate the inclusion of enriched low-grade stockpile (fines) in
mineral reserves (2nd test underway)
LOM Plan Update – EOY Target
Goal: Maximize Returns for Next 5-10 yrs and Optimize NAV
18
Processing of Fines
Segregation of fines:
 Gold concentrates in the finer
material
 Segregation of fines allows for:
›better grade
›faster processing rates
First Test in Fall 2014:
 Positive results from first
200,000 tonnes test
› grade of 0.62 g/t = 41%
higher than avg. grade of SP
› processed at 68,000 tpd
Low-grade stockpile (avg. grade 0.44 g/t)
Natural segregation of fines
from unloading truck
19
Second Test in Q3-Q4 2015:
 Fines processed in July
and continuing in Q4
 Tonnage up to 4,000 tpd
 Validate milling rate
improvement
If results are successful:
 Incorporate into LOM plan
› Potential for +20,000 oz/yr at very low cost
Processing of Fines
X No
fines
 With
fines Projected model
Plant
throughput
55,000 54,000
Loss of 1,000 tpd
of capacity
Added
throughput
0 4,000 Gain of 4,000 tpd
Total 55,000 58,000 Net gain of 3,000 tpd
20
 Drilling program started at end of June
 16,185 metres in 41 holes completed as of August 30
 All holes have intersected the targeted mineralized zones
 Majority of holes encountered visible gold
 Further targets identified from Magnetic & IP surveys east of
Lower Detour trend
 Budget increased to approximately US$8 million
Exploration – Lower Detour
30,000 m drilling program underway
21
PRODUCTION GROWTH /
DECLINING UNIT COSTS
REALIZE VALUE-ENHANCING
OPPORTUNITIES
MATERIAL INPUTS TRENDING
FAVOURABLY
GROWING CASH FLOW
A GREAT TIME TO BE A
GOLD PRODUCER!
22
ADDITIONAL
information
 2015 Safety Performance
 Q2 2015 Operational & Financial
Summary
 Detour Gold Reserves &
Resources
 Detour Lake & Block A
 Lower Detour Exploration
 Shareholder Information
 Analyst Coverage
 Cautionary Statement
 Management & Directors
 Contact Information
23
3.9
2.5
2.8
0
0.5
1
1.5
2
2.5
3
3.5
4
2014 ON
Average2
Zero Harm is Our Goal
Total Recordable Injury
Frequency Rate1
2015 Safety Performance
H1 20152014
H1 2015
 TRIFR at 2.8 with
Q2 higher than Q1
2015 Initiatives
 Safety Leadership
for Safe Production
 Life Saving Rules
1. Total recordable injury frequency rates = number of recorded injuries per 200,000 hours worked.
2. 2014 Ontario Mining Industry average (source: Workplace Safety North, WSIB).
24
Q2 2015 Operational Statistics
Q2’14 Q3’14 Q4’14 Q1’15 Q2’15
Ore mined (Mt) 2.89 4.20 4.30 3.82 6.37
Waste mined (Mt) 16.11 14.71 15.39 15.97 19.08
Total mined (Mt) 19.00 18.91 19.69 19.79 25.45
Strip ratio (waste:ore) 5.6 3.5 3.6 4.2 3.0
Mining rate (tpd) 209,000 206,000 214,000 220,000 280,000
Ore milled (Mt) 4.42 4.53 4.71 4.30 5.19
Mill grade (g/t Au) 0.91 0.88 0.85 0.84 0.82
Recovery (%) 91 90 91 91 91
Mill throughput (tpd) 48,569 49,186 51,142 47,797 57,015
Mill operating time (%) 83 81 83 78 88
Ounces produced (oz) 117,366 115,344 116,770 105,572 125,348
Ounces sold (oz) 107,206 106,334 124,913 104,497 123,296
25
Q2 2015 Financial Summary
Key Financial Statistics
(US$ M, unless noted)
Q2’15
Metal sales $147.5
Production costs ($100.2)
Depreciation & depletion ($39.8)
Earnings from mine operations $7.5
Net loss/adjusted net earnings1 ($15.4) / 0.5
Net loss/adjusted basic earnings
per share1 ($0.09) / $0.00
Cash & short-term investments $133.2
1. Refer to the section on Non-IFRS Financial Performance Measures on slide 3 of this presentation.
Note: The Company has been notified by the Independent Electricity System Operator (“IESO”) of an adjustment to its electricity rebate
for the period between January 2013 and April 2015, which has resulted in an additional electricity cost of US$12.5 million (refer to Note 6i
in second quarter 2015 financial statements). The balance is payable in 20 equal monthly instalments starting in Q3 2015. As per its
contract with IESO, the Company pays a maximum of C$0.05/kWh until December 2019. The Company has filed for a three-year
extension of the contact.
Refer to the MD&A for Q2’15.
26
Effective December 31, 2014 Tonnes (Mt) Grade (g/t Au) Contained Gold (koz)
Reserves
(1,2,3,4,5)
Detour Lake Mine Proven 94.2 1.25 3,795
Probable 364.6 0.95 11,146
P&P 458.8 1.01 14,941
Stockpiles 0.7 0.74 16
Total P&P 459.4 1.01 14,957
Resources
(1,3,4,5)
Detour Lake Mine Measured (M) 16.4 1.37 725
Indicated (I) 65.9 1.01 2,150
M+I 82.4 1.09 2,874
Block A Measured (M) 1.5 1.21 57
Indicated (I) 52.5 1.15 1,934
M+I 53.9 1.15 1,991
Total M+I 136.3 1.11 4,866
Detour Lake Mine Inferred 19.1 0.75 463
Block A Inferred 2.5 1.23 99
Total Inferred 21.6 0.81 562
Detour Gold: Reserves & Resources
1. Mineral reserves calculated using a gold price of US$1,000/oz; mineral resources calculated using US$1,200/oz. Foreign exchange
rate of C$1.03 to US$1.00 (refer to the “Detour Lake Mine NI 43-101 Technical Report dated February 4, 2014).
2. Mineral reserves estimated using a 4% dilution at 0.20 g/t Au and 5% ore loss.
3. Based on an elevated cut-off grade of 0.5 g/t Au for Detour Lake and cut-off grade of 0.6 g/t Au for Block A.
4. Mineral resources are exclusive of mineral reserves. Mineral resources that are not mineral reserves do not have demonstrated
economic viability. Mineral reserves and resources are compliant with CIM definitions.
5. Totals may not add due to rounding.
27
Detour Lake & Block A
US$1,000/oz
US$1,200/oz
15.5 Moz
@ 1.02 g/t Au
P+P
2.0 Moz
@ 1.15 g/t Au
M+I
~5.5 km
Current
North
Pit
Note: Mineral reserves and resources as of December 31, 2013. Refer to February 2014 Technical Report.
28
Lower Detour
Area
630 km2
Exploration Focus: Lower Detour
Block A
Resource
Detour Lake
OP Mine
29
Lower Detour Phase 1 Drilling Program*
*Phase 1 drilling completed in Q1’15.
30
Lower Detour Phase 1 Drilling Program*
*Phase 1 drilling completed in Q1’15.
31
Lower Detour Phase 1 Drilling Program*
*Phase 1 drilling completed in Q1’15.
32
1. Conversion price for the Notes is US$38.50.
2. Cash and short-term investments at June 30, 2015.
Shareholder Information
Paulson & Co.
>80% INSTITUTIONS TOTAL8.9 M Share options
13.0 M Convertible notes 1
192.6 M FULLY DILUTED
170.7 M Issued & outstanding
Share Structure (03/31/2014) Top Shareholders
13%
C$2.3
6
BILLION
market capUS$133.2
3
MILLION
cash position2
Share Structure (July 31, 2015) Top Shareholders
33
Initiating
Research
Firm Analyst Target Price at
September 2, 2015
07.06.11 Haywood Kerry Smith $18.50
07.07.09 Paradigm Don Blyth/Don MacLean $18.50
07.08.07 Raymond James Phil Russo $15.00
07.11.26 National Bank Steve Parsons $17.50
07.12.20 Macquarie Mike Siperco $17.00
08.01.14 Canaccord Rahul Paul $19.00
08.07.14 TD Dan Earle $18.50
08.09.04 RBC Dan Rollins $19.00
08.11.06 BMO NB Brian Quast $16.00
09.06.17 Laurentian Killian Charles $16.40
10.05.19 CIBC World Markets Cosmos Chiu $16.50
10.07.22 Credit Suisse Anita Soni $17.50
13.04.16 Scotiabank Trevor Turnbull $18.00
13.08.14 Desjardins Michael Parkin $18.00
13.11.12 Beacon Securities Michael Curran $15.75
13.12.09 GMP Securities Ian Parkinson $10.20
14.02.06 Cormark Securities Richard Gray/Tyron Breytenbach $20.00
14.04.22 Goldman Sachs Andrew Quail $17.00
14.06.17 Dundee Capital Markets Josh Wolfson Under review
14.09.03 Morgan Stanley Brad Humphrey $16.50
Average target C$17.10
Analyst Coverage (20)
34
Cautionary Statement
Information Containing Estimates of Mineral Reserves and Resources
The mineral reserve and resource estimates reported in this presentation were prepared in accordance with Canadian National Instrument 43-101
Standards of Disclosure for Mineral Projects (“NI 43-101”), as required by Canadian securities regulatory authorities. For United States reporting
purposes, the United States Securities and Exchange Commission (“SEC”) applies different standards in order to classify mineralization as a reserve. In
particular, while the terms “measured,” “indicated” and “inferred” mineral resources are required pursuant to NI 43-101, the SEC does not recognize such
terms. Canadian standards differ significantly from the requirements of the SEC. Investors are cautioned not to assume that any part or all of the mineral
deposits in these categories constitute or will ever be converted into reserves. In addition, “inferred” mineral resources have a great amount of
uncertainty as to their existence and great uncertainty as to their economic and legal feasibility. It cannot be assumed that all or any part of an inferred
mineral resource will ever be upgraded to a higher category. Under Canadian securities laws, issuers must not make any disclosure of results of an
economic analysis that includes inferred mineral resources, except in rare cases.
On February 4, 2014, Detour Gold announced an updated life of mine plan for the Detour Lake mine. The NI 43-101 compliant Technical Report for this
update was filed on SEDAR on February 4, 2014. The following QPs participated in this update: BBA Inc., under the direction of André Allaire, Eng.,
Acting President and CEO and Patrice Live, Eng., Director Mining; SGS Canada Inc., under the direction of Yann Camus, Eng., Project Engineer, and
Maxime Dupéré, P.Geo., Senior Geologist; and AMEC Environment & Infrastructure, a Division of AMEC Americas Limited, David G. Ritchie M.Eng.,
P.Eng, Senior Associate Geotechnical Engineer and Geotechnical Engineering Group Manager.
The scientific and technical content of this presentation has been reviewed, verified and approved by Drew Anwyll, P.Eng., Senior Vice President
Technical Services, a Qualified Person as defined by Canadian Securities Administrators National Instrument 43-101 “Standards of Disclosure for
Mineral Projects”.
35
 Paul Martin
President and CEO
 Pierre Beaudoin
COO
 James Mavor
CFO
 Drew Anwyll
Sr VP Technical Services
 Julie Galloway
Sr VP General Counsel &
Corporate Secretary
 Derek Teevan
Sr VP Corporate &
Aboriginal Affairs
 Jean-François Métail
VP Mineral Resource
Management
 Rachel Pineault
VP HR & Aboriginal Affairs
 Jim Robertson
VP Environment &
Sustainability
 Charles Hennessey
Mine General Manager
 Andrew Croal
Director Technical Services
 Laurie Gaborit
Director Investor Relations
 Alberto Heredia
Controller
 Bill Snelling
Director Corporate Systems & Controls
 Lisa Colnett
 Robert E. Doyle
 André Falzon
 Alex G. Morrison
 Jonathan Rubenstein
 Graham Wozniak
 Ingrid Hibbard
 Michael Kenyon
 Paul Martin
Management & Directors
Management
Directors
36
Laurie Gaborit
Director Investor Relations
Email: lgaborit@detourgold.com
Phone: 416.304.0581
Paul Martin
President and Chief Executive Officer
Email: pmartin@detourgold.com
Phone: 416.304.0800
www.detourgold.com
Contact Information

Dgc 15 09_03 - corporate presentation

  • 1.
    1 CANADA’S INTERMEDIATE GOLD PRODUCER Cormark’sOne on One Gold Marketing Toronto – September 3, 2015
  • 2.
    2 Forward Looking Information Thispresentation contains certain forward-looking information and statements as defined in applicable securities law (referred to herein as “forward-looking statements”). Forward-looking statements include, but are not limited to, statements with respect to 2015 guidance for production, total cash costs, all-in sustaining costs, capital costs, deferred stripping costs, and exploration costs; expected throughput, mining and recovery rates; expected future production and mining activities; opportunities to optimize the mine operation; timeline for the life of mine plan update, and exploration program; and opportunities to optimize the mine operation. Forward-looking statements involve known and unknown risks, uncertainties and other factors which may cause actual results, performance or achievements to be materially different from any of its future results, performance or achievements expressed or implied by forward- looking statements. These risks, uncertainties and other factors include, but are not limited to, assumptions and parameters underlying the life of mine update not being realized, a decrease in the future gold price, discrepancies between actual and estimated production, changes in costs (including labour, supplies, fuel and equipment), changes to tax rates; environmental compliance and changes in environmental legislation and regulation, exchange rate fluctuations, general economic conditions and other risks involved in the gold exploration and development industry, as well as those risk factors discussed in the section entitled “Description of Business - Risk Factors” in Detour Gold’s 2014 AIF and in the continuous disclosure documents filed by Detour Gold on and available on SEDAR at www.sedar.com. Such forward-looking statements are also based on a number of assumptions which may prove to be incorrect, including, but not limited to, assumptions about the following: the availability of financing for exploration and development activities; operating and sustaining capital costs; the Company’s ability to attract and retain skilled staff; sensitivity to metal prices and other sensitivities; the supply and demand for, and the level and volatility of the price of, gold; the supply and availability of consumables and services; the exchange rates of the Canadian dollar to the U.S. dollar; energy and fuel costs; the accuracy of reserve and resource estimates and the assumptions on which the reserve and resource estimates are based; market competition; ongoing relations with employees and impacted communities and general business and economic conditions. Accordingly, readers should not place undue reliance on forward-looking statements. The forward-looking statements contained herein are made as of the date hereof, or such other date or dates specified in such statements. All forward-looking statements in this presentation are necessarily based on opinions and estimates made as of the date such statements are made and are subject to important risk factors and uncertainties, many of which cannot be controlled or predicted. Detour Gold and the Qualified Persons who authored the associated Technical Report undertake no obligation to update publicly or otherwise revise any forward-looking statements contained herein whether as a result of new information or future events or otherwise, except as may be required by law.
  • 3.
    3 Notes to Investors Thescientific and technical content of this presentation was reviewed, verified and approved by Drew Anwyll, P.Eng., Senior Vice President Technical Services, and exploration results was reviewed, verified and approved by Guy MacGillivray, P.Geo., Exploration Manager , both Qualified Person as defined by Canadian Securities Administrators National Instrument 43-101 “Standards of Disclosure for Mineral Projects”. Qualified Persons Non-IFRS Financial Performance Measures The Company has included non-IFRS measures in this presentation: total cash costs, all-in sustaining costs, adjusted net loss and adjusted net loss per share. The Company believes that these measures, in addition to conventional measures prepared in accordance with IFRS, provide investors an improved ability to evaluate the underlying performance of the Company. The non-IFRS measures are intended to provide additional information and should not be considered in isolation or as a substitute for measures of performance prepared in accordance with IFRS. These measures do not have any standardized meaning prescribed under IFRS, and therefore may not be comparable to other issuers. Other companies may calculate these measure differently. Detour Gold reports total cash costs on a sales basis. Total cash costs include production costs such as mining, processing, refining and site administration, less non-cash share-based compensation and net of silver sales divided by gold ounces sold to arrive at total cash costs per gold ounce sold. The measure also includes other mine related costs incurred such as mine standby costs and current inventory write downs. Production costs are exclusive of depreciation and depletion. Production costs include the costs associated with providing the royalty in kind ounces. Commencing in 2015, the Company adopted all-in sustaining costs on a prospective basis. The Company believes this measure more fully defines the total costs associated with producing gold. The Company calculates all-in sustaining costs as the sum of total cash costs (as described above), share-based compensation, corporate general and administrative expense, exploration and evaluation expenses that are sustaining in nature, reclamation cost accretion, sustaining capital including deferred stripping, and realized gains and losses on hedges due to operating and capital costs, all divided by the gold ounces sold to arrive at a per ounce figure. Costs excluded from all-in sustaining costs are non-sustaining capital expenditures and exploration costs that are expected to materially increase production, financing costs and tax expense. Consequently, this measure is not representative of all of the Company’s cash expenditures. In addition, the calculation of all-in sustaining costs does not include depreciation and depletion expense as it does not reflect the impact of expenditures incurred in prior periods. Adjusted net earnings (loss) and adjusted basic earnings (loss) per share are used by management and investors to measure the underlying operating performance of the Company. Presenting these measures from period to period helps management and investors evaluate earnings trends more readily in comparison with results from prior periods. Adjusted net earnings (loss) is defined as net earnings (loss) adjusted to exclude specific items that are significant, but not reflective of the underlying operations of the Company, including: fair value change of the convertible notes, the impact of foreign exchange gains and losses, including the foreign exchange on deferred income and mining taxes, non-cash unrealized gains and losses on derivative instruments, accretion on convertible notes, unwinding of discount on decommissioning and restoration provisions, impairment provisions and reversals thereof, and other non-recurring items. Adjusted basic net earnings (loss) per share is calculated using the weighted average number of shares outstanding under the basic method of loss per share as determined under IFRS.
  • 4.
    4 Unique Investment Opportunity Mining-friendlyJurisdiction  Large-scale, long mine life  Largest gold producing mine not controlled by a senior producer  Growing cash flow profile  Production growth opportunities  Favourable exposure to Canadian Dollar DOMINANT GOLD PRODUCER IN CANADA
  • 5.
    5 2015 Production Guidance(Koz) #2 in Production and #1 in Reserves DGC Detour Lake AEM/YRI Canadian Malartic AEM Meadowbank G Red Lake Canadian Intermediate Gold Producer 400- 425 560 475- 525 400 Gold Reserves (Moz) DGC Detour Lake AEM/YRI Canadian Malartic AEM Meadowbank G Red Lake 2.1 15.0 8.7 1.2
  • 6.
    6 2015 Drivers toSuccess Execution of Plan  Gold production increase with higher mining and milling rates  Strengthen balance sheet Added Benefits  Significant leverage to gold price and Canadian dollar  Low power and favourable diesel costs Near to Long-Term Value Enhancements  Plant optimization (with limited capital)  Development of Block A  Exploration potential
  • 7.
    7 2015 Guidance1 TCC2 $780- $850 AISC/oz sold2 $1,050-$1,150 CapitalExpenditures  Sustaining capital: US$90-100 M 475,000 - 525,000 Gold ounces ESTIMATED COSTS ESTIMATED PRODUCTION  Deferred stripping: US$20-25 M 1. Cost assumptions (US$): Gold price of $1,200/oz, diesel fuel price of $0.82 per litre; power cost of $0.04 per kilowatt hour; and exchange rate of $1.00US:$1.15Cdn. 2. Refer to the section on Non-IFRS Performance Measures on slide 3 of this presentation. 2015 third year of operation
  • 8.
    8 H1 2015 –Solid Progress 106 125 $1,321 $1,030 $750 $850 $950 $1,050 $1,150 $1,250 $1,350 0 20 40 60 80 100 120 140 H1 2015: Detour Lake Mine ■ AISC (US$/oz sold)1 ■ Gold Production (k oz) Q1 Q2 1. Refer to the section on Non-IFRS Performance Measures on slide 3 of this presentation. Reconciliation and adjustment of this measure is described in the MD&A for Q2’15. H1 2015 Highlights:  Gold production of 230,920 oz at TCC of $828/oz sold and AISC of $1,163/oz sold  Break-even cash flow position  Positive amendments to credit facility of C$135 M  Cash position of US$133 M at June 30 H2 2015 Expectations:  Stronger operational performance  Encouraging results from Lower Detour 30,000 m drilling program
  • 9.
    9  Continued positiveprogress on drilling rates, blasted inventory, and shovel productivity  Mining rates averaged 280,000 tpd, exceeding budget by 18% 220 280 170 190 210 230 250 270 290 310 Q1A Q2A H2EQ1 Q2Mining Rates (k tpd) Q2 2015 Operating Results – Mine H1 Achieved H2 Target: 250-290 k tpd H L
  • 10.
    10 Successful re-build ofROM stockpiles at Q2 end (1.7 Mt @ 0.71 g/t) provides operational flexibility for H2 2015:  Focus on delivering higher grade to mill  Accelerate Phase 2 pre-stripping  On target for east end pit access to higher grade (former Campbell pit area)  Maximize TMA placement efficiency (using CAT795 trucks) H2 2015 Mine Plan Focus Targeting 250,000 to 290,000 tpd for remainder of 2015
  • 11.
    11  Throughput rateof 57,015 tpd  At design capacity since March  Milling rates at 2,712 tpoh with operating time improving to 88%  Exceeding design of 2,500 tpoh 48 57 55* 30 40 50 60 Q1'15 Q2'15 H2E Q2 2015 Operating Results - Mill 2015 Mill Throughput (k tpd) MT ore milled 0.82 G/T AU head grade % gold recovery 5.2 91 Q2’15 Performance Q1 Q2 *Excluding the processing of fines
  • 12.
    12 H2 2015 Focus– Mill H2 Focus  Continue plant optimization efforts  Assess robustness of 410-conveyor  Increase operating time to >90%  Increase milling rate to 2,800 tpoh with ‘fines’  Processing of fines in month of July; test to continue in Q4  Targeting average throughput rate of 55,000 tpd for H2 2015 MT ore milled 0.86 G/T AU head grade % gold recovery 19.7 91.5 2015 Mine Plan Targets
  • 13.
    13 $954 $955 $886 $939 $734 Q2'14 Q3'14Q4'14 Q1'15 Q2'15 Q2 2015 Operating Costs  Significant cost reduction per ounce & tonne due to economies of scale  Continued reduction of plant consumables TCC & AISC1,2 ($/oz sold) Trending down Q2’15 $1,321 $1,030 1. Refer to the section on Non-IFRS Performance Measures on slide 3. Reconciliation of these measures is described in the MD&A for the relevant periods. 2. The calculation for TCC and AISC (non-IFRS measures) and processing unit costs, including prior periods, were adjusted to allocate the electricity adjustment into the appropriate historical period to which the cost applied. Refer to slide 24 and MD&A for Q2’15. Q1’15 Q2’15 2015E Mining (C$/t mined) $3.16 $2.42 $2.60 Processing2 (C$/t milled) $11.78 $8.81 $9.87 G&A (C$/t milled) $3.89 $2.72 $3.05  Total Cash Costs1  Other (Sustaining capital, G&A and exploration)
  • 14.
    14 1. Includes US$2.0M NAC settlement payment.  Q2 Sustaining Capital Mine $30 M TMA $34 M Other $13 M Mill $9 M Water Management $10 M 14 Q2 2015 Capital Expenditures Q1’15 Q2’15 2015E Sustaining Capital $19.8 M $25.8 M $90-100 M Capitalized Stripping $10.0 M - $20-25 M Total (US$) $29.8 M $25.8 M $110-125 M Breakdown of 2015 Sustaining Capital (US$) ~90% of costs in Cdn$ Mine $7.5 M Mill $5.2 M TMA $6.5 M Other $6.6 M1
  • 15.
    15 Benefiting from aWeak Cdn $ $1,000 $1,100 $1,200 $1,300 $1,400 $1,500 Budget 2015 1-Jan-15 1-Sep-15 $Cdn $US Gold Performance YTD $Cdn: +10% $US: -3% $/oz FX rate 1.15 1.16 1.32 YTD 2015 Gold Price in US Dollars vs Canadian Dollars $1,380 $1,372 $1,505 $1,200 $1,182 $1,142
  • 16.
    16 Prudent Financial Management Hedgeup to 50% of 2015 Gold Production Forward sales on 35,000 oz @ US$1,276/oz Currency Exchange Contracts Zero-cost collars for US$40 M with a ceiling of 1.21; Forward contracts for US$40 M at average 1.26 Hedge ~50% of Next 3 Months’ Diesel Use Purchasing diesel product (~6 M litres) at effective hedge price of US$0.46/litre As at June 30, 2015: Mark-to-market value of US$3 M No addition to hedging programs in Q2’15
  • 17.
    17  Optimize capitalvs mine output (at gold price of US$1,200/oz long-term)  Evaluate production ranging from 110 to 140 Mt annually (equivalent to mining rates of 300,000 to 385,000 tpd)  Include Block A as a second feed source (at earliest 2018)  Evaluate the use of Block A pit as waste rock dump and TMA cell  Evaluate the inclusion of enriched low-grade stockpile (fines) in mineral reserves (2nd test underway) LOM Plan Update – EOY Target Goal: Maximize Returns for Next 5-10 yrs and Optimize NAV
  • 18.
    18 Processing of Fines Segregationof fines:  Gold concentrates in the finer material  Segregation of fines allows for: ›better grade ›faster processing rates First Test in Fall 2014:  Positive results from first 200,000 tonnes test › grade of 0.62 g/t = 41% higher than avg. grade of SP › processed at 68,000 tpd Low-grade stockpile (avg. grade 0.44 g/t) Natural segregation of fines from unloading truck
  • 19.
    19 Second Test inQ3-Q4 2015:  Fines processed in July and continuing in Q4  Tonnage up to 4,000 tpd  Validate milling rate improvement If results are successful:  Incorporate into LOM plan › Potential for +20,000 oz/yr at very low cost Processing of Fines X No fines  With fines Projected model Plant throughput 55,000 54,000 Loss of 1,000 tpd of capacity Added throughput 0 4,000 Gain of 4,000 tpd Total 55,000 58,000 Net gain of 3,000 tpd
  • 20.
    20  Drilling programstarted at end of June  16,185 metres in 41 holes completed as of August 30  All holes have intersected the targeted mineralized zones  Majority of holes encountered visible gold  Further targets identified from Magnetic & IP surveys east of Lower Detour trend  Budget increased to approximately US$8 million Exploration – Lower Detour 30,000 m drilling program underway
  • 21.
    21 PRODUCTION GROWTH / DECLININGUNIT COSTS REALIZE VALUE-ENHANCING OPPORTUNITIES MATERIAL INPUTS TRENDING FAVOURABLY GROWING CASH FLOW A GREAT TIME TO BE A GOLD PRODUCER!
  • 22.
    22 ADDITIONAL information  2015 SafetyPerformance  Q2 2015 Operational & Financial Summary  Detour Gold Reserves & Resources  Detour Lake & Block A  Lower Detour Exploration  Shareholder Information  Analyst Coverage  Cautionary Statement  Management & Directors  Contact Information
  • 23.
    23 3.9 2.5 2.8 0 0.5 1 1.5 2 2.5 3 3.5 4 2014 ON Average2 Zero Harmis Our Goal Total Recordable Injury Frequency Rate1 2015 Safety Performance H1 20152014 H1 2015  TRIFR at 2.8 with Q2 higher than Q1 2015 Initiatives  Safety Leadership for Safe Production  Life Saving Rules 1. Total recordable injury frequency rates = number of recorded injuries per 200,000 hours worked. 2. 2014 Ontario Mining Industry average (source: Workplace Safety North, WSIB).
  • 24.
    24 Q2 2015 OperationalStatistics Q2’14 Q3’14 Q4’14 Q1’15 Q2’15 Ore mined (Mt) 2.89 4.20 4.30 3.82 6.37 Waste mined (Mt) 16.11 14.71 15.39 15.97 19.08 Total mined (Mt) 19.00 18.91 19.69 19.79 25.45 Strip ratio (waste:ore) 5.6 3.5 3.6 4.2 3.0 Mining rate (tpd) 209,000 206,000 214,000 220,000 280,000 Ore milled (Mt) 4.42 4.53 4.71 4.30 5.19 Mill grade (g/t Au) 0.91 0.88 0.85 0.84 0.82 Recovery (%) 91 90 91 91 91 Mill throughput (tpd) 48,569 49,186 51,142 47,797 57,015 Mill operating time (%) 83 81 83 78 88 Ounces produced (oz) 117,366 115,344 116,770 105,572 125,348 Ounces sold (oz) 107,206 106,334 124,913 104,497 123,296
  • 25.
    25 Q2 2015 FinancialSummary Key Financial Statistics (US$ M, unless noted) Q2’15 Metal sales $147.5 Production costs ($100.2) Depreciation & depletion ($39.8) Earnings from mine operations $7.5 Net loss/adjusted net earnings1 ($15.4) / 0.5 Net loss/adjusted basic earnings per share1 ($0.09) / $0.00 Cash & short-term investments $133.2 1. Refer to the section on Non-IFRS Financial Performance Measures on slide 3 of this presentation. Note: The Company has been notified by the Independent Electricity System Operator (“IESO”) of an adjustment to its electricity rebate for the period between January 2013 and April 2015, which has resulted in an additional electricity cost of US$12.5 million (refer to Note 6i in second quarter 2015 financial statements). The balance is payable in 20 equal monthly instalments starting in Q3 2015. As per its contract with IESO, the Company pays a maximum of C$0.05/kWh until December 2019. The Company has filed for a three-year extension of the contact. Refer to the MD&A for Q2’15.
  • 26.
    26 Effective December 31,2014 Tonnes (Mt) Grade (g/t Au) Contained Gold (koz) Reserves (1,2,3,4,5) Detour Lake Mine Proven 94.2 1.25 3,795 Probable 364.6 0.95 11,146 P&P 458.8 1.01 14,941 Stockpiles 0.7 0.74 16 Total P&P 459.4 1.01 14,957 Resources (1,3,4,5) Detour Lake Mine Measured (M) 16.4 1.37 725 Indicated (I) 65.9 1.01 2,150 M+I 82.4 1.09 2,874 Block A Measured (M) 1.5 1.21 57 Indicated (I) 52.5 1.15 1,934 M+I 53.9 1.15 1,991 Total M+I 136.3 1.11 4,866 Detour Lake Mine Inferred 19.1 0.75 463 Block A Inferred 2.5 1.23 99 Total Inferred 21.6 0.81 562 Detour Gold: Reserves & Resources 1. Mineral reserves calculated using a gold price of US$1,000/oz; mineral resources calculated using US$1,200/oz. Foreign exchange rate of C$1.03 to US$1.00 (refer to the “Detour Lake Mine NI 43-101 Technical Report dated February 4, 2014). 2. Mineral reserves estimated using a 4% dilution at 0.20 g/t Au and 5% ore loss. 3. Based on an elevated cut-off grade of 0.5 g/t Au for Detour Lake and cut-off grade of 0.6 g/t Au for Block A. 4. Mineral resources are exclusive of mineral reserves. Mineral resources that are not mineral reserves do not have demonstrated economic viability. Mineral reserves and resources are compliant with CIM definitions. 5. Totals may not add due to rounding.
  • 27.
    27 Detour Lake &Block A US$1,000/oz US$1,200/oz 15.5 Moz @ 1.02 g/t Au P+P 2.0 Moz @ 1.15 g/t Au M+I ~5.5 km Current North Pit Note: Mineral reserves and resources as of December 31, 2013. Refer to February 2014 Technical Report.
  • 28.
    28 Lower Detour Area 630 km2 ExplorationFocus: Lower Detour Block A Resource Detour Lake OP Mine
  • 29.
    29 Lower Detour Phase1 Drilling Program* *Phase 1 drilling completed in Q1’15.
  • 30.
    30 Lower Detour Phase1 Drilling Program* *Phase 1 drilling completed in Q1’15.
  • 31.
    31 Lower Detour Phase1 Drilling Program* *Phase 1 drilling completed in Q1’15.
  • 32.
    32 1. Conversion pricefor the Notes is US$38.50. 2. Cash and short-term investments at June 30, 2015. Shareholder Information Paulson & Co. >80% INSTITUTIONS TOTAL8.9 M Share options 13.0 M Convertible notes 1 192.6 M FULLY DILUTED 170.7 M Issued & outstanding Share Structure (03/31/2014) Top Shareholders 13% C$2.3 6 BILLION market capUS$133.2 3 MILLION cash position2 Share Structure (July 31, 2015) Top Shareholders
  • 33.
    33 Initiating Research Firm Analyst TargetPrice at September 2, 2015 07.06.11 Haywood Kerry Smith $18.50 07.07.09 Paradigm Don Blyth/Don MacLean $18.50 07.08.07 Raymond James Phil Russo $15.00 07.11.26 National Bank Steve Parsons $17.50 07.12.20 Macquarie Mike Siperco $17.00 08.01.14 Canaccord Rahul Paul $19.00 08.07.14 TD Dan Earle $18.50 08.09.04 RBC Dan Rollins $19.00 08.11.06 BMO NB Brian Quast $16.00 09.06.17 Laurentian Killian Charles $16.40 10.05.19 CIBC World Markets Cosmos Chiu $16.50 10.07.22 Credit Suisse Anita Soni $17.50 13.04.16 Scotiabank Trevor Turnbull $18.00 13.08.14 Desjardins Michael Parkin $18.00 13.11.12 Beacon Securities Michael Curran $15.75 13.12.09 GMP Securities Ian Parkinson $10.20 14.02.06 Cormark Securities Richard Gray/Tyron Breytenbach $20.00 14.04.22 Goldman Sachs Andrew Quail $17.00 14.06.17 Dundee Capital Markets Josh Wolfson Under review 14.09.03 Morgan Stanley Brad Humphrey $16.50 Average target C$17.10 Analyst Coverage (20)
  • 34.
    34 Cautionary Statement Information ContainingEstimates of Mineral Reserves and Resources The mineral reserve and resource estimates reported in this presentation were prepared in accordance with Canadian National Instrument 43-101 Standards of Disclosure for Mineral Projects (“NI 43-101”), as required by Canadian securities regulatory authorities. For United States reporting purposes, the United States Securities and Exchange Commission (“SEC”) applies different standards in order to classify mineralization as a reserve. In particular, while the terms “measured,” “indicated” and “inferred” mineral resources are required pursuant to NI 43-101, the SEC does not recognize such terms. Canadian standards differ significantly from the requirements of the SEC. Investors are cautioned not to assume that any part or all of the mineral deposits in these categories constitute or will ever be converted into reserves. In addition, “inferred” mineral resources have a great amount of uncertainty as to their existence and great uncertainty as to their economic and legal feasibility. It cannot be assumed that all or any part of an inferred mineral resource will ever be upgraded to a higher category. Under Canadian securities laws, issuers must not make any disclosure of results of an economic analysis that includes inferred mineral resources, except in rare cases. On February 4, 2014, Detour Gold announced an updated life of mine plan for the Detour Lake mine. The NI 43-101 compliant Technical Report for this update was filed on SEDAR on February 4, 2014. The following QPs participated in this update: BBA Inc., under the direction of André Allaire, Eng., Acting President and CEO and Patrice Live, Eng., Director Mining; SGS Canada Inc., under the direction of Yann Camus, Eng., Project Engineer, and Maxime Dupéré, P.Geo., Senior Geologist; and AMEC Environment & Infrastructure, a Division of AMEC Americas Limited, David G. Ritchie M.Eng., P.Eng, Senior Associate Geotechnical Engineer and Geotechnical Engineering Group Manager. The scientific and technical content of this presentation has been reviewed, verified and approved by Drew Anwyll, P.Eng., Senior Vice President Technical Services, a Qualified Person as defined by Canadian Securities Administrators National Instrument 43-101 “Standards of Disclosure for Mineral Projects”.
  • 35.
    35  Paul Martin Presidentand CEO  Pierre Beaudoin COO  James Mavor CFO  Drew Anwyll Sr VP Technical Services  Julie Galloway Sr VP General Counsel & Corporate Secretary  Derek Teevan Sr VP Corporate & Aboriginal Affairs  Jean-François Métail VP Mineral Resource Management  Rachel Pineault VP HR & Aboriginal Affairs  Jim Robertson VP Environment & Sustainability  Charles Hennessey Mine General Manager  Andrew Croal Director Technical Services  Laurie Gaborit Director Investor Relations  Alberto Heredia Controller  Bill Snelling Director Corporate Systems & Controls  Lisa Colnett  Robert E. Doyle  André Falzon  Alex G. Morrison  Jonathan Rubenstein  Graham Wozniak  Ingrid Hibbard  Michael Kenyon  Paul Martin Management & Directors Management Directors
  • 36.
    36 Laurie Gaborit Director InvestorRelations Email: lgaborit@detourgold.com Phone: 416.304.0581 Paul Martin President and Chief Executive Officer Email: pmartin@detourgold.com Phone: 416.304.0800 www.detourgold.com Contact Information