Download to read offline


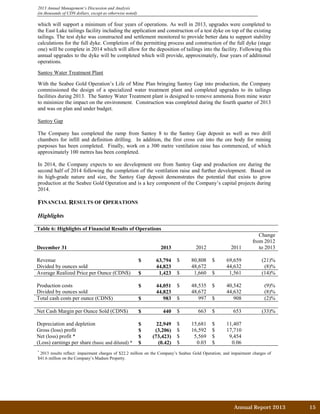
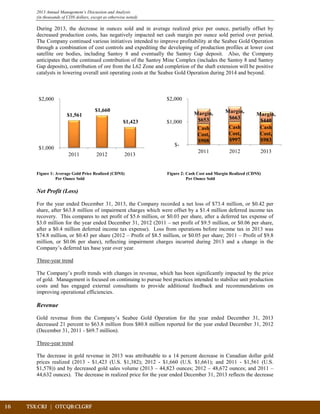
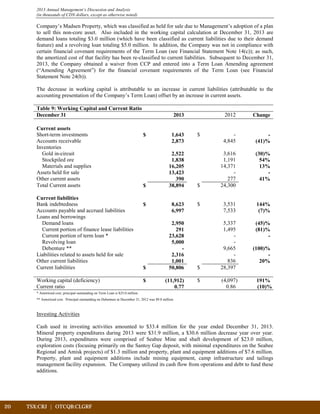
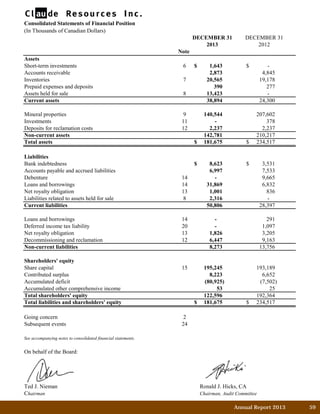
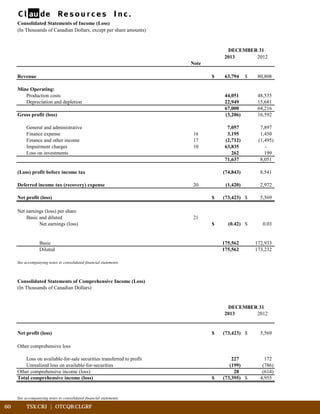


- Claude Resources Inc. is a Canadian gold mining company that owns and operates the Seabee Gold Operation in Saskatchewan and owns the Amisk Gold Project. - In 2013, production at Seabee was 43,850 ounces, revenue was $63.8 million, and the company reported a net loss of $73.4 million due to impairment charges. - Key events in 2013-2014 included the sale of the Madsen Project, the retirement of the CEO, an amendment to the term loan agreement, and the sale of a gold royalty to improve the company's financial position.


![Silvercrest january 2013 [compatibility mode]](https://cdn.slidesharecdn.com/ss_thumbnails/silvercrestjanuary2013compatibilitymode-130123141613-phpapp01-thumbnail.jpg?width=640&height=640&fit=bounds)


