Download to read offline


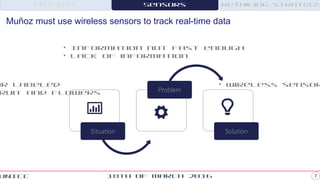

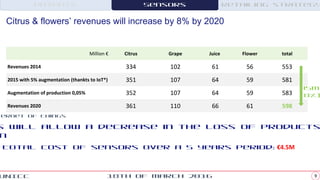
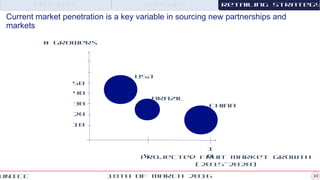


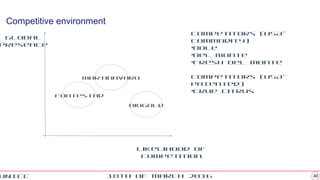


Muñoz Group is a successful company operating in a competitive market. It seeks to promote growth, diversification, and sustainability through short, middle, and long term solutions. This includes developing protected citrus varieties, using wireless sensors to track fruit production data in real-time, and investing in non-melting ice cream and edible insects to diversify and gain competitive advantages.


