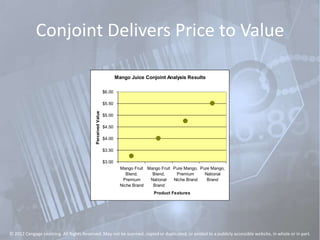
Tim J. Smith
Pricing Strategy: Setting Price Levels,
Managing Price Discounts, &
Establishing Price Structures
PowerPoint by
Tim J. Smith, PhD
Managing Principal, Wiglaf Pricing
Adjunct Professor of Marketing & Economics, DePaul University
© 2012 Cengage Learning. All Rights Reserved. May not be scanned, copied or duplicated, or posted to a publicly accessible website, in whole or in part.
Chapter 4
Price to Value
Exploring the Strategic Framework
Relating the Three Dominant
Approaches to Price Setting
© 2012 Cengage Learning. All Rights Reserved. May not be scanned, copied or duplicated, or posted to a publicly accessible website, in whole or in part.
Agenda
• What should we expect to find when we identify
products on the price versus value plane?
• What does it mean to be priced to value? Value
advantaged? Value disadvantaged?
• Are penetration pricing and skim pricing the only
pricing strategies for launching a new product?
• When launching a new product, which
competitors are most likely to be threatened?
• Stretch Question: When considering the use of
price versus value to capture market share, which
approach is more defensible?
© 2012 Cengage Learning. All Rights Reserved. May not be scanned, copied or duplicated, or posted to a publicly accessible website, in whole or in part.
Price Variability in Autos
• Large variation of prices for a similar good within
the same category
– Tata Nano $2500
– Chevrolet Malibu $28,000
– Bentley Flying Spur $170,000
– a factor of 68 between the lowest price production car
and the highest price product auto
• What justifies the price difference: Benefits
• Benefits based pricing is a direct extension of the
economics of pricing
© 2012 Cengage Learning. All Rights Reserved. May not be scanned, copied or duplicated, or posted to a publicly accessible website, in whole or in part.
Price to Benefits Map
• Price Boundary Theory
– Identify relevant competing
alternatives
– Define the value differential
– Pricing accordingly
• The price to benefits map plots
the position of products in
terms of perceived products
and perceived benefits….
– Visual representation of how
customers perceive the value
trade off.
PerceivedPrice
Perceived Benefits
Tata
Nano
Lexus LS
Chevrolet
Malibu
BMW 7
Series
Bentley Flying
Spur
© 2012 Cengage Learning. All Rights Reserved. May not be scanned, copied or duplicated, or posted to a publicly accessible website, in whole or in part.
EVM Model Delivers Price to Value
Stent Exchange Value Model Results
0
500
1000
1500
2000
2500
3000
3500
4000
Standard Stent Druge Eluting Stent
Strent
EvaluatedValue
© 2012 Cengage Learning. All Rights Reserved. May not be scanned, copied or duplicated, or posted to a publicly accessible website, in whole or in part.
Conjoint Delivers Price to Value
Mango Juice Conjoint Analysis Results
$3.00
$3.50
$4.00
$4.50
$5.00
$5.50
$6.00
Mango Fruit
Blend,
Premium
Niche Brand
Mango Fruit
Blend,
National
Brand
Pure Mango,
Premium
Niche Brand
Pure Mango,
National
Brand
Product Features
PerceivedValue
© 2012 Cengage Learning. All Rights Reserved. May not be scanned, copied or duplicated, or posted to a publicly accessible website, in whole or in part.
The Market Expects Price to Value
Exhaust Fan Prices (Grainger)
$800
$900
$1,000
$1,100
$1,200
$1,300
$1,400
$1,500
$1,600
0 1000 2000 3000 4000 5000 6000 7000
Capacity (CFM)
Price
© 2012 Cengage Learning. All Rights Reserved. May not be scanned, copied or duplicated, or posted to a publicly accessible website, in whole or in part.
Pricing Areas
• Value Equivalence Line
– Where price increases
proportional to benefits
increases
• Value Advantaged
– Excess benefits beyond what is
captured in price
• Value Disadvantaged
– Priced higher than what would
be justified based on the
measure of benefits alone
PerceivedPrice Perceived Benefits
Value
Advantaged
Value
Disadvantaged
Zone of
Indifference
Value
Equivalence
Line
© 2012 Cengage Learning. All Rights Reserved. May not be scanned, copied or duplicated, or posted to a publicly accessible website, in whole or in part.
Zone of Indifference
• Around the value equivalence line is a zone of indifference
– Small variations in price or benefits around the value equivalence line have
non measureable effect on sales volume
• Not all products will fall along the value equivalence line
– Outside of this zone of indifference, lies the value advantaged zone and the
value disadvantaged zone.
– Products lying in the value advantaged or disadvantaged zones are either
priced significantly lower or higher than the corresponding levels of benefits,
as perceived by customers
• Elasticity is a key ingredient for determining the width of this zone.
• There is a range of pricing moves that will not impact purchasing behavior
at all
– Range of demand inelasticity, as the next nearest competitor is out of the
comparison metric
– Can be a source of a painless price increase, thus improving profitability
© 2012 Cengage Learning. All Rights Reserved. May not be scanned, copied or duplicated, or posted to a publicly accessible website, in whole or in part.
Variance in Price Elasticity
• Big Number syndrome
– large changes in price have non-linear
effect on elasticity of demand
– Zone of credibility
• Below expectation price the offering has no
credible value.
• Above expectation price and customers do
not believe it is possible to deliver that
many benefits
• Benefit Bracketed
– Benefit Floor: Required minimal level of
benefits
– Benefit Ceiling : Exceeding a maximum
level, maximum WTP for benefits … more
horsepower in a car becomes unnecessary
• Price Capped
– Budget constraints
– Price category spending constraints
• Variance by segment
– different customer segments have
different price sensitivities
• Variance with time
– customer needs change over time, product
lifecycle and expectation of growing
benefits for same dollar
• Variance by price communication method
– daily, monthly, or annual payment
schemes can affect price sensitivity
• Variance by discounting method
– off invoice discounts vs. on receipt
discounts have different effects on
perceived price
• Creating demand vs. shifting shares
– market growth by lowering price of item or
is it just steeling a fixed share
• Cross-product elasticity.
– Switching between categories: cars vs.
bicycles
– As aluminum became cheaper, it displaced
steel in beverage cans, later displaced
itself by plastic
– Paper or plastic bags
© 2012 Cengage Learning. All Rights Reserved. May not be scanned, copied or duplicated, or posted to a publicly accessible website, in whole or in part.
Value Advantaged
• At times, companies will choose to price
aggressively, thus providing more benefits than
expected at a given price
• Unharvested Value
– Some authors refer to products priced in the value
advantaged zone as suffering from “unharvested
value” because the company has the opportunity
with products that are “value advantaged” to
raise the prices.
– Consider it a pricing error
– Ex: selling front row seats at the same price as
lawn seats in a large amphitheatre
• Market Share Taking
– Customers perceive that more benefits are
delivered at a given price through the value
advantaged product, and rationally choose to
select that product.
– Warning: deliberately pricing products in the
value advantaged zone is likely to instigate a
competitive reaction, such as a potential price
war, harming overall industry health
• Hypercompetition
– Certain product categories, technology driven
sectors in particular, enjoy sequential
improvements in product quality over time
• Autos and gas mileage
• DRAM decreases in costs per kb each time a new
photolithography standard becomes available
• LCD TV’s, computer processors, etc likewise enjoy
such costs reductions over time
– Aggressively pricing new technology that offers
significant costs advantages over legacy
technology is a common trait in certain markets.
Forms the basis for the concept of
Hypercompetion,
– See D’Aveni
© 2012 Cengage Learning. All Rights Reserved. May not be scanned, copied or duplicated, or posted to a publicly accessible website, in whole or in part.
Value Disadvantaged
• At the other end of the spectrum,
companies will at times price a product
high in comparison to the perceived
benefits of that offering.
• Missed Opportunities
– Some authors refer to this as missed
opportunities, as the firm could have sold
a higher volume if their prices were more
inline with expectation levels
– Consider it too a pricing error
– Ex: Unsold advertising space within a
poplar magazine
• Usually results in a loss of market share
• Can be stable if the product does offer
superior benefits along a dimension not
measured
– Can be used effectively to capture profits
from a segment that seeks value and
derives benefits from a source of features
or placement that is along another
dimension than that measured.
– Ex: Bentley Silver Spur @ $170,000 vs.
Porsche 911 GT2 @ $194,000
– Both priced relatively high, but for a sedan
seeking buyer, the Porsche is priced too
high as it fails to provide luxurious seating.
Meanwhile, for the performance seeking
buyer, the Bentley Silver Spur is priced to
high for the level of performance sought.
• In this case, it is suggested that the market
be segmented, and generate specific Price
to Benefits maps for the independent
market segments.
– i.e. luxury sedans as one segment and
luxury sports cars as another segment
© 2012 Cengage Learning. All Rights Reserved. May not be scanned, copied or duplicated, or posted to a publicly accessible website, in whole or in part.
Constructing Price to Benefits Maps
• Executive Approach
– Identify competing products and their features , benefits, and prices. Position them on
the price to value map according to management impressions of the valuation of
competing benefits
• Delphi Approach
– Use a defined or identified market transaction prices and independent expert
evaluations of “benefits”
• Consumer Research Approach
– Measure the level of perceived benefits and perceived price for a number of
products, as well as the variation in prices in which customers are indifferent
to changes.
– Plot the products according to the mean perceived price and mean perceive
benefits. Use the variation in prices to define ellipses of uncertainty about the
mean price and benefits for the products.
© 2012 Cengage Learning. All Rights Reserved. May not be scanned, copied or duplicated, or posted to a publicly accessible website, in whole or in part.
Dispersion in Perceived Price
• Within the market, a single product
may be sold at a number of different
prices, and the perceived price may at
times vary away from the actual
transaction price
– Varies between customers
• Hidden price vs. explicit price
statements
– Phone tariff structures of incumbent
vs. new entrant
• Usage rates and flat fees… price per
unit can vary
– Distribution Channel and Locations –
each gives variation in price.
– Promotional discounts
• Couponing and price promotions
• Can create challenges in cross channel
cannibalization.
• Perception mismatch
– Customer may place an expected price
on a product based upon the last time
they purchased that product, however
due to changes in economic situations,
the price will change over time.
Especially true during inflationary
times.
PerceivedPrice Perceived Benefits
Large
Dispersion in
Perceived
Price
© 2012 Cengage Learning. All Rights Reserved. May not be scanned, copied or duplicated, or posted to a publicly accessible website, in whole or in part.
Dispersion in Perceived Benefits
• Perception of benefits gained from utilizing a product varies among customers – orientation
of segmentation
– Most common error, to include to multiple and disparate market segments as one in making a Price
to Benefits map
• Poor marketing communication techniques
– Can be due to miscommunication of the benefits where some MarComm focuses on one set of
benefits while other MarComm focuses on another set of benefits, leaving the recipients of the
message confused as to the exact set of benefits or their value – Can be an area to “fix” within the
company
– Arises naturally when different segments pay attention to promotional activity differently. Some
segments are more responsive to marketing communication than others, driving a dispersion in
perceived benefits (McDonalds Healthy Choices)
• Common also in experience and credence goods,
– the benefits of the product can only be poorly perceived prior to purchase, if they are ever observed
(credence goods)
– customers with direct and recent exposure to the product are likely to have a more accurate reading
of the benefits than those with less exposure to the product
• Dispersion in risk tolerance affects benefits perception
– Risk aversion and aversion to change may cause many customers to discount the perceived benefits,
while other customers seek the benefits precisely because they bring about change
– Also seen in business markets, where executive management seeks change and improvement while
mid-level management seeks stability and steady career improvement
© 2012 Cengage Learning. All Rights Reserved. May not be scanned, copied or duplicated, or posted to a publicly accessible website, in whole or in part.
Dispersion in Perceived Benefits
PerceivedPrice
Perceived Benefits
Large
Dispersion in
Perceived
Benefits
© 2012 Cengage Learning. All Rights Reserved. May not be scanned, copied or duplicated, or posted to a publicly accessible website, in whole or in part.
Benefit Sources
• Functional benefits
– physical nature or performance characteristics of the product
– Examples: Cars, jewel clarity and size, square footage &
neighborhood,
• Process benefits
– lowering transactional costs
– quicker, safer, easier, reduced search costs, etc
• Relationship benefits
– accrue to the customer from a mutually beneficial relationship
with the seller
– emotional connection to the brand or sales representative,
loyalty rewards, information provisions, - lower search costs or
design costs.
© 2012 Cengage Learning. All Rights Reserved. May not be scanned, copied or duplicated, or posted to a publicly accessible website, in whole or in part.
Market Confusion
Simultaneous Dispersion in Perceived Price and Benefits
PerceivedPrice
Perceived Benefits
Large Dispersion in Perceived
Benefits and Price
Leading to poor purchases, and
ultimately brand betrayal or lost
opportunities
© 2012 Cengage Learning. All Rights Reserved. May not be scanned, copied or duplicated, or posted to a publicly accessible website, in whole or in part.
New Product Positioning or
Repositioning
• Key Pricing issue in Product Launch/Repositioning is where
on the Price to Benefits map should the product fit?
– Where is the customer addressable horizon?
• Customers from a higher price / higher benefit region?
• Customers from a lower price / lower benefits region?
– Where are the adjacencies from which the new product will
take market share or grow the market?
– What is the likely response of the nearest competitor?
– Is the new position defensible?
• Choices:
• Value Equivalence
• Value Advantaged
• Value Disadvantaged
– For Each, why would you take one stance vs. another?
© 2012 Cengage Learning. All Rights Reserved. May not be scanned, copied or duplicated, or posted to a publicly accessible website, in whole or in part.
Price Neutral
• Pricing along the Zone of
indifference
• Occurs when there is a opening in
the Price to Benefits map that is
currently un-served
– From whom will you see a
response, those closest to you in
the Price to Benefits map.
• Somewhat unlikely to have a
strong competitive response
• Will capture profits in proportion
to benefits
• Safest from a pricing perspective.
Puts pressure on other marketing
levers, distribution and promotion,
in driving volume
PerceivedPrice
Perceived Benefits
New
Product
© 2012 Cengage Learning. All Rights Reserved. May not be scanned, copied or duplicated, or posted to a publicly accessible website, in whole or in part.
Penetration Pricing
• Pricing at a low level compared to level
of benefits offered
• Using price as a means to gain market
share
• Can come from increasing the level of
benefits of a product, but leaving the
price unchanged, thus driving the
product into the value advantaged zone
• Easy from a promotion perspective, but
can be deleterious for the firm
– Substantial loss of potential profit
– Can incur a negative competitive
response
• Potential competitive response
– Most likely direct response is a price
decrease by competitors,
– Less likely is a benefits increase, as
these take time through re-engineering
the product
– Show who is most affected.
PerceivedPrice
Perceived Benefits
New Product
Priced to
Penetrate the
Market
Likely
Competitive
Response is a
Price
Decrease
© 2012 Cengage Learning. All Rights Reserved. May not be scanned, copied or duplicated, or posted to a publicly accessible website, in whole or in part.
Skim Pricing
• Pricing high with respect to
competitors comparable price to
benefits offer
• Price in the value disadvantaged
zone
• Skim profits from early customers
with the expectation of lowering
prices later
• Perceived as a Safe move from a
competitive response perspective,
however
– Can be a pricing error in terms of
forgone profits from missing
volume target
– Provides insufficient motivation
for the market to purchase the
product at the higher price point,
given the alternatives
• Use only if offer taps into a metric
of benefits not foreseen by most
competitors
PerceivedPrice
Perceived Benefits
New Product
Priced to Skim
the Market
© 2012 Cengage Learning. All Rights Reserved. May not be scanned, copied or duplicated, or posted to a publicly accessible website, in whole or in part.
Summary
• Prices should reflect value
• On any pricing move, you will take share primarily from
other products that are near the new pricing position
on the price to value map
• Price Neutral Positioning posses the fewest
competitive threats
• Value Advantaged Positioning imposes a threat on
competitors
• Value Disadvantaged Positioning challenges the need
to capture customers
• Customer may be uncertain regarding your price
position. Communicate Clearly.
© 2012 Cengage Learning. All Rights Reserved. May not be scanned, copied or duplicated, or posted to a publicly accessible website, in whole or in part.

Chpt 04 price to value

  • 1.
    Tim J. Smith PricingStrategy: Setting Price Levels, Managing Price Discounts, & Establishing Price Structures PowerPoint by Tim J. Smith, PhD Managing Principal, Wiglaf Pricing Adjunct Professor of Marketing & Economics, DePaul University © 2012 Cengage Learning. All Rights Reserved. May not be scanned, copied or duplicated, or posted to a publicly accessible website, in whole or in part.
  • 2.
    Chapter 4 Price toValue Exploring the Strategic Framework Relating the Three Dominant Approaches to Price Setting © 2012 Cengage Learning. All Rights Reserved. May not be scanned, copied or duplicated, or posted to a publicly accessible website, in whole or in part.
  • 3.
    Agenda • What shouldwe expect to find when we identify products on the price versus value plane? • What does it mean to be priced to value? Value advantaged? Value disadvantaged? • Are penetration pricing and skim pricing the only pricing strategies for launching a new product? • When launching a new product, which competitors are most likely to be threatened? • Stretch Question: When considering the use of price versus value to capture market share, which approach is more defensible? © 2012 Cengage Learning. All Rights Reserved. May not be scanned, copied or duplicated, or posted to a publicly accessible website, in whole or in part.
  • 4.
    Price Variability inAutos • Large variation of prices for a similar good within the same category – Tata Nano $2500 – Chevrolet Malibu $28,000 – Bentley Flying Spur $170,000 – a factor of 68 between the lowest price production car and the highest price product auto • What justifies the price difference: Benefits • Benefits based pricing is a direct extension of the economics of pricing © 2012 Cengage Learning. All Rights Reserved. May not be scanned, copied or duplicated, or posted to a publicly accessible website, in whole or in part.
  • 5.
    Price to BenefitsMap • Price Boundary Theory – Identify relevant competing alternatives – Define the value differential – Pricing accordingly • The price to benefits map plots the position of products in terms of perceived products and perceived benefits…. – Visual representation of how customers perceive the value trade off. PerceivedPrice Perceived Benefits Tata Nano Lexus LS Chevrolet Malibu BMW 7 Series Bentley Flying Spur © 2012 Cengage Learning. All Rights Reserved. May not be scanned, copied or duplicated, or posted to a publicly accessible website, in whole or in part.
  • 6.
    EVM Model DeliversPrice to Value Stent Exchange Value Model Results 0 500 1000 1500 2000 2500 3000 3500 4000 Standard Stent Druge Eluting Stent Strent EvaluatedValue © 2012 Cengage Learning. All Rights Reserved. May not be scanned, copied or duplicated, or posted to a publicly accessible website, in whole or in part.
  • 7.
    Conjoint Delivers Priceto Value Mango Juice Conjoint Analysis Results $3.00 $3.50 $4.00 $4.50 $5.00 $5.50 $6.00 Mango Fruit Blend, Premium Niche Brand Mango Fruit Blend, National Brand Pure Mango, Premium Niche Brand Pure Mango, National Brand Product Features PerceivedValue © 2012 Cengage Learning. All Rights Reserved. May not be scanned, copied or duplicated, or posted to a publicly accessible website, in whole or in part.
  • 8.
    The Market ExpectsPrice to Value Exhaust Fan Prices (Grainger) $800 $900 $1,000 $1,100 $1,200 $1,300 $1,400 $1,500 $1,600 0 1000 2000 3000 4000 5000 6000 7000 Capacity (CFM) Price © 2012 Cengage Learning. All Rights Reserved. May not be scanned, copied or duplicated, or posted to a publicly accessible website, in whole or in part.
  • 9.
    Pricing Areas • ValueEquivalence Line – Where price increases proportional to benefits increases • Value Advantaged – Excess benefits beyond what is captured in price • Value Disadvantaged – Priced higher than what would be justified based on the measure of benefits alone PerceivedPrice Perceived Benefits Value Advantaged Value Disadvantaged Zone of Indifference Value Equivalence Line © 2012 Cengage Learning. All Rights Reserved. May not be scanned, copied or duplicated, or posted to a publicly accessible website, in whole or in part.
  • 10.
    Zone of Indifference •Around the value equivalence line is a zone of indifference – Small variations in price or benefits around the value equivalence line have non measureable effect on sales volume • Not all products will fall along the value equivalence line – Outside of this zone of indifference, lies the value advantaged zone and the value disadvantaged zone. – Products lying in the value advantaged or disadvantaged zones are either priced significantly lower or higher than the corresponding levels of benefits, as perceived by customers • Elasticity is a key ingredient for determining the width of this zone. • There is a range of pricing moves that will not impact purchasing behavior at all – Range of demand inelasticity, as the next nearest competitor is out of the comparison metric – Can be a source of a painless price increase, thus improving profitability © 2012 Cengage Learning. All Rights Reserved. May not be scanned, copied or duplicated, or posted to a publicly accessible website, in whole or in part.
  • 11.
    Variance in PriceElasticity • Big Number syndrome – large changes in price have non-linear effect on elasticity of demand – Zone of credibility • Below expectation price the offering has no credible value. • Above expectation price and customers do not believe it is possible to deliver that many benefits • Benefit Bracketed – Benefit Floor: Required minimal level of benefits – Benefit Ceiling : Exceeding a maximum level, maximum WTP for benefits … more horsepower in a car becomes unnecessary • Price Capped – Budget constraints – Price category spending constraints • Variance by segment – different customer segments have different price sensitivities • Variance with time – customer needs change over time, product lifecycle and expectation of growing benefits for same dollar • Variance by price communication method – daily, monthly, or annual payment schemes can affect price sensitivity • Variance by discounting method – off invoice discounts vs. on receipt discounts have different effects on perceived price • Creating demand vs. shifting shares – market growth by lowering price of item or is it just steeling a fixed share • Cross-product elasticity. – Switching between categories: cars vs. bicycles – As aluminum became cheaper, it displaced steel in beverage cans, later displaced itself by plastic – Paper or plastic bags © 2012 Cengage Learning. All Rights Reserved. May not be scanned, copied or duplicated, or posted to a publicly accessible website, in whole or in part.
  • 12.
    Value Advantaged • Attimes, companies will choose to price aggressively, thus providing more benefits than expected at a given price • Unharvested Value – Some authors refer to products priced in the value advantaged zone as suffering from “unharvested value” because the company has the opportunity with products that are “value advantaged” to raise the prices. – Consider it a pricing error – Ex: selling front row seats at the same price as lawn seats in a large amphitheatre • Market Share Taking – Customers perceive that more benefits are delivered at a given price through the value advantaged product, and rationally choose to select that product. – Warning: deliberately pricing products in the value advantaged zone is likely to instigate a competitive reaction, such as a potential price war, harming overall industry health • Hypercompetition – Certain product categories, technology driven sectors in particular, enjoy sequential improvements in product quality over time • Autos and gas mileage • DRAM decreases in costs per kb each time a new photolithography standard becomes available • LCD TV’s, computer processors, etc likewise enjoy such costs reductions over time – Aggressively pricing new technology that offers significant costs advantages over legacy technology is a common trait in certain markets. Forms the basis for the concept of Hypercompetion, – See D’Aveni © 2012 Cengage Learning. All Rights Reserved. May not be scanned, copied or duplicated, or posted to a publicly accessible website, in whole or in part.
  • 13.
    Value Disadvantaged • Atthe other end of the spectrum, companies will at times price a product high in comparison to the perceived benefits of that offering. • Missed Opportunities – Some authors refer to this as missed opportunities, as the firm could have sold a higher volume if their prices were more inline with expectation levels – Consider it too a pricing error – Ex: Unsold advertising space within a poplar magazine • Usually results in a loss of market share • Can be stable if the product does offer superior benefits along a dimension not measured – Can be used effectively to capture profits from a segment that seeks value and derives benefits from a source of features or placement that is along another dimension than that measured. – Ex: Bentley Silver Spur @ $170,000 vs. Porsche 911 GT2 @ $194,000 – Both priced relatively high, but for a sedan seeking buyer, the Porsche is priced too high as it fails to provide luxurious seating. Meanwhile, for the performance seeking buyer, the Bentley Silver Spur is priced to high for the level of performance sought. • In this case, it is suggested that the market be segmented, and generate specific Price to Benefits maps for the independent market segments. – i.e. luxury sedans as one segment and luxury sports cars as another segment © 2012 Cengage Learning. All Rights Reserved. May not be scanned, copied or duplicated, or posted to a publicly accessible website, in whole or in part.
  • 14.
    Constructing Price toBenefits Maps • Executive Approach – Identify competing products and their features , benefits, and prices. Position them on the price to value map according to management impressions of the valuation of competing benefits • Delphi Approach – Use a defined or identified market transaction prices and independent expert evaluations of “benefits” • Consumer Research Approach – Measure the level of perceived benefits and perceived price for a number of products, as well as the variation in prices in which customers are indifferent to changes. – Plot the products according to the mean perceived price and mean perceive benefits. Use the variation in prices to define ellipses of uncertainty about the mean price and benefits for the products. © 2012 Cengage Learning. All Rights Reserved. May not be scanned, copied or duplicated, or posted to a publicly accessible website, in whole or in part.
  • 15.
    Dispersion in PerceivedPrice • Within the market, a single product may be sold at a number of different prices, and the perceived price may at times vary away from the actual transaction price – Varies between customers • Hidden price vs. explicit price statements – Phone tariff structures of incumbent vs. new entrant • Usage rates and flat fees… price per unit can vary – Distribution Channel and Locations – each gives variation in price. – Promotional discounts • Couponing and price promotions • Can create challenges in cross channel cannibalization. • Perception mismatch – Customer may place an expected price on a product based upon the last time they purchased that product, however due to changes in economic situations, the price will change over time. Especially true during inflationary times. PerceivedPrice Perceived Benefits Large Dispersion in Perceived Price © 2012 Cengage Learning. All Rights Reserved. May not be scanned, copied or duplicated, or posted to a publicly accessible website, in whole or in part.
  • 16.
    Dispersion in PerceivedBenefits • Perception of benefits gained from utilizing a product varies among customers – orientation of segmentation – Most common error, to include to multiple and disparate market segments as one in making a Price to Benefits map • Poor marketing communication techniques – Can be due to miscommunication of the benefits where some MarComm focuses on one set of benefits while other MarComm focuses on another set of benefits, leaving the recipients of the message confused as to the exact set of benefits or their value – Can be an area to “fix” within the company – Arises naturally when different segments pay attention to promotional activity differently. Some segments are more responsive to marketing communication than others, driving a dispersion in perceived benefits (McDonalds Healthy Choices) • Common also in experience and credence goods, – the benefits of the product can only be poorly perceived prior to purchase, if they are ever observed (credence goods) – customers with direct and recent exposure to the product are likely to have a more accurate reading of the benefits than those with less exposure to the product • Dispersion in risk tolerance affects benefits perception – Risk aversion and aversion to change may cause many customers to discount the perceived benefits, while other customers seek the benefits precisely because they bring about change – Also seen in business markets, where executive management seeks change and improvement while mid-level management seeks stability and steady career improvement © 2012 Cengage Learning. All Rights Reserved. May not be scanned, copied or duplicated, or posted to a publicly accessible website, in whole or in part.
  • 17.
    Dispersion in PerceivedBenefits PerceivedPrice Perceived Benefits Large Dispersion in Perceived Benefits © 2012 Cengage Learning. All Rights Reserved. May not be scanned, copied or duplicated, or posted to a publicly accessible website, in whole or in part.
  • 18.
    Benefit Sources • Functionalbenefits – physical nature or performance characteristics of the product – Examples: Cars, jewel clarity and size, square footage & neighborhood, • Process benefits – lowering transactional costs – quicker, safer, easier, reduced search costs, etc • Relationship benefits – accrue to the customer from a mutually beneficial relationship with the seller – emotional connection to the brand or sales representative, loyalty rewards, information provisions, - lower search costs or design costs. © 2012 Cengage Learning. All Rights Reserved. May not be scanned, copied or duplicated, or posted to a publicly accessible website, in whole or in part.
  • 19.
    Market Confusion Simultaneous Dispersionin Perceived Price and Benefits PerceivedPrice Perceived Benefits Large Dispersion in Perceived Benefits and Price Leading to poor purchases, and ultimately brand betrayal or lost opportunities © 2012 Cengage Learning. All Rights Reserved. May not be scanned, copied or duplicated, or posted to a publicly accessible website, in whole or in part.
  • 20.
    New Product Positioningor Repositioning • Key Pricing issue in Product Launch/Repositioning is where on the Price to Benefits map should the product fit? – Where is the customer addressable horizon? • Customers from a higher price / higher benefit region? • Customers from a lower price / lower benefits region? – Where are the adjacencies from which the new product will take market share or grow the market? – What is the likely response of the nearest competitor? – Is the new position defensible? • Choices: • Value Equivalence • Value Advantaged • Value Disadvantaged – For Each, why would you take one stance vs. another? © 2012 Cengage Learning. All Rights Reserved. May not be scanned, copied or duplicated, or posted to a publicly accessible website, in whole or in part.
  • 21.
    Price Neutral • Pricingalong the Zone of indifference • Occurs when there is a opening in the Price to Benefits map that is currently un-served – From whom will you see a response, those closest to you in the Price to Benefits map. • Somewhat unlikely to have a strong competitive response • Will capture profits in proportion to benefits • Safest from a pricing perspective. Puts pressure on other marketing levers, distribution and promotion, in driving volume PerceivedPrice Perceived Benefits New Product © 2012 Cengage Learning. All Rights Reserved. May not be scanned, copied or duplicated, or posted to a publicly accessible website, in whole or in part.
  • 22.
    Penetration Pricing • Pricingat a low level compared to level of benefits offered • Using price as a means to gain market share • Can come from increasing the level of benefits of a product, but leaving the price unchanged, thus driving the product into the value advantaged zone • Easy from a promotion perspective, but can be deleterious for the firm – Substantial loss of potential profit – Can incur a negative competitive response • Potential competitive response – Most likely direct response is a price decrease by competitors, – Less likely is a benefits increase, as these take time through re-engineering the product – Show who is most affected. PerceivedPrice Perceived Benefits New Product Priced to Penetrate the Market Likely Competitive Response is a Price Decrease © 2012 Cengage Learning. All Rights Reserved. May not be scanned, copied or duplicated, or posted to a publicly accessible website, in whole or in part.
  • 23.
    Skim Pricing • Pricinghigh with respect to competitors comparable price to benefits offer • Price in the value disadvantaged zone • Skim profits from early customers with the expectation of lowering prices later • Perceived as a Safe move from a competitive response perspective, however – Can be a pricing error in terms of forgone profits from missing volume target – Provides insufficient motivation for the market to purchase the product at the higher price point, given the alternatives • Use only if offer taps into a metric of benefits not foreseen by most competitors PerceivedPrice Perceived Benefits New Product Priced to Skim the Market © 2012 Cengage Learning. All Rights Reserved. May not be scanned, copied or duplicated, or posted to a publicly accessible website, in whole or in part.
  • 24.
    Summary • Prices shouldreflect value • On any pricing move, you will take share primarily from other products that are near the new pricing position on the price to value map • Price Neutral Positioning posses the fewest competitive threats • Value Advantaged Positioning imposes a threat on competitors • Value Disadvantaged Positioning challenges the need to capture customers • Customer may be uncertain regarding your price position. Communicate Clearly. © 2012 Cengage Learning. All Rights Reserved. May not be scanned, copied or duplicated, or posted to a publicly accessible website, in whole or in part.