Download to read offline


![9 © Experian
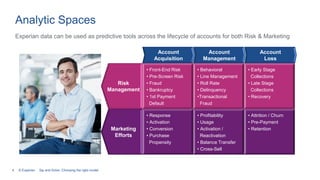
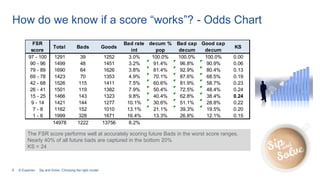
Financial Stability Risk validation
maximizing profit
Maximum net profit of $2,988,655 is at FSR of 9+
This is $390k over the total population ($2,988,655 - $2,598,563)
For one year of applicants, the net profit gain is $1,170,000
[$390k * 3]
Profit can be further increased by assessing deposits for those
applicants scoring below 9
FSR
score
Total Bads Goods
Bad rate
int
decum %
pop
97 - 100 1291 39 1252 3.0% 100.0%
90 - 96 1499 48 1451 3.2% 91.4%
79 - 89 1690 64 1626 3.8% 81.4%
69 - 78 1423 70 1353 4.9% 70.1%
42 - 68 1526 115 1411 7.5% 60.6%
26 - 41 1501 119 1382 7.9% 50.4%
15 - 25 1466 143 1323 9.8% 40.4%
9 - 14 1421 144 1277 10.1% 30.6%
7 - 8 1162 152 1010 13.1% 21.1%
1 - 6 1999 328 1671 16.4% 13.3%
14978 1222 13756 8.2%
profit margin on goods 15%
co rate 20%
Total good
balance
Total bad
balance
CO balance
Annual
profit est
Est loss
Net profit
cum.
3,174,489$ 148,235$ 10,025$ 493,962$ 39,672$ 454,290$
3,892,563$ 237,564$ 38,541$ 612,392$ 86,054$ 980,628$
4,005,358$ 241,308$ 40,530$ 629,761$ 88,792$ 1,521,597$
4,812,652$ 342,173$ 48,532$ 762,959$ 116,967$ 2,167,589$
3,491,868$ 1,018,134$ 142,930$ 645,956$ 346,557$ 2,466,988$
3,402,776$ 1,267,648$ 212,735$ 662,534$ 466,265$ 2,663,258$
3,307,563$ 1,110,626$ 178,008$ 629,410$ 400,133$ 2,892,534$
2,885,293$ 1,526,637$ 214,542$ 615,990$ 519,869$ 2,988,655$
2,322,419$ 1,790,791$ 233,032$ 563,258$ 591,190$ 2,960,723$
4,171,432$ 4,451,173$ 631,781$ 1,159,856$ 1,522,016$ 2,598,563$
35,466,413$ 12,134,289$ 1,750,656$ 6,776,077$
Sip and Solve: Choosing the right model](https://image.slidesharecdn.com/sip-and-solve-ep-10-choosing-the-right-model-191002191238/85/Choosing-The-Right-Credit-Decisioning-Model-9-320.jpg)


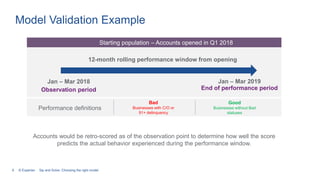
This document discusses different types of models used to predict customer behavior and make business decisions. Generic models use broad customer data to predict outcomes, while custom models are tailored to a specific company's portfolio. The document compares the two approaches and provides an example of validating a custom model's ability to accurately predict which accounts will become delinquent. It also demonstrates how a model can be used to maximize profits by adjusting credit limits or requiring deposits based on risk scores.


