SlideShare a Scribd company logo
Economic Region
Calgary Single Family
Calgary Apt. Condo
Calgary Attached
2015
Economic Region
Calgary Single Family
Calgary Apt. Condo
Calgary Attached
As of September, year to date, Apartment Condos and Attached homes show the largest increase in Active listings. The decrease in year over
year average sale price in September for Single Family and Apartment Condos were down nearly 10% year or year. The lower amount of
higher priced sales of Single Family homes has caused a dip in the Average Price and high supply has affected Apartment Condos.
The Average single family home sale price continued the downward trend dropping below $525,000 in September pulling the yearly average
down further. The decrease in sales of higher priced homes and especially those over $1 million is having a negative impact on the average
sale price.
-4.85%
3,830 -25.24% 6,854 -2.42% 55.97% -22.93% 1,327 53.81% 397,210$ -2.13%
2,791 -31.66% 5,904 -5.58% 48.06% -26.05% 1,354 37.20% 303,677$
-1.58%
AVERAGE Y/Y% AVERAGE Y/Y%
10,980 -23.40% 19,236 -8.64% 57.01% -15.88% 3,718 24.44% 542,621$ -2.92%
18,948 -25.12% 34,625 -10.18% 54.74% -16.13% 7,196 18.89% 470,991$
from January 1st , 2015 to the last day of September, 2015
TOTAL Y/Y% TOTAL Y/Y% AVERAGE Y/Y%
Real Estate and Economic Report
Sales New Listings
Sales to New
Listings Ratio
Active Listings Average Price
-32.05% 3,790 -13.41% 47.55% -21.53%
1,059 -26.97% 2,107 -4.40% 50.26% -23.60%
TOTAL Y/Y% TOTAL Y/Y% AVERAGE Y/Y%
3,941 16.08% 524,276$ -9.56%
274 -39.38% 690 -3.36% 39.71% -37.27% 1,358 18.81% 292,086$
AVERAGE
7,550 -2.45% 460,611$ -3.80%1,802
-9.64%
from the 1st of September, 2015 to the last day of September, 2015
- Calgary Real Estate Market -
REPORTING PERIOD:
September saw an increase in the number of Active and New Listings in the market while at the same time sales dropped slightly. A
continuance of this trend will have a further negative impact on home prices.
744 -1.46% 43.95% -40.64% 1,432 43.06%327 -41.50%
Y/Y% AVERAGE Y/Y%
392,064$ -1.51%
YEAR TO DATE (2015):
$459,035 $465,202 $479,880
$517,333
$558,738 $542,621
$250,000
$350,000
$450,000
$550,000
$650,000
2010 2011 2012 2013 2014 2015 YTD
Single Family Home Annual Average Price (Calgary)
0
1000
2000
3000
4000
5000
6000
7000
8000
9000
10000
Single Family Home Comparisons (Calgary)
Sales (Total) New Listings (Total) Active Listings (Avg.)
Total Residential
Single Family
Apartment Condo
Duplex Row House
2015
Total Residential
Single Family
Apartment Condo
Duplex/Row House
The spread between new listings and total sales continued to increase in Setpember. Duplex/Row Houses saw a 64% increase in new listings
for September year over year and 355 year to date. Yet, despite these trends, Duplex/Row Houses have managed to show the highest
increase in average sale price year over year to date.
1,146 3.43% 2,080 35.42% 55.22% -23.42% 357,620$ 4.12%
8,003 -11.37% 15,616 13.50% 50.33% -22.30% 437,841$ 1.49%
3,782 -14.88% 8,174 17.92% 45.78% -28.10% 252,902$ 1.52%
YEAR TO DATE (2015): from January 1st, 2015 to the last day of September, 2015
AVERAGE Y/Y%
13,178 -10.54% 26,501 15.83% 48.83% -23.96%
TOTAL Y/Y%
372,034$ 1.99%
TOTAL Y/Y% AVERAGE Y/Y%
411 -15.43% 773 24.48% 53.00% -32.05% 252,953$ 0.58%
143 9.16% 272 63.86% 53.00% -32.91% 364,203$ 4.28%
-0.75%
873 -14.41% 1,660 24.34% 53.00% -30.26% 432,150$ 1.48%
1,462 -12.14% 2,777 26.75% 52.65% -30.68% 368,874$
TOTAL Y/Y% TOTAL Y/Y% AVERAGE Y/Y% AVERAGE
REPORTING PERIOD: from the 1st of September, 2015 to the last day of September, 2015
Sales New Listings
Y/Y%
Sales to New
Listings Ratio
Average Price
- Edmonton Real Estate Market -
The days on market are managing to remain steady around 40 days on market for single family homes. Good properties priced appropriately
continue to sell quickly. Days on market are much higher in the SE(40), SW(38) compared to NW(36) & NE(31).
September saw a large drop in sales for property priced between $200,000 and $449,000. This is the second consecutive month we have
seen this. This is reflective of the large drop in year over year sales of Apartment Condominiums and Attached homes which tend to make up
the majority of this price range. Sales of homes over $1 million also dropped off significantly.
20
25
30
35
40
45
50
Single Family Home Average Days on Market (Calgary)
0
50
100
150
200
250
300
350
> $100 $100 -
$199
$200 -
$299
$300 -$
349
$350 -
$399
$400 -
$449
$450 -
$499
$500 -
$549
$550 -
$599
$600 -
$649
$650 -
$699
$700 -
$799
$800 -
$899
$900 -
$999
$1M +
Sept. 2014
Sept. 2015
Number of Sales by Price Range (Calgary Metro)
Following a drop in average days on market from 58 to 44 between January to March 2015 we have now seen a steady increase since then
with a slight dip in September to 53 from August's 54 average days on market.
Sales remained steady in September as New Listings dropped slightly. A welcome change from August and a similar trend of previous years
allowing the Average Sale Price to still be up a modest 1.99% over September of last year.
Since 2011 the average home price in Edmonton has increased an average of just over 4% per year since 2011 with a high of 5.4% between
2013 and 2014. Increases in 2015 have now flattened out compared to the more vigorous start to the year.
The Calgary Home Price index has been in mostly a downward trend since July 2014 where as the Edmonton home Price Index continued to
increase until its recent decline in July. The Calgary index has been fluctuating up and down since April 2015. Since 2005 the TSX100 only
increased 50% compared to the 110% for Calgary and the 80% for Edmonton showing that real estate continues to be a strong investment.
$383,226 $379,485
$392,446
$409,438
$431,812
$437,841
$340,000
$360,000
$380,000
$400,000
$420,000
$440,000
$460,000
2010 2011 2012 2013 2014 2015 YTD
Single Family Home Annual Average Price (Edmonton)
1,264
1,136
941
854
773
782
623
419
528
648
923
1,022
1,179
1,198
1,125
983
857
863
673
436
485
747
917
1,147
1,213
1,324
1,158
1,019
1,020
850
717
439
390
547
876
1,001
1,078
1,243
1,111
884
873
1,943
1,627
1,455
1,380
1,266
1,082
769
409
955
1,115
1,467
1,569
1,911
1,586
1,491
1,349
1,268
1,059
783
415
1,070
1,082
1,585
1,818
2,085
1,829
1,601
1,354
1,335
1,256
794
534
1,298
1,428
1,883
1,964
1,974
1,886
1,782
1,741
1,660
0
500
1,000
1,500
2,000
2,500
Single Family Home Comparisons (Edmonton)
Sales (Total) New Listings (Total)
0
10
20
30
40
50
60
Average Days on Market (Edmonton Metro)
100
125
150
175
200
Calgary Home Price Index
Edmonton Home Price Index
Home Price Index Comparison
Alberta
Canada
Unemployment Rate
Jul-15
Retail Trade (mill. $'s)
Jul-15
Total Mortgages
Jun-15
The number of total
mortgages in Alberta
Weekly Earnings
Jul-15
0.8% (F Mar/15) - 0.7(F Oct/15)
0.50% 1.2%(F Sep/15)
Q2 Q4
TOTAL
$955.02
1.41%
0.69%
27.69%
11,472 1.83%
Jul-15
Net Migration to AB
36.95 -21.55%
2014
2014
ATB (F)Alberta 2015
Canada 2015 RBC (F)2.40%
4.40%
in Alberta
in Alberta 6.50%
Mortgages 90 day
Arrears July 15
in Canada
in Canada
571065
4668787
-3.68%in Alberta 6.392
in Canada 43.345
7.10% 11.27%
1.78%
Housing starts (000's)
Sep-15
-1.53%
in Canada
12,542 -4.62%
1.67%
1,541
$1,120.84
-11.18%in Alberta
in Alberta
in Canada
Real GDP Growth Annual Rate
Y/Y%
*the following information is based on current available data from: http://economicdashboard.albertacanada.com/, www.statcan.gc.ca/dai-quo/ and RBC Economic
Outlook,http://www.cba.ca/en/component/content/publication/69-statistics, http://www.atb.com/SiteCollectionDocuments
Real GDP Growth
TOTAL Y/Y%
- Alberta Economic Indicators -
The ratio of the total number of mortgages to 90 day arrears has decreased in Canada and flattened out in Alberta after a slight increase in
May 2015. The overall number of mortgages in Alberta and Canada continues to increase.
With the cutback of overtime hours in the energy sector as well as restructuring of salaries we are seeing the impact to the average weekly
earnings in Alberta, which is not far from where it was in 2013. Canada is still well below the Alberta average.
$990.98 $1,034.17 $1,070.47 $1,107.97 $1,149.18 $1,120.84
$868.07 $883.91 $908.37 $930.28 $948.40 $955.02
$0
$500
$1,000
$1,500
2010 2011 2012 2013 2014 2015 YTD
Average Weekly Earnings Alberta's Average Weekly Earnings Canada's Average Weekly Earnings
0.20%
0.23%
0.25%
0.28%
0.30%
0.33%
0.35%
0.38%
0.40%
2014-05
2014-06
2014-07
2014-08
2014-09
2014-10
2014-11
2014-12
2015-01
2015-02
2015-03
2015-04
2015-05
2015-06
2015-07
M
o
r
t
g
a
g
e
s
% of Arrears to Total Number of
Mortgages AB
% of Arrears to Total Number of
Mortgages CA
Mortgage Arrears Ratio; Canada vs Alberta
Notes:
Bank of Canada
Resources
http://www.rbc.com/e
http://www.bankofcan
http://economicdashboard.albertacanada.com/
http://www.creb.com/
http://www.ereb.com/REALTORSAssociationOfEdmonton.html
http://www.capp.ca/Pages/default.aspx
http://homepriceindex.ca/hpi_tool_en.html
http://www.cba.ca/en/component/content/publication/69-statistics
http://www.finance.alberta.ca/aboutalberta/
http://www.statcan.gc.ca/dai-quo/
http://www.housepriceindex.ca/default.aspx?langue=EN
On Wednesday, 21 October 2015, the Bank of Canada will announce its decision on the target for the overnight rate. A press release will
provide a brief explanation of the decision.The Bank will also publish its quarterly Monetary Policy Report (MPR) at the same time as the rate
decision.
August was a very difficult month for both the WTI and the WCS and we also saw a significant increase in the price differential. Prices for
both WTI and WCS have recovered some since this dip and the differential has narrowed. The amount of oil being produced and shipped in
the Province continues to increase.
$-
$10.00
$20.00
$30.00
$40.00
$50.00
$60.00
$70.00
$80.00
$90.00
$100.00
$110.00
$120.00
WCS OIL PRICES
WTI OIL PRICES
WTI-WCS Price Differential
WTI and WCS Pricing and Price Differential (US$)

More Related Content

What's hot

Fraser Valley Real Estate Board Statistics Package Jan 2021
Fraser Valley Real Estate Board Statistics Package Jan 2021Fraser Valley Real Estate Board Statistics Package Jan 2021
Fraser Valley Real Estate Board Statistics Package Jan 2021
Vicky Aulakh
 
Fvreb oct stats package 2019
Fvreb oct stats package 2019 Fvreb oct stats package 2019
Fvreb oct stats package 2019
Vicky Aulakh
 
San Francisco Market Focus May 2016
San Francisco Market Focus May 2016San Francisco Market Focus May 2016
San Francisco Market Focus May 2016
Ronny Budiutama
 
July 2015 Home Sales Report
July 2015 Home Sales ReportJuly 2015 Home Sales Report
July 2015 Home Sales Report
Phil Sveum
 
Dec 2020 Fraser Valley Real Estate Board Package
Dec 2020 Fraser Valley Real Estate Board PackageDec 2020 Fraser Valley Real Estate Board Package
Dec 2020 Fraser Valley Real Estate Board Package
Vicky Aulakh
 
Fvreb may 2020 stats
Fvreb may 2020 stats Fvreb may 2020 stats
Fvreb may 2020 stats
Vicky Aulakh
 
FVREB July 2020 Stats
FVREB July 2020 StatsFVREB July 2020 Stats
FVREB July 2020 Stats
Vicky Aulakh
 
San Francisco Market Focus May 2014
San Francisco Market Focus May 2014San Francisco Market Focus May 2014
San Francisco Market Focus May 2014
Ronny Budiutama
 
July fvreb stats package
July fvreb stats packageJuly fvreb stats package
July fvreb stats package
Vicky Aulakh
 
Nov 2019 fvreb stats package
Nov 2019 fvreb stats packageNov 2019 fvreb stats package
Nov 2019 fvreb stats package
Vicky Aulakh
 
Fvreb aug 2019 stats package
Fvreb aug 2019 stats packageFvreb aug 2019 stats package
Fvreb aug 2019 stats package
Vicky Aulakh
 
Fraser Valley Real Estate Board August 2021 Statistics
Fraser Valley Real Estate Board August 2021 Statistics Fraser Valley Real Estate Board August 2021 Statistics
Fraser Valley Real Estate Board August 2021 Statistics
Vicky Aulakh
 
Fvreb August 2020 Stats Package
Fvreb August 2020 Stats PackageFvreb August 2020 Stats Package
Fvreb August 2020 Stats Package
Vicky Aulakh
 
Fvreb Sept 2020 Stats
Fvreb Sept 2020 StatsFvreb Sept 2020 Stats
Fvreb Sept 2020 Stats
Vicky Aulakh
 
San Francisco Market Focus July 2015
San Francisco Market Focus July 2015San Francisco Market Focus July 2015
San Francisco Market Focus July 2015
Ronny Budiutama
 
San Francisco Market Data October 2020
San Francisco Market Data October 2020San Francisco Market Data October 2020
San Francisco Market Data October 2020
Ronny Budiutama
 
San Francisco Market Focus August 2013
San Francisco Market Focus August 2013San Francisco Market Focus August 2013
San Francisco Market Focus August 2013
Ronny Budiutama
 
2014 Market Forecast - California Association of Realtors
2014 Market Forecast - California Association of Realtors2014 Market Forecast - California Association of Realtors
2014 Market Forecast - California Association of Realtors
Ronny Budiutama
 
Fraser Valley Real Estate Board Stats Package Feb 2021
Fraser Valley Real Estate Board Stats Package Feb 2021Fraser Valley Real Estate Board Stats Package Feb 2021
Fraser Valley Real Estate Board Stats Package Feb 2021
Vicky Aulakh
 

What's hot (19)

Fraser Valley Real Estate Board Statistics Package Jan 2021
Fraser Valley Real Estate Board Statistics Package Jan 2021Fraser Valley Real Estate Board Statistics Package Jan 2021
Fraser Valley Real Estate Board Statistics Package Jan 2021
 
Fvreb oct stats package 2019
Fvreb oct stats package 2019 Fvreb oct stats package 2019
Fvreb oct stats package 2019
 
San Francisco Market Focus May 2016
San Francisco Market Focus May 2016San Francisco Market Focus May 2016
San Francisco Market Focus May 2016
 
July 2015 Home Sales Report
July 2015 Home Sales ReportJuly 2015 Home Sales Report
July 2015 Home Sales Report
 
Dec 2020 Fraser Valley Real Estate Board Package
Dec 2020 Fraser Valley Real Estate Board PackageDec 2020 Fraser Valley Real Estate Board Package
Dec 2020 Fraser Valley Real Estate Board Package
 
Fvreb may 2020 stats
Fvreb may 2020 stats Fvreb may 2020 stats
Fvreb may 2020 stats
 
FVREB July 2020 Stats
FVREB July 2020 StatsFVREB July 2020 Stats
FVREB July 2020 Stats
 
San Francisco Market Focus May 2014
San Francisco Market Focus May 2014San Francisco Market Focus May 2014
San Francisco Market Focus May 2014
 
July fvreb stats package
July fvreb stats packageJuly fvreb stats package
July fvreb stats package
 
Nov 2019 fvreb stats package
Nov 2019 fvreb stats packageNov 2019 fvreb stats package
Nov 2019 fvreb stats package
 
Fvreb aug 2019 stats package
Fvreb aug 2019 stats packageFvreb aug 2019 stats package
Fvreb aug 2019 stats package
 
Fraser Valley Real Estate Board August 2021 Statistics
Fraser Valley Real Estate Board August 2021 Statistics Fraser Valley Real Estate Board August 2021 Statistics
Fraser Valley Real Estate Board August 2021 Statistics
 
Fvreb August 2020 Stats Package
Fvreb August 2020 Stats PackageFvreb August 2020 Stats Package
Fvreb August 2020 Stats Package
 
Fvreb Sept 2020 Stats
Fvreb Sept 2020 StatsFvreb Sept 2020 Stats
Fvreb Sept 2020 Stats
 
San Francisco Market Focus July 2015
San Francisco Market Focus July 2015San Francisco Market Focus July 2015
San Francisco Market Focus July 2015
 
San Francisco Market Data October 2020
San Francisco Market Data October 2020San Francisco Market Data October 2020
San Francisco Market Data October 2020
 
San Francisco Market Focus August 2013
San Francisco Market Focus August 2013San Francisco Market Focus August 2013
San Francisco Market Focus August 2013
 
2014 Market Forecast - California Association of Realtors
2014 Market Forecast - California Association of Realtors2014 Market Forecast - California Association of Realtors
2014 Market Forecast - California Association of Realtors
 
Fraser Valley Real Estate Board Stats Package Feb 2021
Fraser Valley Real Estate Board Stats Package Feb 2021Fraser Valley Real Estate Board Stats Package Feb 2021
Fraser Valley Real Estate Board Stats Package Feb 2021
 

Viewers also liked

Sobre la muerte de julio garcía luis, dirigente de upec
Sobre la muerte de julio garcía luis, dirigente de upecSobre la muerte de julio garcía luis, dirigente de upec
Experiencia de la KFW en el Perú y en Apurímac
Experiencia de la KFW en el Perú y en ApurímacExperiencia de la KFW en el Perú y en Apurímac
Experiencia de la KFW en el Perú y en Apurímac
Henry Fernando Quispe Amezquita
 
Codigo genetico
Codigo geneticoCodigo genetico
Codigo genetico
Maricruz
 
Pt103
Pt103Pt103
Pt103
1703112010
 
Don’t plagiarize2
Don’t plagiarize2Don’t plagiarize2
Don’t plagiarize2
gbergreen
 
Maximizing the value of your ERP - London
Maximizing the value of your ERP - LondonMaximizing the value of your ERP - London
Maximizing the value of your ERP - London
SAP Ariba
 
TAD Summit 2016 - The Mobile World Up Side Down
TAD Summit 2016 - The Mobile World Up Side DownTAD Summit 2016 - The Mobile World Up Side Down
TAD Summit 2016 - The Mobile World Up Side Down
Daniel-Constantin Mierla
 
Af pdf-coleccionable-duravia-iii
Af pdf-coleccionable-duravia-iiiAf pdf-coleccionable-duravia-iii
Af pdf-coleccionable-duravia-iii
1703112010
 
Präsens Indikativ
Präsens IndikativPräsens Indikativ
Präsens IndikativSchool
 
Calvert Home Mortgage's Real Estate and Economic Report for Sept 2015
Calvert Home Mortgage's Real Estate and Economic Report for Sept 2015Calvert Home Mortgage's Real Estate and Economic Report for Sept 2015
Calvert Home Mortgage's Real Estate and Economic Report for Sept 2015
Jesse Bobrowski
 
Imperfekt for wiki
Imperfekt for wikiImperfekt for wiki
Imperfekt for wikibelindaflint
 
Learning of Php and My SQL Tutorial | For Beginners
Learning of Php and My SQL Tutorial | For BeginnersLearning of Php and My SQL Tutorial | For Beginners
Learning of Php and My SQL Tutorial | For Beginners
Ratnesh Pandey
 
FOSDEM 2017 - RTC Services With Lua and Kamailio
FOSDEM 2017 - RTC Services With Lua and KamailioFOSDEM 2017 - RTC Services With Lua and Kamailio
FOSDEM 2017 - RTC Services With Lua and Kamailio
Daniel-Constantin Mierla
 
Sample motion for consolidation in unlawful detainer (eviction) in California
Sample motion for consolidation in unlawful detainer (eviction) in California Sample motion for consolidation in unlawful detainer (eviction) in California
Sample motion for consolidation in unlawful detainer (eviction) in California
LegalDocsPro
 
Proyecto Adoquines: Aspectos Técnicos
Proyecto Adoquines:  Aspectos TécnicosProyecto Adoquines:  Aspectos Técnicos
Proyecto Adoquines: Aspectos Técnicos
mescoopal
 
Partes del cuerpo humano
Partes del cuerpo humanoPartes del cuerpo humano
Partes del cuerpo humano
Belhernandez
 

Viewers also liked (16)

Sobre la muerte de julio garcía luis, dirigente de upec
Sobre la muerte de julio garcía luis, dirigente de upecSobre la muerte de julio garcía luis, dirigente de upec
Sobre la muerte de julio garcía luis, dirigente de upec
 
Experiencia de la KFW en el Perú y en Apurímac
Experiencia de la KFW en el Perú y en ApurímacExperiencia de la KFW en el Perú y en Apurímac
Experiencia de la KFW en el Perú y en Apurímac
 
Codigo genetico
Codigo geneticoCodigo genetico
Codigo genetico
 
Pt103
Pt103Pt103
Pt103
 
Don’t plagiarize2
Don’t plagiarize2Don’t plagiarize2
Don’t plagiarize2
 
Maximizing the value of your ERP - London
Maximizing the value of your ERP - LondonMaximizing the value of your ERP - London
Maximizing the value of your ERP - London
 
TAD Summit 2016 - The Mobile World Up Side Down
TAD Summit 2016 - The Mobile World Up Side DownTAD Summit 2016 - The Mobile World Up Side Down
TAD Summit 2016 - The Mobile World Up Side Down
 
Af pdf-coleccionable-duravia-iii
Af pdf-coleccionable-duravia-iiiAf pdf-coleccionable-duravia-iii
Af pdf-coleccionable-duravia-iii
 
Präsens Indikativ
Präsens IndikativPräsens Indikativ
Präsens Indikativ
 
Calvert Home Mortgage's Real Estate and Economic Report for Sept 2015
Calvert Home Mortgage's Real Estate and Economic Report for Sept 2015Calvert Home Mortgage's Real Estate and Economic Report for Sept 2015
Calvert Home Mortgage's Real Estate and Economic Report for Sept 2015
 
Imperfekt for wiki
Imperfekt for wikiImperfekt for wiki
Imperfekt for wiki
 
Learning of Php and My SQL Tutorial | For Beginners
Learning of Php and My SQL Tutorial | For BeginnersLearning of Php and My SQL Tutorial | For Beginners
Learning of Php and My SQL Tutorial | For Beginners
 
FOSDEM 2017 - RTC Services With Lua and Kamailio
FOSDEM 2017 - RTC Services With Lua and KamailioFOSDEM 2017 - RTC Services With Lua and Kamailio
FOSDEM 2017 - RTC Services With Lua and Kamailio
 
Sample motion for consolidation in unlawful detainer (eviction) in California
Sample motion for consolidation in unlawful detainer (eviction) in California Sample motion for consolidation in unlawful detainer (eviction) in California
Sample motion for consolidation in unlawful detainer (eviction) in California
 
Proyecto Adoquines: Aspectos Técnicos
Proyecto Adoquines:  Aspectos TécnicosProyecto Adoquines:  Aspectos Técnicos
Proyecto Adoquines: Aspectos Técnicos
 
Partes del cuerpo humano
Partes del cuerpo humanoPartes del cuerpo humano
Partes del cuerpo humano
 

Similar to Calvert Home Mortgage Economic Report for October 2015

Calvert Home Mortgage Real Estate and Economic Report for September 2015
Calvert Home Mortgage Real Estate and Economic Report for September 2015Calvert Home Mortgage Real Estate and Economic Report for September 2015
Calvert Home Mortgage Real Estate and Economic Report for September 2015
Keith Uthe
 
Calvert Home Mortgage Real Estate & Economic Report December 2015
Calvert Home Mortgage Real Estate & Economic Report December 2015Calvert Home Mortgage Real Estate & Economic Report December 2015
Calvert Home Mortgage Real Estate & Economic Report December 2015
Keith Uthe
 
August 2015 Home Sales Report
August 2015 Home Sales ReportAugust 2015 Home Sales Report
August 2015 Home Sales Report
Phil Sveum
 
November 2015 Home Sales Report
November 2015 Home Sales ReportNovember 2015 Home Sales Report
November 2015 Home Sales Report
Phil Sveum
 
November 2015 Home Sales Report
November 2015 Home Sales ReportNovember 2015 Home Sales Report
November 2015 Home Sales Report
Sheryl Schroeder
 
October 2015 Home Sales Report
October 2015 Home Sales ReportOctober 2015 Home Sales Report
October 2015 Home Sales Report
Phil Sveum
 
2015 10 oct homes sales report
2015 10 oct homes sales report2015 10 oct homes sales report
2015 10 oct homes sales report
Sheryl Schroeder
 
San Francisco Market Focus May 2015
San Francisco Market Focus May 2015San Francisco Market Focus May 2015
San Francisco Market Focus May 2015
Ronny Budiutama
 
San Francisco Market Focus October 2015
San Francisco Market Focus October 2015San Francisco Market Focus October 2015
San Francisco Market Focus October 2015
Ronny Budiutama
 
San Francisco Market Focus September 2015
San Francisco Market Focus September 2015San Francisco Market Focus September 2015
San Francisco Market Focus September 2015
Ronny Budiutama
 
San Francisco Market Focus August 2015
San Francisco Market Focus August 2015San Francisco Market Focus August 2015
San Francisco Market Focus August 2015
Ronny Budiutama
 
San Francisco Market Focus April 2015
San Francisco Market Focus April 2015San Francisco Market Focus April 2015
San Francisco Market Focus April 2015
Ronny Budiutama
 
June 2015 Home Sales Report
June 2015 Home Sales ReportJune 2015 Home Sales Report
June 2015 Home Sales Report
Phil Sveum
 
Crested Butte Real Estate Market Report - Ski Season 2014-2015
Crested Butte Real Estate Market Report - Ski Season 2014-2015Crested Butte Real Estate Market Report - Ski Season 2014-2015
Crested Butte Real Estate Market Report - Ski Season 2014-2015
Chris Kopf
 
2021 April Calgary Home Sales Stats
2021 April Calgary Home Sales Stats2021 April Calgary Home Sales Stats
2021 April Calgary Home Sales Stats
Jerry Charlton
 
Boulder County Real Estate Statistics August 2015
Boulder County Real Estate Statistics August 2015Boulder County Real Estate Statistics August 2015
Boulder County Real Estate Statistics August 2015
Neil Kearney
 
The Do Good Report - Wrightsville Beach 1st Quarter 2013
The Do Good Report - Wrightsville Beach 1st Quarter 2013The Do Good Report - Wrightsville Beach 1st Quarter 2013
The Do Good Report - Wrightsville Beach 1st Quarter 2013
DoGoodRealEstate
 
November 2014 Greater Boston Real Estate Market Trends Report
November 2014 Greater Boston Real Estate Market Trends ReportNovember 2014 Greater Boston Real Estate Market Trends Report
November 2014 Greater Boston Real Estate Market Trends Report
Unit Realty Group
 
September Realtor Report
September Realtor ReportSeptember Realtor Report
January 2015 Greater Boston Real Estate Market Trends Report
January 2015 Greater Boston Real Estate Market Trends ReportJanuary 2015 Greater Boston Real Estate Market Trends Report
January 2015 Greater Boston Real Estate Market Trends Report
Unit Realty Group
 

Similar to Calvert Home Mortgage Economic Report for October 2015 (20)

Calvert Home Mortgage Real Estate and Economic Report for September 2015
Calvert Home Mortgage Real Estate and Economic Report for September 2015Calvert Home Mortgage Real Estate and Economic Report for September 2015
Calvert Home Mortgage Real Estate and Economic Report for September 2015
 
Calvert Home Mortgage Real Estate & Economic Report December 2015
Calvert Home Mortgage Real Estate & Economic Report December 2015Calvert Home Mortgage Real Estate & Economic Report December 2015
Calvert Home Mortgage Real Estate & Economic Report December 2015
 
August 2015 Home Sales Report
August 2015 Home Sales ReportAugust 2015 Home Sales Report
August 2015 Home Sales Report
 
November 2015 Home Sales Report
November 2015 Home Sales ReportNovember 2015 Home Sales Report
November 2015 Home Sales Report
 
November 2015 Home Sales Report
November 2015 Home Sales ReportNovember 2015 Home Sales Report
November 2015 Home Sales Report
 
October 2015 Home Sales Report
October 2015 Home Sales ReportOctober 2015 Home Sales Report
October 2015 Home Sales Report
 
2015 10 oct homes sales report
2015 10 oct homes sales report2015 10 oct homes sales report
2015 10 oct homes sales report
 
San Francisco Market Focus May 2015
San Francisco Market Focus May 2015San Francisco Market Focus May 2015
San Francisco Market Focus May 2015
 
San Francisco Market Focus October 2015
San Francisco Market Focus October 2015San Francisco Market Focus October 2015
San Francisco Market Focus October 2015
 
San Francisco Market Focus September 2015
San Francisco Market Focus September 2015San Francisco Market Focus September 2015
San Francisco Market Focus September 2015
 
San Francisco Market Focus August 2015
San Francisco Market Focus August 2015San Francisco Market Focus August 2015
San Francisco Market Focus August 2015
 
San Francisco Market Focus April 2015
San Francisco Market Focus April 2015San Francisco Market Focus April 2015
San Francisco Market Focus April 2015
 
June 2015 Home Sales Report
June 2015 Home Sales ReportJune 2015 Home Sales Report
June 2015 Home Sales Report
 
Crested Butte Real Estate Market Report - Ski Season 2014-2015
Crested Butte Real Estate Market Report - Ski Season 2014-2015Crested Butte Real Estate Market Report - Ski Season 2014-2015
Crested Butte Real Estate Market Report - Ski Season 2014-2015
 
2021 April Calgary Home Sales Stats
2021 April Calgary Home Sales Stats2021 April Calgary Home Sales Stats
2021 April Calgary Home Sales Stats
 
Boulder County Real Estate Statistics August 2015
Boulder County Real Estate Statistics August 2015Boulder County Real Estate Statistics August 2015
Boulder County Real Estate Statistics August 2015
 
The Do Good Report - Wrightsville Beach 1st Quarter 2013
The Do Good Report - Wrightsville Beach 1st Quarter 2013The Do Good Report - Wrightsville Beach 1st Quarter 2013
The Do Good Report - Wrightsville Beach 1st Quarter 2013
 
November 2014 Greater Boston Real Estate Market Trends Report
November 2014 Greater Boston Real Estate Market Trends ReportNovember 2014 Greater Boston Real Estate Market Trends Report
November 2014 Greater Boston Real Estate Market Trends Report
 
September Realtor Report
September Realtor ReportSeptember Realtor Report
September Realtor Report
 
January 2015 Greater Boston Real Estate Market Trends Report
January 2015 Greater Boston Real Estate Market Trends ReportJanuary 2015 Greater Boston Real Estate Market Trends Report
January 2015 Greater Boston Real Estate Market Trends Report
 

Recently uploaded

Ending stagnation: How to boost prosperity across Scotland
Ending stagnation: How to boost prosperity across ScotlandEnding stagnation: How to boost prosperity across Scotland
Ending stagnation: How to boost prosperity across Scotland
ResolutionFoundation
 
Governor Olli Rehn: Inflation down and recovery supported by interest rate cu...
Governor Olli Rehn: Inflation down and recovery supported by interest rate cu...Governor Olli Rehn: Inflation down and recovery supported by interest rate cu...
Governor Olli Rehn: Inflation down and recovery supported by interest rate cu...
Suomen Pankki
 
Optimizing Net Interest Margin (NIM) in the Financial Sector (With Examples).pdf
Optimizing Net Interest Margin (NIM) in the Financial Sector (With Examples).pdfOptimizing Net Interest Margin (NIM) in the Financial Sector (With Examples).pdf
Optimizing Net Interest Margin (NIM) in the Financial Sector (With Examples).pdf
shruti1menon2
 
Upanishads summary with explanations of each upnishad
Upanishads summary with explanations of each upnishadUpanishads summary with explanations of each upnishad
Upanishads summary with explanations of each upnishad
ajaykumarxoxo04
 
Who Is Abhay Bhutada, MD of Poonawalla Fincorp
Who Is Abhay Bhutada, MD of Poonawalla FincorpWho Is Abhay Bhutada, MD of Poonawalla Fincorp
Who Is Abhay Bhutada, MD of Poonawalla Fincorp
beulahfernandes8
 
Independent Study - College of Wooster Research (2023-2024) FDI, Culture, Glo...
Independent Study - College of Wooster Research (2023-2024) FDI, Culture, Glo...Independent Study - College of Wooster Research (2023-2024) FDI, Culture, Glo...
Independent Study - College of Wooster Research (2023-2024) FDI, Culture, Glo...
AntoniaOwensDetwiler
 
RMIT University degree offer diploma Transcript
RMIT University degree offer diploma TranscriptRMIT University degree offer diploma Transcript
RMIT University degree offer diploma Transcript
cahyrnui
 
高仿英国伦敦艺术大学毕业证(ual毕业证书)文凭证书原版一模一样
高仿英国伦敦艺术大学毕业证(ual毕业证书)文凭证书原版一模一样高仿英国伦敦艺术大学毕业证(ual毕业证书)文凭证书原版一模一样
高仿英国伦敦艺术大学毕业证(ual毕业证书)文凭证书原版一模一样
234knry
 
Machine Learning in Business - A power point presentation.pptx
Machine Learning in Business - A power point presentation.pptxMachine Learning in Business - A power point presentation.pptx
Machine Learning in Business - A power point presentation.pptx
mimiroselowe
 
一比一原版(RMIT毕业证)皇家墨尔本理工大学毕业证如何办理
一比一原版(RMIT毕业证)皇家墨尔本理工大学毕业证如何办理一比一原版(RMIT毕业证)皇家墨尔本理工大学毕业证如何办理
一比一原版(RMIT毕业证)皇家墨尔本理工大学毕业证如何办理
k4ncd0z
 
Accounting Information Systems (AIS).pptx
Accounting Information Systems (AIS).pptxAccounting Information Systems (AIS).pptx
Accounting Information Systems (AIS).pptx
TIZITAWMASRESHA
 
falcon-invoice-discounting-a-premier-investment-platform-for-superior-returns...
falcon-invoice-discounting-a-premier-investment-platform-for-superior-returns...falcon-invoice-discounting-a-premier-investment-platform-for-superior-returns...
falcon-invoice-discounting-a-premier-investment-platform-for-superior-returns...
Falcon Invoice Discounting
 
Independent Study - College of Wooster Research (2023-2024)
Independent Study - College of Wooster Research (2023-2024)Independent Study - College of Wooster Research (2023-2024)
Independent Study - College of Wooster Research (2023-2024)
AntoniaOwensDetwiler
 
在线办理(UMASS毕业证书)马萨诸塞大学阿默斯特分校毕业证完成信一模一样
在线办理(UMASS毕业证书)马萨诸塞大学阿默斯特分校毕业证完成信一模一样在线办理(UMASS毕业证书)马萨诸塞大学阿默斯特分校毕业证完成信一模一样
在线办理(UMASS毕业证书)马萨诸塞大学阿默斯特分校毕业证完成信一模一样
5spllj1l
 
What's a worker’s market? Job quality and labour market tightness
What's a worker’s market? Job quality and labour market tightnessWhat's a worker’s market? Job quality and labour market tightness
What's a worker’s market? Job quality and labour market tightness
Labour Market Information Council | Conseil de l’information sur le marché du travail
 
South Dakota State University degree offer diploma Transcript
South Dakota State University degree offer diploma TranscriptSouth Dakota State University degree offer diploma Transcript
South Dakota State University degree offer diploma Transcript
ynfqplhm
 
Fabular Frames and the Four Ratio Problem
Fabular Frames and the Four Ratio ProblemFabular Frames and the Four Ratio Problem
Fabular Frames and the Four Ratio Problem
Majid Iqbal
 
快速办理(RWTH毕业证书)德国亚琛工业大学毕业证录取通知书一模一样
快速办理(RWTH毕业证书)德国亚琛工业大学毕业证录取通知书一模一样快速办理(RWTH毕业证书)德国亚琛工业大学毕业证录取通知书一模一样
快速办理(RWTH毕业证书)德国亚琛工业大学毕业证录取通知书一模一样
yeuwffu
 
快速办理(美国Fordham毕业证书)福德汉姆大学毕业证学历证书一模一样
快速办理(美国Fordham毕业证书)福德汉姆大学毕业证学历证书一模一样快速办理(美国Fordham毕业证书)福德汉姆大学毕业证学历证书一模一样
快速办理(美国Fordham毕业证书)福德汉姆大学毕业证学历证书一模一样
5spllj1l
 
University of North Carolina at Charlotte degree offer diploma Transcript
University of North Carolina at Charlotte degree offer diploma TranscriptUniversity of North Carolina at Charlotte degree offer diploma Transcript
University of North Carolina at Charlotte degree offer diploma Transcript
tscdzuip
 

Recently uploaded (20)

Ending stagnation: How to boost prosperity across Scotland
Ending stagnation: How to boost prosperity across ScotlandEnding stagnation: How to boost prosperity across Scotland
Ending stagnation: How to boost prosperity across Scotland
 
Governor Olli Rehn: Inflation down and recovery supported by interest rate cu...
Governor Olli Rehn: Inflation down and recovery supported by interest rate cu...Governor Olli Rehn: Inflation down and recovery supported by interest rate cu...
Governor Olli Rehn: Inflation down and recovery supported by interest rate cu...
 
Optimizing Net Interest Margin (NIM) in the Financial Sector (With Examples).pdf
Optimizing Net Interest Margin (NIM) in the Financial Sector (With Examples).pdfOptimizing Net Interest Margin (NIM) in the Financial Sector (With Examples).pdf
Optimizing Net Interest Margin (NIM) in the Financial Sector (With Examples).pdf
 
Upanishads summary with explanations of each upnishad
Upanishads summary with explanations of each upnishadUpanishads summary with explanations of each upnishad
Upanishads summary with explanations of each upnishad
 
Who Is Abhay Bhutada, MD of Poonawalla Fincorp
Who Is Abhay Bhutada, MD of Poonawalla FincorpWho Is Abhay Bhutada, MD of Poonawalla Fincorp
Who Is Abhay Bhutada, MD of Poonawalla Fincorp
 
Independent Study - College of Wooster Research (2023-2024) FDI, Culture, Glo...
Independent Study - College of Wooster Research (2023-2024) FDI, Culture, Glo...Independent Study - College of Wooster Research (2023-2024) FDI, Culture, Glo...
Independent Study - College of Wooster Research (2023-2024) FDI, Culture, Glo...
 
RMIT University degree offer diploma Transcript
RMIT University degree offer diploma TranscriptRMIT University degree offer diploma Transcript
RMIT University degree offer diploma Transcript
 
高仿英国伦敦艺术大学毕业证(ual毕业证书)文凭证书原版一模一样
高仿英国伦敦艺术大学毕业证(ual毕业证书)文凭证书原版一模一样高仿英国伦敦艺术大学毕业证(ual毕业证书)文凭证书原版一模一样
高仿英国伦敦艺术大学毕业证(ual毕业证书)文凭证书原版一模一样
 
Machine Learning in Business - A power point presentation.pptx
Machine Learning in Business - A power point presentation.pptxMachine Learning in Business - A power point presentation.pptx
Machine Learning in Business - A power point presentation.pptx
 
一比一原版(RMIT毕业证)皇家墨尔本理工大学毕业证如何办理
一比一原版(RMIT毕业证)皇家墨尔本理工大学毕业证如何办理一比一原版(RMIT毕业证)皇家墨尔本理工大学毕业证如何办理
一比一原版(RMIT毕业证)皇家墨尔本理工大学毕业证如何办理
 
Accounting Information Systems (AIS).pptx
Accounting Information Systems (AIS).pptxAccounting Information Systems (AIS).pptx
Accounting Information Systems (AIS).pptx
 
falcon-invoice-discounting-a-premier-investment-platform-for-superior-returns...
falcon-invoice-discounting-a-premier-investment-platform-for-superior-returns...falcon-invoice-discounting-a-premier-investment-platform-for-superior-returns...
falcon-invoice-discounting-a-premier-investment-platform-for-superior-returns...
 
Independent Study - College of Wooster Research (2023-2024)
Independent Study - College of Wooster Research (2023-2024)Independent Study - College of Wooster Research (2023-2024)
Independent Study - College of Wooster Research (2023-2024)
 
在线办理(UMASS毕业证书)马萨诸塞大学阿默斯特分校毕业证完成信一模一样
在线办理(UMASS毕业证书)马萨诸塞大学阿默斯特分校毕业证完成信一模一样在线办理(UMASS毕业证书)马萨诸塞大学阿默斯特分校毕业证完成信一模一样
在线办理(UMASS毕业证书)马萨诸塞大学阿默斯特分校毕业证完成信一模一样
 
What's a worker’s market? Job quality and labour market tightness
What's a worker’s market? Job quality and labour market tightnessWhat's a worker’s market? Job quality and labour market tightness
What's a worker’s market? Job quality and labour market tightness
 
South Dakota State University degree offer diploma Transcript
South Dakota State University degree offer diploma TranscriptSouth Dakota State University degree offer diploma Transcript
South Dakota State University degree offer diploma Transcript
 
Fabular Frames and the Four Ratio Problem
Fabular Frames and the Four Ratio ProblemFabular Frames and the Four Ratio Problem
Fabular Frames and the Four Ratio Problem
 
快速办理(RWTH毕业证书)德国亚琛工业大学毕业证录取通知书一模一样
快速办理(RWTH毕业证书)德国亚琛工业大学毕业证录取通知书一模一样快速办理(RWTH毕业证书)德国亚琛工业大学毕业证录取通知书一模一样
快速办理(RWTH毕业证书)德国亚琛工业大学毕业证录取通知书一模一样
 
快速办理(美国Fordham毕业证书)福德汉姆大学毕业证学历证书一模一样
快速办理(美国Fordham毕业证书)福德汉姆大学毕业证学历证书一模一样快速办理(美国Fordham毕业证书)福德汉姆大学毕业证学历证书一模一样
快速办理(美国Fordham毕业证书)福德汉姆大学毕业证学历证书一模一样
 
University of North Carolina at Charlotte degree offer diploma Transcript
University of North Carolina at Charlotte degree offer diploma TranscriptUniversity of North Carolina at Charlotte degree offer diploma Transcript
University of North Carolina at Charlotte degree offer diploma Transcript
 

Calvert Home Mortgage Economic Report for October 2015

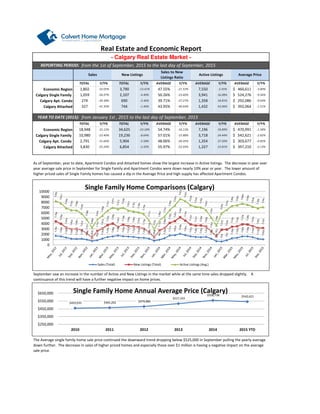
  • 1. Economic Region Calgary Single Family Calgary Apt. Condo Calgary Attached 2015 Economic Region Calgary Single Family Calgary Apt. Condo Calgary Attached As of September, year to date, Apartment Condos and Attached homes show the largest increase in Active listings. The decrease in year over year average sale price in September for Single Family and Apartment Condos were down nearly 10% year or year. The lower amount of higher priced sales of Single Family homes has caused a dip in the Average Price and high supply has affected Apartment Condos. The Average single family home sale price continued the downward trend dropping below $525,000 in September pulling the yearly average down further. The decrease in sales of higher priced homes and especially those over $1 million is having a negative impact on the average sale price. -4.85% 3,830 -25.24% 6,854 -2.42% 55.97% -22.93% 1,327 53.81% 397,210$ -2.13% 2,791 -31.66% 5,904 -5.58% 48.06% -26.05% 1,354 37.20% 303,677$ -1.58% AVERAGE Y/Y% AVERAGE Y/Y% 10,980 -23.40% 19,236 -8.64% 57.01% -15.88% 3,718 24.44% 542,621$ -2.92% 18,948 -25.12% 34,625 -10.18% 54.74% -16.13% 7,196 18.89% 470,991$ from January 1st , 2015 to the last day of September, 2015 TOTAL Y/Y% TOTAL Y/Y% AVERAGE Y/Y% Real Estate and Economic Report Sales New Listings Sales to New Listings Ratio Active Listings Average Price -32.05% 3,790 -13.41% 47.55% -21.53% 1,059 -26.97% 2,107 -4.40% 50.26% -23.60% TOTAL Y/Y% TOTAL Y/Y% AVERAGE Y/Y% 3,941 16.08% 524,276$ -9.56% 274 -39.38% 690 -3.36% 39.71% -37.27% 1,358 18.81% 292,086$ AVERAGE 7,550 -2.45% 460,611$ -3.80%1,802 -9.64% from the 1st of September, 2015 to the last day of September, 2015 - Calgary Real Estate Market - REPORTING PERIOD: September saw an increase in the number of Active and New Listings in the market while at the same time sales dropped slightly. A continuance of this trend will have a further negative impact on home prices. 744 -1.46% 43.95% -40.64% 1,432 43.06%327 -41.50% Y/Y% AVERAGE Y/Y% 392,064$ -1.51% YEAR TO DATE (2015): $459,035 $465,202 $479,880 $517,333 $558,738 $542,621 $250,000 $350,000 $450,000 $550,000 $650,000 2010 2011 2012 2013 2014 2015 YTD Single Family Home Annual Average Price (Calgary) 0 1000 2000 3000 4000 5000 6000 7000 8000 9000 10000 Single Family Home Comparisons (Calgary) Sales (Total) New Listings (Total) Active Listings (Avg.)
  • 2. Total Residential Single Family Apartment Condo Duplex Row House 2015 Total Residential Single Family Apartment Condo Duplex/Row House The spread between new listings and total sales continued to increase in Setpember. Duplex/Row Houses saw a 64% increase in new listings for September year over year and 355 year to date. Yet, despite these trends, Duplex/Row Houses have managed to show the highest increase in average sale price year over year to date. 1,146 3.43% 2,080 35.42% 55.22% -23.42% 357,620$ 4.12% 8,003 -11.37% 15,616 13.50% 50.33% -22.30% 437,841$ 1.49% 3,782 -14.88% 8,174 17.92% 45.78% -28.10% 252,902$ 1.52% YEAR TO DATE (2015): from January 1st, 2015 to the last day of September, 2015 AVERAGE Y/Y% 13,178 -10.54% 26,501 15.83% 48.83% -23.96% TOTAL Y/Y% 372,034$ 1.99% TOTAL Y/Y% AVERAGE Y/Y% 411 -15.43% 773 24.48% 53.00% -32.05% 252,953$ 0.58% 143 9.16% 272 63.86% 53.00% -32.91% 364,203$ 4.28% -0.75% 873 -14.41% 1,660 24.34% 53.00% -30.26% 432,150$ 1.48% 1,462 -12.14% 2,777 26.75% 52.65% -30.68% 368,874$ TOTAL Y/Y% TOTAL Y/Y% AVERAGE Y/Y% AVERAGE REPORTING PERIOD: from the 1st of September, 2015 to the last day of September, 2015 Sales New Listings Y/Y% Sales to New Listings Ratio Average Price - Edmonton Real Estate Market - The days on market are managing to remain steady around 40 days on market for single family homes. Good properties priced appropriately continue to sell quickly. Days on market are much higher in the SE(40), SW(38) compared to NW(36) & NE(31). September saw a large drop in sales for property priced between $200,000 and $449,000. This is the second consecutive month we have seen this. This is reflective of the large drop in year over year sales of Apartment Condominiums and Attached homes which tend to make up the majority of this price range. Sales of homes over $1 million also dropped off significantly. 20 25 30 35 40 45 50 Single Family Home Average Days on Market (Calgary) 0 50 100 150 200 250 300 350 > $100 $100 - $199 $200 - $299 $300 -$ 349 $350 - $399 $400 - $449 $450 - $499 $500 - $549 $550 - $599 $600 - $649 $650 - $699 $700 - $799 $800 - $899 $900 - $999 $1M + Sept. 2014 Sept. 2015 Number of Sales by Price Range (Calgary Metro)
  • 3. Following a drop in average days on market from 58 to 44 between January to March 2015 we have now seen a steady increase since then with a slight dip in September to 53 from August's 54 average days on market. Sales remained steady in September as New Listings dropped slightly. A welcome change from August and a similar trend of previous years allowing the Average Sale Price to still be up a modest 1.99% over September of last year. Since 2011 the average home price in Edmonton has increased an average of just over 4% per year since 2011 with a high of 5.4% between 2013 and 2014. Increases in 2015 have now flattened out compared to the more vigorous start to the year. The Calgary Home Price index has been in mostly a downward trend since July 2014 where as the Edmonton home Price Index continued to increase until its recent decline in July. The Calgary index has been fluctuating up and down since April 2015. Since 2005 the TSX100 only increased 50% compared to the 110% for Calgary and the 80% for Edmonton showing that real estate continues to be a strong investment. $383,226 $379,485 $392,446 $409,438 $431,812 $437,841 $340,000 $360,000 $380,000 $400,000 $420,000 $440,000 $460,000 2010 2011 2012 2013 2014 2015 YTD Single Family Home Annual Average Price (Edmonton) 1,264 1,136 941 854 773 782 623 419 528 648 923 1,022 1,179 1,198 1,125 983 857 863 673 436 485 747 917 1,147 1,213 1,324 1,158 1,019 1,020 850 717 439 390 547 876 1,001 1,078 1,243 1,111 884 873 1,943 1,627 1,455 1,380 1,266 1,082 769 409 955 1,115 1,467 1,569 1,911 1,586 1,491 1,349 1,268 1,059 783 415 1,070 1,082 1,585 1,818 2,085 1,829 1,601 1,354 1,335 1,256 794 534 1,298 1,428 1,883 1,964 1,974 1,886 1,782 1,741 1,660 0 500 1,000 1,500 2,000 2,500 Single Family Home Comparisons (Edmonton) Sales (Total) New Listings (Total) 0 10 20 30 40 50 60 Average Days on Market (Edmonton Metro) 100 125 150 175 200 Calgary Home Price Index Edmonton Home Price Index Home Price Index Comparison
  • 4. Alberta Canada Unemployment Rate Jul-15 Retail Trade (mill. $'s) Jul-15 Total Mortgages Jun-15 The number of total mortgages in Alberta Weekly Earnings Jul-15 0.8% (F Mar/15) - 0.7(F Oct/15) 0.50% 1.2%(F Sep/15) Q2 Q4 TOTAL $955.02 1.41% 0.69% 27.69% 11,472 1.83% Jul-15 Net Migration to AB 36.95 -21.55% 2014 2014 ATB (F)Alberta 2015 Canada 2015 RBC (F)2.40% 4.40% in Alberta in Alberta 6.50% Mortgages 90 day Arrears July 15 in Canada in Canada 571065 4668787 -3.68%in Alberta 6.392 in Canada 43.345 7.10% 11.27% 1.78% Housing starts (000's) Sep-15 -1.53% in Canada 12,542 -4.62% 1.67% 1,541 $1,120.84 -11.18%in Alberta in Alberta in Canada Real GDP Growth Annual Rate Y/Y% *the following information is based on current available data from: http://economicdashboard.albertacanada.com/, www.statcan.gc.ca/dai-quo/ and RBC Economic Outlook,http://www.cba.ca/en/component/content/publication/69-statistics, http://www.atb.com/SiteCollectionDocuments Real GDP Growth TOTAL Y/Y% - Alberta Economic Indicators - The ratio of the total number of mortgages to 90 day arrears has decreased in Canada and flattened out in Alberta after a slight increase in May 2015. The overall number of mortgages in Alberta and Canada continues to increase. With the cutback of overtime hours in the energy sector as well as restructuring of salaries we are seeing the impact to the average weekly earnings in Alberta, which is not far from where it was in 2013. Canada is still well below the Alberta average. $990.98 $1,034.17 $1,070.47 $1,107.97 $1,149.18 $1,120.84 $868.07 $883.91 $908.37 $930.28 $948.40 $955.02 $0 $500 $1,000 $1,500 2010 2011 2012 2013 2014 2015 YTD Average Weekly Earnings Alberta's Average Weekly Earnings Canada's Average Weekly Earnings 0.20% 0.23% 0.25% 0.28% 0.30% 0.33% 0.35% 0.38% 0.40% 2014-05 2014-06 2014-07 2014-08 2014-09 2014-10 2014-11 2014-12 2015-01 2015-02 2015-03 2015-04 2015-05 2015-06 2015-07 M o r t g a g e s % of Arrears to Total Number of Mortgages AB % of Arrears to Total Number of Mortgages CA Mortgage Arrears Ratio; Canada vs Alberta
  • 5. Notes: Bank of Canada Resources http://www.rbc.com/e http://www.bankofcan http://economicdashboard.albertacanada.com/ http://www.creb.com/ http://www.ereb.com/REALTORSAssociationOfEdmonton.html http://www.capp.ca/Pages/default.aspx http://homepriceindex.ca/hpi_tool_en.html http://www.cba.ca/en/component/content/publication/69-statistics http://www.finance.alberta.ca/aboutalberta/ http://www.statcan.gc.ca/dai-quo/ http://www.housepriceindex.ca/default.aspx?langue=EN On Wednesday, 21 October 2015, the Bank of Canada will announce its decision on the target for the overnight rate. A press release will provide a brief explanation of the decision.The Bank will also publish its quarterly Monetary Policy Report (MPR) at the same time as the rate decision. August was a very difficult month for both the WTI and the WCS and we also saw a significant increase in the price differential. Prices for both WTI and WCS have recovered some since this dip and the differential has narrowed. The amount of oil being produced and shipped in the Province continues to increase. $- $10.00 $20.00 $30.00 $40.00 $50.00 $60.00 $70.00 $80.00 $90.00 $100.00 $110.00 $120.00 WCS OIL PRICES WTI OIL PRICES WTI-WCS Price Differential WTI and WCS Pricing and Price Differential (US$)