SlideShare a Scribd company logo
1 of 5
Download to read offline
Economic Region
Calgary Single Family
Calgary Apt. Condo
Calgary Attached
2015
Economic Region
Calgary Single Family
Calgary Apt. Condo
Calgary Attached
As of August, year to date, Apartment Condo's and Attached homes show the largest increase in Active listings, as well as the largest decrease
in year over year sales year to date. The biggest decrease in average price year over year for August is in apartment condos is 9.57%. The lack
of higher priced sales of single family homes has caused a dip in the average price.
Average single family home sale price continued the downward trend dropping below $545,000 in August. The decrease in sales
of higher priced homes over $650,000 was offset by a sharp drop in sales of property under $450,000 allowing the average price
to remain stable during August.
-4.25%
3,503 -23.25% 6,110 -2.54% 57.47% -20.66% 1,313 55.41% 397,853$ -2.20%
2,517 -30.70% 5,214 -5.87% 49.10% -24.69% 1,353 39.92% 305,126$
-1.30%
AVERAGE Y/Y% AVERAGE Y/Y%
9,924 -22.97% 17,129 -9.14% 57.87% -14.91% 3,690 25.65% 544,914$ -2.05%
17,146 -24.31% 30,835 -9.77% 55.64% -15.51% 7,152 22.42% 472,289$
388,198$ -6.88%
YEAR TO DATE (2015): from January 1st , 2015 to the last day of August, 2015
TOTAL Y/Y% TOTAL Y/Y% AVERAGE Y/Y%
Real Estate and Economic Report
Sales New Listings
Sales to New
Listings Ratio
Active Listings Average Price
Y/Y% AVERAGE Y/Y%TOTAL Y/Y% TOTAL Y/Y% AVERAGE Y/Y%
7,178 -10.14% 461,814$ -2.19%2,066
-9.57%
434 -24.13%
from the 1st of August, 2015 to the last day of August, 2015
-24.85% 3,464 -20.26% 59.64% -5.75%
1,179 -20.93% 1,992 -6.35% 59.19% -15.57%
- Calgary Real Estate Market -
REPORTING PERIOD:
A slowing of new listings to the market, compared to last year, is assiting with supporting the average prices from further declines,
particularly in the detached single family home segment.
3,709 5.43% 538,016$ -3.46%
292 -40.53% 543 -20.61% 53.78% -25.09% 1,292 13.63% 291,394$
MONTH END
663 -14.01% 65.46% -11.77% 1,317 28.49%
$459,035 $465,202 $479,880
$517,333
$558,738 $544,914
$250,000
$350,000
$450,000
$550,000
$650,000
2010 2011 2012 2013 2014 2015 YTD
Single Family Home Annual Average Price (Calgary)
0
1000
2000
3000
4000
5000
6000
7000
8000
9000
10000
Single Family Home Comparisons (Calgary)
Sales (Total) New Listings (Total) Active Listings (Avg.)
Total Residential
Single Family
Apartment Condo
Duplex Row House
2015
Total Residential
Single Family
Apartment Condo
Duplex/Row House
The spread between new listings and total sales continued to increase in August. Duplex/Row Houses continue to see the largest
percentage increase in new listings for August year over year and year to date followed by apartment condominiums. Duplex/Row
Houses have managed to show the highest increase in average sale price year over year to date.
1,003 2.66% 1,808 31.97% 55.50% -22.11% 356,798$ 4.10%
7,130 -10.99% 13,956 12.33% 50.00% -21.10% 438,553$ 1.81%
3,371 -14.81% 7,401 17.27% 44.88% -27.47% 252,896$ 1.64%
YEAR TO DATE (2015): from January 1st, 2015 to the last day of August, 2015
AVERAGE Y/Y%
11,716 -10.33% 23,724 14.68% 48.36% -22.94%
TOTAL Y/Y%
372,429$ 2.34%
TOTAL Y/Y% AVERAGE Y/Y%
433 -13.40% 897 23.55% 48.00% -30.43% 254,672$ -2.79%
122 -7.58% 221 55.63% 55.00% -40.86% 354,409$ 1.32%
1.03%
884 -13.25% 1,741 28.58% 51.00% -32.00% 439,829$ 1.82%
1,465 -13.72% 2,926 26.89% 50.07% -32.00% 372,256$
TOTAL Y/Y% TOTAL Y/Y% AVERAGE Y/Y% AVERAGE
REPORTING PERIOD: from the 1st of August, 2015 to the last day of August, 2015
Sales New Listings
Y/Y%
Sales to New
Listings Ratio
Average Price
- Edmonton Real Estate Market -
The days on market are managing to remain steady around 42 days on market for single family homes. Good properties priced
appropriately continue to sell quickly. Days on market are much higher in the SW(41), SE(40) compared to NW(36) & NE(31).
August saw a large drop in sales for property priced between $200,000 and $400,000. Previously from January to July this price
range had not seen this large of a drop in sales. This is reflective of the large drop in year over year sales of Apartment
Condominiums and Attached homes which tend to make up the majority of this price range.
0
10
20
30
40
50
Single Family Home Average Days on Market (Calgary)
0
50
100
150
200
250
300
350
400
> $100 $100 -
$199
$200 -
$299
$300 -$
349
$350 -
$399
$400 -
$449
$450 -
$499
$500 -
$549
$550 -
$599
$600 -
$649
$650 -
$699
$700 -
$799
$800 -
$899
$900 -
$999
$1M +
Aug. 2014
Aug. 2015
Number of Sales by Price Range (Calgary Metro)
Following a drop in average days on market from 58 to 44 between January to March 2015 we have now seen a steady increase
since then to 54 average days on market. Apartment condos are the highest at 56 average days on market.
The Calgary Home Price index has been in mostly a downward trend since July 2014 where as the Edmonton home Price Index
continued to increase until its recent decline in July. Since 2005 the TSX100 only increased 50% compared to the 110% for
Calgary and the 80% for Edmonton showing that real estate continues to be a strong investment.
The sharp drop in sales for August was not matched with a similar drop in new listings. A break from the trend of previous years.
If the new listings continue to stay on the same trend into the fall expect that the average price will begin to decrease.
Since 2011 the average home price in Edmonton has increased an average of just over 4% per year since 2011 with a high of
5.4% between 2013 and 2014. The current YTD increase over 2014 is 1.58%.
$383,226 $379,485
$392,446
$409,438
$431,741
$438,553
$340,000
$360,000
$380,000
$400,000
$420,000
$440,000
$460,000
2010 2011 2012 2013 2014 2015 YTD
Single Family Home Annual Average Price (Edmonton)
1,084
1,264
1,136
941
854
773
782
623
419
528
648
923
1,022
1,179
1,198
1,125
983
857
863
673
436
485
747
917
1,147
1,213
1,324
1,158
1,019
967
850
717
439
390
547
876
1,001
1,078
1,243
1,111
884
1,663
1,943
1,627
1,455
1,380
1,266
1,082
769
409
955
1,115
1,467
1,569
1,911
1,586
1,491
1,349
1,268
1,059
783
415
1,070
1,082
1,585
1,818
2,085
1,829
1,601
1,354
1,337
1,256
794
534
1,298
1,428
1,883
1,964
1,974
1,886
1,782
1,741
0
500
1,000
1,500
2,000
2,500
Single Family Home Comparisons (Edmonton)
Sales (Total) New Listings (Total)
0
10
20
30
40
50
60
Average Days on Market (Edmonton Metro)
100
125
150
175
200
Calgary Home Price Index
Edmonton Home Price Index
Home Price Index Comparison
Alberta
Canada
Unemployment Rate
Jul-15
Retail Trade
Jun-15
Total Mortgages
Jun-15
The number of total
mortgages in Alberta
The number of total mortgages in Alberta has continued to increase, however, number and ratio of mortgage arrears in 2015 has
been lower on average than the previous 4 years even with a slight increase in May and June.
Employees have continued to earn more than they did at this time last year, however average weekly earnings are down since they
peaked in February and March this year. Reduced overtime hours in the energy sector and cutbacks are a key factor.
2.40%
4.40%
Weekly Earnings
Jun-15
2.0% (F Jan/15) 0.8% (F Mar/15)
-0.80% -0.50%
Q1 Q2
TOTAL
2014
2014
ATB (F)Alberta 2015
Canada 2015
in Alberta
in Alberta 6.00%
Mortgages 90 day
Arrears June 15
in Canada
in Canada
571,065
4,668,787
-3.73%in Alberta 0.34%
in Canada -0.13%
7.00% 10.00%
1.71%
Housing starts (000's)
Aug-15
0.19%
in Canada 956.48$
12,656 -4.58%
1.91%
1,535
1,153.35$
-14.63%in Alberta
in Alberta
in Canada
1.41%
0.69%
21.67%
Real GDP Growth Annual Rate
Y/Y%
*the following information is based on current available data from: http://economicdashboard.albertacanada.com/, www.statcan.gc.ca/dai-quo/ and RBC Economic
Outlook,http://www.cba.ca/en/component/content/publication/69-statistics, http://www.atb.com/SiteCollectionDocuments
Real GDP Growth
TOTAL Y/Y%
7,723 2.17%
Apr-15
Net Migration to AB
35.61 -19.22%
- Alberta Economic Indicators -
$990.98
$1,034.17
$1,070.47
$1,107.97
$1,149.18 $1,145.90
$900
$1,000
$1,100
$1,200
2010 2011 2012 2013 2014 2015 YTD
Alberta's Average Weekly Earnings
0.20%
0.23%
0.25%
0.28%
0.30%
0.33%
0.35%
0.38%
0.40%
M
o
r
t
g
a
g
e
s
% of Arrears to Total Number of
Mortgages AB
% of Arrears to Total Number of
Mortgages CA
Mortgage Arrears Ratio; Canada vs Alberta
Notes:
- On 15 July, the Bank lowered the overnight rate target to 1/2 per cent.
- Total CPI inflation in Canada has been around 1 per cent; core inflation has been close to 2 per cent.
- The Bank expects real GDP growth of just over 1 per cent in 2015 and about 2 1/2 per cent in 2016 and 2017.
Resources
http://www.rbc.com/e
http://www.bankofcan
http://economicdashboard.albertacanada.com/
http://www.creb.com/
http://www.ereb.com/REALTORSAssociationOfEdmonton.html
http://www.capp.ca/Pages/default.aspx
http://homepriceindex.ca/hpi_tool_en.html
http://www.cba.ca/en/component/content/publication/69-statistics
http://www.finance.alberta.ca/aboutalberta/
http://www.statcan.gc.ca/dai-quo/
http://www.housepriceindex.ca/default.aspx?langue=EN
CND resale of homes has picked up in Toronto and Vancouver while they have declined in Calgary and Edmonton.
The price gap between WCS and WTI reached its lowest point in July. This is a big benefit to the majority of Alberta producers as
WCS is what is mostly produced in Alberta and shipped out at the US dollar rate and then converted to Canadian Dollars.
Producers are still cutting jobs or coming up with creative cutbacks to trim costs to their companies.
Bank of Canada Released its Monetary Policy report for July 2015. The key Highlights are:
- Global growth faltered in early 2015. It is expected to strengthen over the second half of 2015, averaging about 3 per cent for the
- The projection for growth in Canada in 2015 has been marked down, with real GDP estimated to have contracted modestly in
the first half of the year. Growth in Canada is projected to resume in the third quarter and begin to exceed potential again in the
fourth quarter
- The Bank anticipates that the economy will return to full capacity and inflation to 2 per cent on a sustained basis in the first half of
$-
$10.00
$20.00
$30.00
$40.00
$50.00
$60.00
$70.00
$80.00
$90.00
$100.00
$110.00
$120.00
WCS OIL PRICES
WTI OIL PRICES
WTI-WCS Price Differential
WTI and WCS Pricing and Price Differential (US$)

More Related Content

What's hot

Fvreb oct stats package 2019
Fvreb oct stats package 2019 Fvreb oct stats package 2019
Fvreb oct stats package 2019 Vicky Aulakh
 
San Francisco Market Focus August 2013
San Francisco Market Focus August 2013San Francisco Market Focus August 2013
San Francisco Market Focus August 2013Ronny Budiutama
 
Nov 2019 fvreb stats package
Nov 2019 fvreb stats packageNov 2019 fvreb stats package
Nov 2019 fvreb stats packageVicky Aulakh
 
Fvreb aug 2019 stats package
Fvreb aug 2019 stats packageFvreb aug 2019 stats package
Fvreb aug 2019 stats packageVicky Aulakh
 
San Francisco Market Focus June 2015
San Francisco Market Focus June 2015San Francisco Market Focus June 2015
San Francisco Market Focus June 2015Ronny Budiutama
 
Dec 2020 Fraser Valley Real Estate Board Package
Dec 2020 Fraser Valley Real Estate Board PackageDec 2020 Fraser Valley Real Estate Board Package
Dec 2020 Fraser Valley Real Estate Board PackageVicky Aulakh
 
2014 Market Forecast - California Association of Realtors
2014 Market Forecast - California Association of Realtors2014 Market Forecast - California Association of Realtors
2014 Market Forecast - California Association of RealtorsRonny Budiutama
 
Fvreb August 2020 Stats Package
Fvreb August 2020 Stats PackageFvreb August 2020 Stats Package
Fvreb August 2020 Stats PackageVicky Aulakh
 
San Francisco Market Focus May 2016
San Francisco Market Focus May 2016San Francisco Market Focus May 2016
San Francisco Market Focus May 2016Ronny Budiutama
 
Fraser Valley Real Estate Board Statistics Package January 2020
Fraser Valley Real Estate Board Statistics Package January 2020 Fraser Valley Real Estate Board Statistics Package January 2020
Fraser Valley Real Estate Board Statistics Package January 2020 Vicky Aulakh
 
San Francisco Market Focus April 2016
San Francisco Market Focus April 2016San Francisco Market Focus April 2016
San Francisco Market Focus April 2016Ronny Budiutama
 
Fraser Valley Real Estate Board Statistics Package Jan 2021
Fraser Valley Real Estate Board Statistics Package Jan 2021Fraser Valley Real Estate Board Statistics Package Jan 2021
Fraser Valley Real Estate Board Statistics Package Jan 2021Vicky Aulakh
 
Fvreb may 2020 stats
Fvreb may 2020 stats Fvreb may 2020 stats
Fvreb may 2020 stats Vicky Aulakh
 
FVREB July 2020 Stats
FVREB July 2020 StatsFVREB July 2020 Stats
FVREB July 2020 StatsVicky Aulakh
 
Fraser Valley Real Estate Board August 2021 Statistics
Fraser Valley Real Estate Board August 2021 Statistics Fraser Valley Real Estate Board August 2021 Statistics
Fraser Valley Real Estate Board August 2021 Statistics Vicky Aulakh
 
San Francisco Market Focus October 2014
San Francisco Market Focus October 2014San Francisco Market Focus October 2014
San Francisco Market Focus October 2014Ronny Budiutama
 
January 2018 Florida Real Estate Statistics
January 2018 Florida Real Estate Statistics January 2018 Florida Real Estate Statistics
January 2018 Florida Real Estate Statistics Matias Escobar
 
Calvert Home Mortgage Economic Report May 31 2015
Calvert Home Mortgage Economic Report May 31 2015Calvert Home Mortgage Economic Report May 31 2015
Calvert Home Mortgage Economic Report May 31 2015Keith Uthe
 
San Francisco Market Focus February 2014
San Francisco Market Focus February 2014San Francisco Market Focus February 2014
San Francisco Market Focus February 2014Ronny Budiutama
 

What's hot (19)

Fvreb oct stats package 2019
Fvreb oct stats package 2019 Fvreb oct stats package 2019
Fvreb oct stats package 2019
 
San Francisco Market Focus August 2013
San Francisco Market Focus August 2013San Francisco Market Focus August 2013
San Francisco Market Focus August 2013
 
Nov 2019 fvreb stats package
Nov 2019 fvreb stats packageNov 2019 fvreb stats package
Nov 2019 fvreb stats package
 
Fvreb aug 2019 stats package
Fvreb aug 2019 stats packageFvreb aug 2019 stats package
Fvreb aug 2019 stats package
 
San Francisco Market Focus June 2015
San Francisco Market Focus June 2015San Francisco Market Focus June 2015
San Francisco Market Focus June 2015
 
Dec 2020 Fraser Valley Real Estate Board Package
Dec 2020 Fraser Valley Real Estate Board PackageDec 2020 Fraser Valley Real Estate Board Package
Dec 2020 Fraser Valley Real Estate Board Package
 
2014 Market Forecast - California Association of Realtors
2014 Market Forecast - California Association of Realtors2014 Market Forecast - California Association of Realtors
2014 Market Forecast - California Association of Realtors
 
Fvreb August 2020 Stats Package
Fvreb August 2020 Stats PackageFvreb August 2020 Stats Package
Fvreb August 2020 Stats Package
 
San Francisco Market Focus May 2016
San Francisco Market Focus May 2016San Francisco Market Focus May 2016
San Francisco Market Focus May 2016
 
Fraser Valley Real Estate Board Statistics Package January 2020
Fraser Valley Real Estate Board Statistics Package January 2020 Fraser Valley Real Estate Board Statistics Package January 2020
Fraser Valley Real Estate Board Statistics Package January 2020
 
San Francisco Market Focus April 2016
San Francisco Market Focus April 2016San Francisco Market Focus April 2016
San Francisco Market Focus April 2016
 
Fraser Valley Real Estate Board Statistics Package Jan 2021
Fraser Valley Real Estate Board Statistics Package Jan 2021Fraser Valley Real Estate Board Statistics Package Jan 2021
Fraser Valley Real Estate Board Statistics Package Jan 2021
 
Fvreb may 2020 stats
Fvreb may 2020 stats Fvreb may 2020 stats
Fvreb may 2020 stats
 
FVREB July 2020 Stats
FVREB July 2020 StatsFVREB July 2020 Stats
FVREB July 2020 Stats
 
Fraser Valley Real Estate Board August 2021 Statistics
Fraser Valley Real Estate Board August 2021 Statistics Fraser Valley Real Estate Board August 2021 Statistics
Fraser Valley Real Estate Board August 2021 Statistics
 
San Francisco Market Focus October 2014
San Francisco Market Focus October 2014San Francisco Market Focus October 2014
San Francisco Market Focus October 2014
 
January 2018 Florida Real Estate Statistics
January 2018 Florida Real Estate Statistics January 2018 Florida Real Estate Statistics
January 2018 Florida Real Estate Statistics
 
Calvert Home Mortgage Economic Report May 31 2015
Calvert Home Mortgage Economic Report May 31 2015Calvert Home Mortgage Economic Report May 31 2015
Calvert Home Mortgage Economic Report May 31 2015
 
San Francisco Market Focus February 2014
San Francisco Market Focus February 2014San Francisco Market Focus February 2014
San Francisco Market Focus February 2014
 

Similar to Calvert Home Mortgage's Real Estate and Economic Report for Sept 2015

Calvert Home Mortgage Real Estate & Economic Report December 2015
Calvert Home Mortgage Real Estate & Economic Report December 2015Calvert Home Mortgage Real Estate & Economic Report December 2015
Calvert Home Mortgage Real Estate & Economic Report December 2015Keith Uthe
 
November 2015 Home Sales Report
November 2015 Home Sales ReportNovember 2015 Home Sales Report
November 2015 Home Sales ReportSheryl Schroeder
 
November 2015 Home Sales Report
November 2015 Home Sales ReportNovember 2015 Home Sales Report
November 2015 Home Sales ReportPhil Sveum
 
October 2015 Home Sales Report
October 2015 Home Sales ReportOctober 2015 Home Sales Report
October 2015 Home Sales ReportPhil Sveum
 
2015 10 oct homes sales report
2015 10 oct homes sales report2015 10 oct homes sales report
2015 10 oct homes sales reportSheryl Schroeder
 
Crested Butte Real Estate Market Report - Ski Season 2014-2015
Crested Butte Real Estate Market Report - Ski Season 2014-2015Crested Butte Real Estate Market Report - Ski Season 2014-2015
Crested Butte Real Estate Market Report - Ski Season 2014-2015Chris Kopf
 
The Do Good Report - Wrightsville Beach 1st Quarter 2013
The Do Good Report - Wrightsville Beach 1st Quarter 2013The Do Good Report - Wrightsville Beach 1st Quarter 2013
The Do Good Report - Wrightsville Beach 1st Quarter 2013DoGoodRealEstate
 
TRREB MARKET REPORT - APRIL 2020
TRREB MARKET REPORT - APRIL 2020TRREB MARKET REPORT - APRIL 2020
TRREB MARKET REPORT - APRIL 2020Shawn Venasse
 
San Francisco Market Focus July 2015
San Francisco Market Focus July 2015San Francisco Market Focus July 2015
San Francisco Market Focus July 2015Ronny Budiutama
 
Vancouver real estate stats package, August 2013
Vancouver real estate stats package, August 2013Vancouver real estate stats package, August 2013
Vancouver real estate stats package, August 2013Matt Collinge
 
2013 04 market watch
2013 04 market watch2013 04 market watch
2013 04 market watchChaba Tamasi
 
October 2016 Home Sales Report
October 2016 Home Sales ReportOctober 2016 Home Sales Report
October 2016 Home Sales ReportPhil Sveum
 
Annie Williams Real Estate Report - October 2021
Annie Williams Real Estate Report - October 2021Annie Williams Real Estate Report - October 2021
Annie Williams Real Estate Report - October 2021Annie Williams
 
Annie Williams 2016 Annual Real Estate Report
Annie Williams 2016 Annual Real Estate ReportAnnie Williams 2016 Annual Real Estate Report
Annie Williams 2016 Annual Real Estate ReportAnnie Williams
 
Annie Williams Real Estate Report - November 2020
Annie Williams Real Estate Report - November 2020Annie Williams Real Estate Report - November 2020
Annie Williams Real Estate Report - November 2020Jon Weaver
 
San Francisco Market Focus August 2015
San Francisco Market Focus August 2015San Francisco Market Focus August 2015
San Francisco Market Focus August 2015Ronny Budiutama
 
San Francisco Market Focus October 2015
San Francisco Market Focus October 2015San Francisco Market Focus October 2015
San Francisco Market Focus October 2015Ronny Budiutama
 

Similar to Calvert Home Mortgage's Real Estate and Economic Report for Sept 2015 (20)

Calvert Home Mortgage Real Estate & Economic Report December 2015
Calvert Home Mortgage Real Estate & Economic Report December 2015Calvert Home Mortgage Real Estate & Economic Report December 2015
Calvert Home Mortgage Real Estate & Economic Report December 2015
 
November 2015 Home Sales Report
November 2015 Home Sales ReportNovember 2015 Home Sales Report
November 2015 Home Sales Report
 
November 2015 Home Sales Report
November 2015 Home Sales ReportNovember 2015 Home Sales Report
November 2015 Home Sales Report
 
October 2015 Home Sales Report
October 2015 Home Sales ReportOctober 2015 Home Sales Report
October 2015 Home Sales Report
 
2015 10 oct homes sales report
2015 10 oct homes sales report2015 10 oct homes sales report
2015 10 oct homes sales report
 
Crested Butte Real Estate Market Report - Ski Season 2014-2015
Crested Butte Real Estate Market Report - Ski Season 2014-2015Crested Butte Real Estate Market Report - Ski Season 2014-2015
Crested Butte Real Estate Market Report - Ski Season 2014-2015
 
The Do Good Report - Wrightsville Beach 1st Quarter 2013
The Do Good Report - Wrightsville Beach 1st Quarter 2013The Do Good Report - Wrightsville Beach 1st Quarter 2013
The Do Good Report - Wrightsville Beach 1st Quarter 2013
 
TRREB MARKET REPORT - APRIL 2020
TRREB MARKET REPORT - APRIL 2020TRREB MARKET REPORT - APRIL 2020
TRREB MARKET REPORT - APRIL 2020
 
San Francisco Market Focus July 2015
San Francisco Market Focus July 2015San Francisco Market Focus July 2015
San Francisco Market Focus July 2015
 
Vancouver real estate stats package, August 2013
Vancouver real estate stats package, August 2013Vancouver real estate stats package, August 2013
Vancouver real estate stats package, August 2013
 
September Realtor Report
September Realtor ReportSeptember Realtor Report
September Realtor Report
 
2013 04 market watch
2013 04 market watch2013 04 market watch
2013 04 market watch
 
Southwest California Realtor Report for September 2019
Southwest California Realtor Report for September 2019Southwest California Realtor Report for September 2019
Southwest California Realtor Report for September 2019
 
October 2016 Home Sales Report
October 2016 Home Sales ReportOctober 2016 Home Sales Report
October 2016 Home Sales Report
 
Annie Williams Real Estate Report - October 2021
Annie Williams Real Estate Report - October 2021Annie Williams Real Estate Report - October 2021
Annie Williams Real Estate Report - October 2021
 
1 realtor report
1 realtor report1 realtor report
1 realtor report
 
Annie Williams 2016 Annual Real Estate Report
Annie Williams 2016 Annual Real Estate ReportAnnie Williams 2016 Annual Real Estate Report
Annie Williams 2016 Annual Real Estate Report
 
Annie Williams Real Estate Report - November 2020
Annie Williams Real Estate Report - November 2020Annie Williams Real Estate Report - November 2020
Annie Williams Real Estate Report - November 2020
 
San Francisco Market Focus August 2015
San Francisco Market Focus August 2015San Francisco Market Focus August 2015
San Francisco Market Focus August 2015
 
San Francisco Market Focus October 2015
San Francisco Market Focus October 2015San Francisco Market Focus October 2015
San Francisco Market Focus October 2015
 

Recently uploaded

Log your LOA pain with Pension Lab's brilliant campaign
Log your LOA pain with Pension Lab's brilliant campaignLog your LOA pain with Pension Lab's brilliant campaign
Log your LOA pain with Pension Lab's brilliant campaignHenry Tapper
 
Interimreport1 January–31 March2024 Elo Mutual Pension Insurance Company
Interimreport1 January–31 March2024 Elo Mutual Pension Insurance CompanyInterimreport1 January–31 March2024 Elo Mutual Pension Insurance Company
Interimreport1 January–31 March2024 Elo Mutual Pension Insurance CompanyTyöeläkeyhtiö Elo
 
The Economic History of the U.S. Lecture 19.pdf
The Economic History of the U.S. Lecture 19.pdfThe Economic History of the U.S. Lecture 19.pdf
The Economic History of the U.S. Lecture 19.pdfGale Pooley
 
05_Annelore Lenoir_Docbyte_MeetupDora&Cybersecurity.pptx
05_Annelore Lenoir_Docbyte_MeetupDora&Cybersecurity.pptx05_Annelore Lenoir_Docbyte_MeetupDora&Cybersecurity.pptx
05_Annelore Lenoir_Docbyte_MeetupDora&Cybersecurity.pptxFinTech Belgium
 
Independent Call Girl Number in Kurla Mumbai📲 Pooja Nehwal 9892124323 💞 Full ...
Independent Call Girl Number in Kurla Mumbai📲 Pooja Nehwal 9892124323 💞 Full ...Independent Call Girl Number in Kurla Mumbai📲 Pooja Nehwal 9892124323 💞 Full ...
Independent Call Girl Number in Kurla Mumbai📲 Pooja Nehwal 9892124323 💞 Full ...Pooja Nehwal
 
High Class Call Girls Nashik Maya 7001305949 Independent Escort Service Nashik
High Class Call Girls Nashik Maya 7001305949 Independent Escort Service NashikHigh Class Call Girls Nashik Maya 7001305949 Independent Escort Service Nashik
High Class Call Girls Nashik Maya 7001305949 Independent Escort Service NashikCall Girls in Nagpur High Profile
 
fca-bsps-decision-letter-redacted (1).pdf
fca-bsps-decision-letter-redacted (1).pdffca-bsps-decision-letter-redacted (1).pdf
fca-bsps-decision-letter-redacted (1).pdfHenry Tapper
 
Lundin Gold April 2024 Corporate Presentation v4.pdf
Lundin Gold April 2024 Corporate Presentation v4.pdfLundin Gold April 2024 Corporate Presentation v4.pdf
Lundin Gold April 2024 Corporate Presentation v4.pdfAdnet Communications
 
call girls in Nand Nagri (DELHI) 🔝 >༒9953330565🔝 genuine Escort Service 🔝✔️✔️
call girls in  Nand Nagri (DELHI) 🔝 >༒9953330565🔝 genuine Escort Service 🔝✔️✔️call girls in  Nand Nagri (DELHI) 🔝 >༒9953330565🔝 genuine Escort Service 🔝✔️✔️
call girls in Nand Nagri (DELHI) 🔝 >༒9953330565🔝 genuine Escort Service 🔝✔️✔️9953056974 Low Rate Call Girls In Saket, Delhi NCR
 
Bladex Earnings Call Presentation 1Q2024
Bladex Earnings Call Presentation 1Q2024Bladex Earnings Call Presentation 1Q2024
Bladex Earnings Call Presentation 1Q2024Bladex
 
Andheri Call Girls In 9825968104 Mumbai Hot Models
Andheri Call Girls In 9825968104 Mumbai Hot ModelsAndheri Call Girls In 9825968104 Mumbai Hot Models
Andheri Call Girls In 9825968104 Mumbai Hot Modelshematsharma006
 
Dharavi Russian callg Girls, { 09892124323 } || Call Girl In Mumbai ...
Dharavi Russian callg Girls, { 09892124323 } || Call Girl In Mumbai ...Dharavi Russian callg Girls, { 09892124323 } || Call Girl In Mumbai ...
Dharavi Russian callg Girls, { 09892124323 } || Call Girl In Mumbai ...Pooja Nehwal
 
VIP Call Girls Thane Sia 8617697112 Independent Escort Service Thane
VIP Call Girls Thane Sia 8617697112 Independent Escort Service ThaneVIP Call Girls Thane Sia 8617697112 Independent Escort Service Thane
VIP Call Girls Thane Sia 8617697112 Independent Escort Service ThaneCall girls in Ahmedabad High profile
 
Quarter 4- Module 3 Principles of Marketing
Quarter 4- Module 3 Principles of MarketingQuarter 4- Module 3 Principles of Marketing
Quarter 4- Module 3 Principles of MarketingMaristelaRamos12
 
Malad Call Girl in Services 9892124323 | ₹,4500 With Room Free Delivery
Malad Call Girl in Services  9892124323 | ₹,4500 With Room Free DeliveryMalad Call Girl in Services  9892124323 | ₹,4500 With Room Free Delivery
Malad Call Girl in Services 9892124323 | ₹,4500 With Room Free DeliveryPooja Nehwal
 
Call Girls Service Nagpur Maya Call 7001035870 Meet With Nagpur Escorts
Call Girls Service Nagpur Maya Call 7001035870 Meet With Nagpur EscortsCall Girls Service Nagpur Maya Call 7001035870 Meet With Nagpur Escorts
Call Girls Service Nagpur Maya Call 7001035870 Meet With Nagpur Escortsranjana rawat
 
02_Fabio Colombo_Accenture_MeetupDora&Cybersecurity.pptx
02_Fabio Colombo_Accenture_MeetupDora&Cybersecurity.pptx02_Fabio Colombo_Accenture_MeetupDora&Cybersecurity.pptx
02_Fabio Colombo_Accenture_MeetupDora&Cybersecurity.pptxFinTech Belgium
 
Call Girls In Yusuf Sarai Women Seeking Men 9654467111
Call Girls In Yusuf Sarai Women Seeking Men 9654467111Call Girls In Yusuf Sarai Women Seeking Men 9654467111
Call Girls In Yusuf Sarai Women Seeking Men 9654467111Sapana Sha
 
Solution Manual for Financial Accounting, 11th Edition by Robert Libby, Patri...
Solution Manual for Financial Accounting, 11th Edition by Robert Libby, Patri...Solution Manual for Financial Accounting, 11th Edition by Robert Libby, Patri...
Solution Manual for Financial Accounting, 11th Edition by Robert Libby, Patri...ssifa0344
 
Russian Call Girls In Gtb Nagar (Delhi) 9711199012 💋✔💕😘 Naughty Call Girls Se...
Russian Call Girls In Gtb Nagar (Delhi) 9711199012 💋✔💕😘 Naughty Call Girls Se...Russian Call Girls In Gtb Nagar (Delhi) 9711199012 💋✔💕😘 Naughty Call Girls Se...
Russian Call Girls In Gtb Nagar (Delhi) 9711199012 💋✔💕😘 Naughty Call Girls Se...shivangimorya083
 

Recently uploaded (20)

Log your LOA pain with Pension Lab's brilliant campaign
Log your LOA pain with Pension Lab's brilliant campaignLog your LOA pain with Pension Lab's brilliant campaign
Log your LOA pain with Pension Lab's brilliant campaign
 
Interimreport1 January–31 March2024 Elo Mutual Pension Insurance Company
Interimreport1 January–31 March2024 Elo Mutual Pension Insurance CompanyInterimreport1 January–31 March2024 Elo Mutual Pension Insurance Company
Interimreport1 January–31 March2024 Elo Mutual Pension Insurance Company
 
The Economic History of the U.S. Lecture 19.pdf
The Economic History of the U.S. Lecture 19.pdfThe Economic History of the U.S. Lecture 19.pdf
The Economic History of the U.S. Lecture 19.pdf
 
05_Annelore Lenoir_Docbyte_MeetupDora&Cybersecurity.pptx
05_Annelore Lenoir_Docbyte_MeetupDora&Cybersecurity.pptx05_Annelore Lenoir_Docbyte_MeetupDora&Cybersecurity.pptx
05_Annelore Lenoir_Docbyte_MeetupDora&Cybersecurity.pptx
 
Independent Call Girl Number in Kurla Mumbai📲 Pooja Nehwal 9892124323 💞 Full ...
Independent Call Girl Number in Kurla Mumbai📲 Pooja Nehwal 9892124323 💞 Full ...Independent Call Girl Number in Kurla Mumbai📲 Pooja Nehwal 9892124323 💞 Full ...
Independent Call Girl Number in Kurla Mumbai📲 Pooja Nehwal 9892124323 💞 Full ...
 
High Class Call Girls Nashik Maya 7001305949 Independent Escort Service Nashik
High Class Call Girls Nashik Maya 7001305949 Independent Escort Service NashikHigh Class Call Girls Nashik Maya 7001305949 Independent Escort Service Nashik
High Class Call Girls Nashik Maya 7001305949 Independent Escort Service Nashik
 
fca-bsps-decision-letter-redacted (1).pdf
fca-bsps-decision-letter-redacted (1).pdffca-bsps-decision-letter-redacted (1).pdf
fca-bsps-decision-letter-redacted (1).pdf
 
Lundin Gold April 2024 Corporate Presentation v4.pdf
Lundin Gold April 2024 Corporate Presentation v4.pdfLundin Gold April 2024 Corporate Presentation v4.pdf
Lundin Gold April 2024 Corporate Presentation v4.pdf
 
call girls in Nand Nagri (DELHI) 🔝 >༒9953330565🔝 genuine Escort Service 🔝✔️✔️
call girls in  Nand Nagri (DELHI) 🔝 >༒9953330565🔝 genuine Escort Service 🔝✔️✔️call girls in  Nand Nagri (DELHI) 🔝 >༒9953330565🔝 genuine Escort Service 🔝✔️✔️
call girls in Nand Nagri (DELHI) 🔝 >༒9953330565🔝 genuine Escort Service 🔝✔️✔️
 
Bladex Earnings Call Presentation 1Q2024
Bladex Earnings Call Presentation 1Q2024Bladex Earnings Call Presentation 1Q2024
Bladex Earnings Call Presentation 1Q2024
 
Andheri Call Girls In 9825968104 Mumbai Hot Models
Andheri Call Girls In 9825968104 Mumbai Hot ModelsAndheri Call Girls In 9825968104 Mumbai Hot Models
Andheri Call Girls In 9825968104 Mumbai Hot Models
 
Dharavi Russian callg Girls, { 09892124323 } || Call Girl In Mumbai ...
Dharavi Russian callg Girls, { 09892124323 } || Call Girl In Mumbai ...Dharavi Russian callg Girls, { 09892124323 } || Call Girl In Mumbai ...
Dharavi Russian callg Girls, { 09892124323 } || Call Girl In Mumbai ...
 
VIP Call Girls Thane Sia 8617697112 Independent Escort Service Thane
VIP Call Girls Thane Sia 8617697112 Independent Escort Service ThaneVIP Call Girls Thane Sia 8617697112 Independent Escort Service Thane
VIP Call Girls Thane Sia 8617697112 Independent Escort Service Thane
 
Quarter 4- Module 3 Principles of Marketing
Quarter 4- Module 3 Principles of MarketingQuarter 4- Module 3 Principles of Marketing
Quarter 4- Module 3 Principles of Marketing
 
Malad Call Girl in Services 9892124323 | ₹,4500 With Room Free Delivery
Malad Call Girl in Services  9892124323 | ₹,4500 With Room Free DeliveryMalad Call Girl in Services  9892124323 | ₹,4500 With Room Free Delivery
Malad Call Girl in Services 9892124323 | ₹,4500 With Room Free Delivery
 
Call Girls Service Nagpur Maya Call 7001035870 Meet With Nagpur Escorts
Call Girls Service Nagpur Maya Call 7001035870 Meet With Nagpur EscortsCall Girls Service Nagpur Maya Call 7001035870 Meet With Nagpur Escorts
Call Girls Service Nagpur Maya Call 7001035870 Meet With Nagpur Escorts
 
02_Fabio Colombo_Accenture_MeetupDora&Cybersecurity.pptx
02_Fabio Colombo_Accenture_MeetupDora&Cybersecurity.pptx02_Fabio Colombo_Accenture_MeetupDora&Cybersecurity.pptx
02_Fabio Colombo_Accenture_MeetupDora&Cybersecurity.pptx
 
Call Girls In Yusuf Sarai Women Seeking Men 9654467111
Call Girls In Yusuf Sarai Women Seeking Men 9654467111Call Girls In Yusuf Sarai Women Seeking Men 9654467111
Call Girls In Yusuf Sarai Women Seeking Men 9654467111
 
Solution Manual for Financial Accounting, 11th Edition by Robert Libby, Patri...
Solution Manual for Financial Accounting, 11th Edition by Robert Libby, Patri...Solution Manual for Financial Accounting, 11th Edition by Robert Libby, Patri...
Solution Manual for Financial Accounting, 11th Edition by Robert Libby, Patri...
 
Russian Call Girls In Gtb Nagar (Delhi) 9711199012 💋✔💕😘 Naughty Call Girls Se...
Russian Call Girls In Gtb Nagar (Delhi) 9711199012 💋✔💕😘 Naughty Call Girls Se...Russian Call Girls In Gtb Nagar (Delhi) 9711199012 💋✔💕😘 Naughty Call Girls Se...
Russian Call Girls In Gtb Nagar (Delhi) 9711199012 💋✔💕😘 Naughty Call Girls Se...
 

Calvert Home Mortgage's Real Estate and Economic Report for Sept 2015

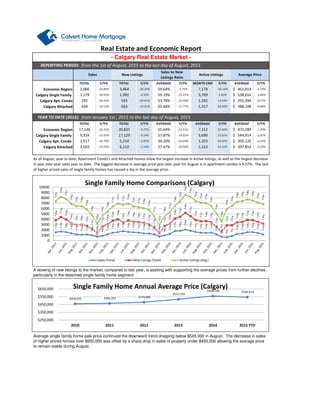
  • 1. Economic Region Calgary Single Family Calgary Apt. Condo Calgary Attached 2015 Economic Region Calgary Single Family Calgary Apt. Condo Calgary Attached As of August, year to date, Apartment Condo's and Attached homes show the largest increase in Active listings, as well as the largest decrease in year over year sales year to date. The biggest decrease in average price year over year for August is in apartment condos is 9.57%. The lack of higher priced sales of single family homes has caused a dip in the average price. Average single family home sale price continued the downward trend dropping below $545,000 in August. The decrease in sales of higher priced homes over $650,000 was offset by a sharp drop in sales of property under $450,000 allowing the average price to remain stable during August. -4.25% 3,503 -23.25% 6,110 -2.54% 57.47% -20.66% 1,313 55.41% 397,853$ -2.20% 2,517 -30.70% 5,214 -5.87% 49.10% -24.69% 1,353 39.92% 305,126$ -1.30% AVERAGE Y/Y% AVERAGE Y/Y% 9,924 -22.97% 17,129 -9.14% 57.87% -14.91% 3,690 25.65% 544,914$ -2.05% 17,146 -24.31% 30,835 -9.77% 55.64% -15.51% 7,152 22.42% 472,289$ 388,198$ -6.88% YEAR TO DATE (2015): from January 1st , 2015 to the last day of August, 2015 TOTAL Y/Y% TOTAL Y/Y% AVERAGE Y/Y% Real Estate and Economic Report Sales New Listings Sales to New Listings Ratio Active Listings Average Price Y/Y% AVERAGE Y/Y%TOTAL Y/Y% TOTAL Y/Y% AVERAGE Y/Y% 7,178 -10.14% 461,814$ -2.19%2,066 -9.57% 434 -24.13% from the 1st of August, 2015 to the last day of August, 2015 -24.85% 3,464 -20.26% 59.64% -5.75% 1,179 -20.93% 1,992 -6.35% 59.19% -15.57% - Calgary Real Estate Market - REPORTING PERIOD: A slowing of new listings to the market, compared to last year, is assiting with supporting the average prices from further declines, particularly in the detached single family home segment. 3,709 5.43% 538,016$ -3.46% 292 -40.53% 543 -20.61% 53.78% -25.09% 1,292 13.63% 291,394$ MONTH END 663 -14.01% 65.46% -11.77% 1,317 28.49% $459,035 $465,202 $479,880 $517,333 $558,738 $544,914 $250,000 $350,000 $450,000 $550,000 $650,000 2010 2011 2012 2013 2014 2015 YTD Single Family Home Annual Average Price (Calgary) 0 1000 2000 3000 4000 5000 6000 7000 8000 9000 10000 Single Family Home Comparisons (Calgary) Sales (Total) New Listings (Total) Active Listings (Avg.)
  • 2. Total Residential Single Family Apartment Condo Duplex Row House 2015 Total Residential Single Family Apartment Condo Duplex/Row House The spread between new listings and total sales continued to increase in August. Duplex/Row Houses continue to see the largest percentage increase in new listings for August year over year and year to date followed by apartment condominiums. Duplex/Row Houses have managed to show the highest increase in average sale price year over year to date. 1,003 2.66% 1,808 31.97% 55.50% -22.11% 356,798$ 4.10% 7,130 -10.99% 13,956 12.33% 50.00% -21.10% 438,553$ 1.81% 3,371 -14.81% 7,401 17.27% 44.88% -27.47% 252,896$ 1.64% YEAR TO DATE (2015): from January 1st, 2015 to the last day of August, 2015 AVERAGE Y/Y% 11,716 -10.33% 23,724 14.68% 48.36% -22.94% TOTAL Y/Y% 372,429$ 2.34% TOTAL Y/Y% AVERAGE Y/Y% 433 -13.40% 897 23.55% 48.00% -30.43% 254,672$ -2.79% 122 -7.58% 221 55.63% 55.00% -40.86% 354,409$ 1.32% 1.03% 884 -13.25% 1,741 28.58% 51.00% -32.00% 439,829$ 1.82% 1,465 -13.72% 2,926 26.89% 50.07% -32.00% 372,256$ TOTAL Y/Y% TOTAL Y/Y% AVERAGE Y/Y% AVERAGE REPORTING PERIOD: from the 1st of August, 2015 to the last day of August, 2015 Sales New Listings Y/Y% Sales to New Listings Ratio Average Price - Edmonton Real Estate Market - The days on market are managing to remain steady around 42 days on market for single family homes. Good properties priced appropriately continue to sell quickly. Days on market are much higher in the SW(41), SE(40) compared to NW(36) & NE(31). August saw a large drop in sales for property priced between $200,000 and $400,000. Previously from January to July this price range had not seen this large of a drop in sales. This is reflective of the large drop in year over year sales of Apartment Condominiums and Attached homes which tend to make up the majority of this price range. 0 10 20 30 40 50 Single Family Home Average Days on Market (Calgary) 0 50 100 150 200 250 300 350 400 > $100 $100 - $199 $200 - $299 $300 -$ 349 $350 - $399 $400 - $449 $450 - $499 $500 - $549 $550 - $599 $600 - $649 $650 - $699 $700 - $799 $800 - $899 $900 - $999 $1M + Aug. 2014 Aug. 2015 Number of Sales by Price Range (Calgary Metro)
  • 3. Following a drop in average days on market from 58 to 44 between January to March 2015 we have now seen a steady increase since then to 54 average days on market. Apartment condos are the highest at 56 average days on market. The Calgary Home Price index has been in mostly a downward trend since July 2014 where as the Edmonton home Price Index continued to increase until its recent decline in July. Since 2005 the TSX100 only increased 50% compared to the 110% for Calgary and the 80% for Edmonton showing that real estate continues to be a strong investment. The sharp drop in sales for August was not matched with a similar drop in new listings. A break from the trend of previous years. If the new listings continue to stay on the same trend into the fall expect that the average price will begin to decrease. Since 2011 the average home price in Edmonton has increased an average of just over 4% per year since 2011 with a high of 5.4% between 2013 and 2014. The current YTD increase over 2014 is 1.58%. $383,226 $379,485 $392,446 $409,438 $431,741 $438,553 $340,000 $360,000 $380,000 $400,000 $420,000 $440,000 $460,000 2010 2011 2012 2013 2014 2015 YTD Single Family Home Annual Average Price (Edmonton) 1,084 1,264 1,136 941 854 773 782 623 419 528 648 923 1,022 1,179 1,198 1,125 983 857 863 673 436 485 747 917 1,147 1,213 1,324 1,158 1,019 967 850 717 439 390 547 876 1,001 1,078 1,243 1,111 884 1,663 1,943 1,627 1,455 1,380 1,266 1,082 769 409 955 1,115 1,467 1,569 1,911 1,586 1,491 1,349 1,268 1,059 783 415 1,070 1,082 1,585 1,818 2,085 1,829 1,601 1,354 1,337 1,256 794 534 1,298 1,428 1,883 1,964 1,974 1,886 1,782 1,741 0 500 1,000 1,500 2,000 2,500 Single Family Home Comparisons (Edmonton) Sales (Total) New Listings (Total) 0 10 20 30 40 50 60 Average Days on Market (Edmonton Metro) 100 125 150 175 200 Calgary Home Price Index Edmonton Home Price Index Home Price Index Comparison
  • 4. Alberta Canada Unemployment Rate Jul-15 Retail Trade Jun-15 Total Mortgages Jun-15 The number of total mortgages in Alberta The number of total mortgages in Alberta has continued to increase, however, number and ratio of mortgage arrears in 2015 has been lower on average than the previous 4 years even with a slight increase in May and June. Employees have continued to earn more than they did at this time last year, however average weekly earnings are down since they peaked in February and March this year. Reduced overtime hours in the energy sector and cutbacks are a key factor. 2.40% 4.40% Weekly Earnings Jun-15 2.0% (F Jan/15) 0.8% (F Mar/15) -0.80% -0.50% Q1 Q2 TOTAL 2014 2014 ATB (F)Alberta 2015 Canada 2015 in Alberta in Alberta 6.00% Mortgages 90 day Arrears June 15 in Canada in Canada 571,065 4,668,787 -3.73%in Alberta 0.34% in Canada -0.13% 7.00% 10.00% 1.71% Housing starts (000's) Aug-15 0.19% in Canada 956.48$ 12,656 -4.58% 1.91% 1,535 1,153.35$ -14.63%in Alberta in Alberta in Canada 1.41% 0.69% 21.67% Real GDP Growth Annual Rate Y/Y% *the following information is based on current available data from: http://economicdashboard.albertacanada.com/, www.statcan.gc.ca/dai-quo/ and RBC Economic Outlook,http://www.cba.ca/en/component/content/publication/69-statistics, http://www.atb.com/SiteCollectionDocuments Real GDP Growth TOTAL Y/Y% 7,723 2.17% Apr-15 Net Migration to AB 35.61 -19.22% - Alberta Economic Indicators - $990.98 $1,034.17 $1,070.47 $1,107.97 $1,149.18 $1,145.90 $900 $1,000 $1,100 $1,200 2010 2011 2012 2013 2014 2015 YTD Alberta's Average Weekly Earnings 0.20% 0.23% 0.25% 0.28% 0.30% 0.33% 0.35% 0.38% 0.40% M o r t g a g e s % of Arrears to Total Number of Mortgages AB % of Arrears to Total Number of Mortgages CA Mortgage Arrears Ratio; Canada vs Alberta
  • 5. Notes: - On 15 July, the Bank lowered the overnight rate target to 1/2 per cent. - Total CPI inflation in Canada has been around 1 per cent; core inflation has been close to 2 per cent. - The Bank expects real GDP growth of just over 1 per cent in 2015 and about 2 1/2 per cent in 2016 and 2017. Resources http://www.rbc.com/e http://www.bankofcan http://economicdashboard.albertacanada.com/ http://www.creb.com/ http://www.ereb.com/REALTORSAssociationOfEdmonton.html http://www.capp.ca/Pages/default.aspx http://homepriceindex.ca/hpi_tool_en.html http://www.cba.ca/en/component/content/publication/69-statistics http://www.finance.alberta.ca/aboutalberta/ http://www.statcan.gc.ca/dai-quo/ http://www.housepriceindex.ca/default.aspx?langue=EN CND resale of homes has picked up in Toronto and Vancouver while they have declined in Calgary and Edmonton. The price gap between WCS and WTI reached its lowest point in July. This is a big benefit to the majority of Alberta producers as WCS is what is mostly produced in Alberta and shipped out at the US dollar rate and then converted to Canadian Dollars. Producers are still cutting jobs or coming up with creative cutbacks to trim costs to their companies. Bank of Canada Released its Monetary Policy report for July 2015. The key Highlights are: - Global growth faltered in early 2015. It is expected to strengthen over the second half of 2015, averaging about 3 per cent for the - The projection for growth in Canada in 2015 has been marked down, with real GDP estimated to have contracted modestly in the first half of the year. Growth in Canada is projected to resume in the third quarter and begin to exceed potential again in the fourth quarter - The Bank anticipates that the economy will return to full capacity and inflation to 2 per cent on a sustained basis in the first half of $- $10.00 $20.00 $30.00 $40.00 $50.00 $60.00 $70.00 $80.00 $90.00 $100.00 $110.00 $120.00 WCS OIL PRICES WTI OIL PRICES WTI-WCS Price Differential WTI and WCS Pricing and Price Differential (US$)