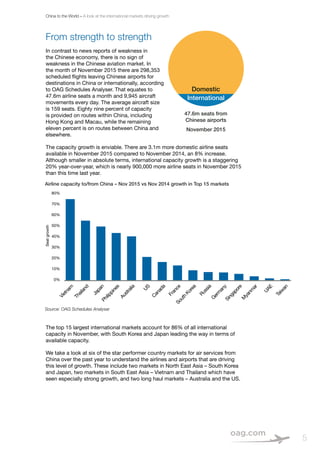
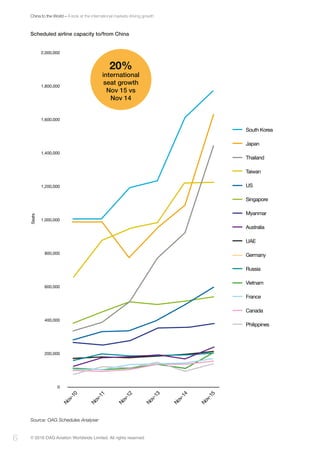
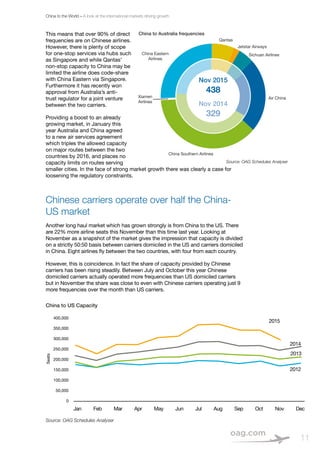
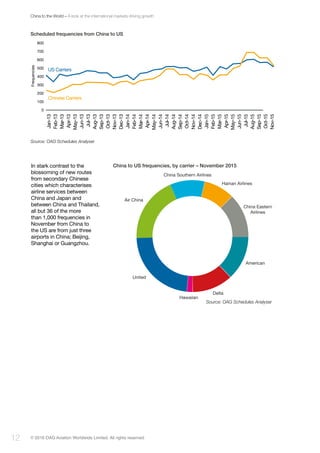
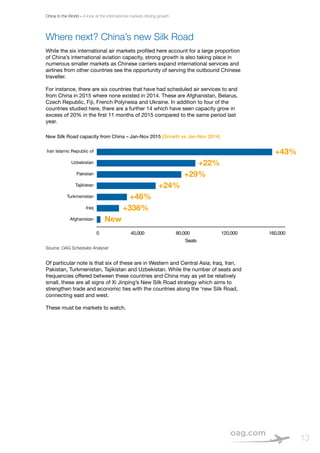
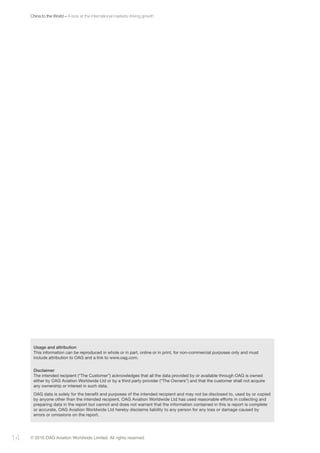
1
connecting the
world of travel
China to the World
A look at the international
markets driving growth
China to the World – A look at the international markets driving growth
© 2016 OAG Aviation Worldwide Limited. All rights reserved2
China to the World – A look at the international markets driving growth
3
Contents
Introduction	4
From strength to strength	 5
South Korea - The star performer	 7
Dramatic increase in routes to Japan	 7
Vietnam becomes China’s fastest growing market 	 8
Thailand benefits from services from secondary airports	 9
Chinese airlines strengthen position to Australia	 10
Chinese carriers operate over half the China-US market	 11
Where next? China’s new Silk Road	 13
© 2016 OAG Aviation Worldwide Limited. All rights reserved4 © 2016 OAG Aviation Worldwide Limited. All rights reserved4
China to the World – A look at the international markets driving growth
China to
the World
A look at the
international markets
driving growth
______________
Chinese President Xi Jinping has been busy travelling the world this year, making
numerous official visits overseas and attending summits and meetings. This
reflects China’s status as the world’s largest trading nation and the outward
looking nature of the current Chinese leadership. We know trade discussions often
include commitments to increase air services on a bilateral basis; in September
the visit of India’s Prime Minister Modi to California was swiftly followed by the
announcement of a new Air India service between New Delhi and San Francisco.
In October the Chinese State visit to the UK included the announcement of a new
service operated by Hainan Airlines between Manchester and Beijing.
With trade being a high priority for discussions on President Xi’s trips, it’s timely to
look at the growth of international air travel to and from China.
China to the World – A look at the international markets driving growth
5
Airline capacity to/from China – Nov 2015 vs Nov 2014 growth in Top 15 markets
Source: OAG Schedules Analyser
80%
70%
60%
50%
40%
30%
20%
10%
0%
Vietnam
US
South
Korea
Japan
France
M
yanm
ar
Thailand
Canada
G
erm
any
Philippines
Russia
UAE
Australia
Singapore
Taiw
an
Seatgrowth
Domestic
47.6m seats from
Chinese airports
November 2015
International
From strength to strength
In contrast to news reports of weakness in
the Chinese economy, there is no sign of
weakness in the Chinese aviation market. In
the month of November 2015 there are 298,353
scheduled flights leaving Chinese airports for
destinations in China or internationally, according
to OAG Schedules Analyser. That equates to
47.6m airline seats a month and 9,945 aircraft
movements every day. The average aircraft size
is 159 seats. Eighty nine percent of capacity
is provided on routes within China, including
Hong Kong and Macau, while the remaining
eleven percent is on routes between China and
elsewhere.
The capacity growth is enviable. There are 3.1m more domestic airline seats
available in November 2015 compared to November 2014, an 8% increase.
Although smaller in absolute terms, international capacity growth is a staggering
20% year-over-year, which is nearly 900,000 more airline seats in November 2015
than this time last year.
The top 15 largest international markets account for 86% of all international
capacity in November, with South Korea and Japan leading the way in terms of
available capacity.
We take a look at six of the star performer country markets for air services from
China over the past year to understand the airlines and airports that are driving
this level of growth. These include two markets in North East Asia – South Korea
and Japan, two markets in South East Asia – Vietnam and Thailand which have
seen especially strong growth, and two long haul markets – Australia and the US.
China to the World – A look at the international markets driving growth
© 2016 OAG Aviation Worldwide Limited. All rights reserved6
Scheduled airline capacity to/from China
Source: OAG Schedules Analyser
2,000,000
1,800,000
1,600,000
1,400,000
1,200,000
1,000,000
800,000
600,000
400,000
200,000
0
Nov-10
Nov-15
Nov-12
Nov-11
Nov-13
Nov-14
Seats
South Korea
Japan
Thailand
Taiwan
US
Singapore
Myanmar
Australia
UAE
Germany
Russia
Vietnam
France
Canada
Philippines
20%
international
seat growth
Nov 15 vs
Nov 14
China to the World – A look at the international markets driving growth
7
South Korea - The star performer
Five years ago scheduled airline capacity from China to Japan and from China
to South Korea was almost identical at around a million seats in November 2010.
In the intervening years, the China-South Korea market has grown rapidly and
continuously, and capacity is now 75% larger than it was back then. Both China
and South Korea have experienced steady economic growth over this period,
albeit China’s was somewhat more rapid. Year-over-year (November) seats from
China have grown by 10% and frequencies by 11%, making South Korea the
9th fastest growing international market for China. The dip in seats in mid 2015
reflects the effect of an outbreak of Middle East Respiratory Syndrome (MERS).
Dramatic increase in routes to Japan
In contrast to China-South Korea, the China-Japan aviation market declined by
20% in 2012 and has been recovering ever since. The Japanese economy has
continued in the doldrums but this has not stopped the growth of air services.
Comparing November 2015 with November 2014 capacity has grown by a
remarkable 48%, placing Japan as the third fastest growing international market
to and from China in the past year.
China to Japan Capacity
Source: OAG Schedules Analyser
900,000
800,000
700,000
600,000
500,000
400,000
300,000
200,000
100,000
0
Jan Feb Mar Apr May Jun Jul Aug Sep Oct Nov Dec
Seats
2015
2014
2013
2012
China to South Korea Capacity
Source: OAG Schedules Analyser
1,200,000
1,000,000
800,000
600,000
400,000
200,000
0
Jan Feb Mar Apr May Jun Jul Aug Sep Oct Nov Dec
Seats
2015
2014
2013
2012
China to the World – A look at the international markets driving growth
© 2016 OAG Aviation Worldwide Limited. All rights reserved8
According to OAG Schedules Analyser, airlines have added 1,516 new frequencies
from China to Japan over the past year (November 2014 vs November 2015), as
well as 264,116 seats. Of these, just over 40% provide additional capacity on
existing routes. More striking is the fact that the remaining 60% (893 frequencies)
are on 48 newly operated routes.
The opening of Tokyo Haneda International Airport to services from China
accounts for some - but by no means all - of this. A total of 164 frequencies have
started on the Shanghai-Haneda route (PVG-HND), a further 120 on Guangzhou-
Haneda (CAN-HND) and 17 on Tianjin-Haneda (TSN- HND). Similarly, this rapid
expansion is not a phenomenon only at China’s main international airports. Over
half of all the new frequencies are to and from secondary airports in China i.e. not
from Beijing, Shanghai or Guangzhou.
The most remarkable feature, perhaps, of this market growth is that the vast
majority of new frequencies - 94% - is operated by Chinese airlines.
Vietnam becomes China’s fastest growing market
While Japan might be
the third fastest growing
air market from China in
the past year, Vietnam is
the fastest. Capacity is
much smaller at just over
200,000 seats from China
to Vietnam in November
but has grown by 75%
compared to November
last year.
The major players are
Vietnam Airlines and
China Southern Airlines,
the Skyteam partners
operating 79% of the seats
in the market, down from
90% a year ago.
China to Vietnam Capacity
Source: OAG Schedules Analyser
120,000
100,000
80,000
60,000
40,000
20,000
0
Jan Feb Mar Apr May Jun Jul Aug Sep Oct Nov Dec
Seats
2015
2014
2013
2012
China to Vietnam frequencies
Source: OAG Schedules Analyser
China Eastern
Airlines
China Southern Airlines
Air China
Sichuan Airlines
Kenya Airways
Vietnam Airlines
Nov 2015
562
Nov 2014
368
China to the World – A look at the international markets driving growth
9
Both carriers have added capacity but have seen market share fall with the arrival
of Sichuan Airlines and Kenya Airways (which operates to Guangzhou via Hanoi
three times per week), and with the growth of Air China and China Eastern Airlines’
frequency additions.
Thailand benefits from services from
secondary airports
Not far behind Vietnam in terms of growth is Thailand, with 57% more available seats
in November than a year earlier. That is more than half a million more seats and nearly
1,400 new airline frequencies. This brings the total number of airlines seats from China
to Thailand in November to 1.5m, not much smaller than the China-Japan market in
size. Over half (53%) of all frequencies operate to or from Bangkok (BKK).
Of the new frequencies, 452 have been added from the three main Chinese airports in
Beijing, Shanghai and Guangzhou. The remaining 932 (67%) have been added from
smaller and secondary Chinese airports.
In the year since last November twenty-two
new routes have been launched bringing
the total number of routes to 85. Orient Thai
Airlines has made the largest contribution
to new frequencies with 274, although
some of the new operations may represent
a switch from charter to scheduled flights.
The next largest contributor to new
services is Spring Airlines, the Chinese
low cost carrier. Over the year the airline
has added 107 frequencies from Shanghai
(PVG) to Thailand and 143 frequencies from
smaller and secondary airports in China
such as Chengdu (CTU) and Hangzhou
(HGH) to Thailand, mostly Bangkok (BKK).
Three other LCCs have also started
services between China and Thailand in
the past year - Nok Air, Thai AirAsia X and
NokScoot – all of which now have 109
frequencies in the month of November.
China to Thailand – Frequencies by airline, November 2015
Source: OAG Schedules Analyser
Other
Juneyao
Airlines
Shenzhen
Airlines
Shanghai
Airlines
Orient Thai Airlines
Air China Spring Airlines
Thai Airlines
China
Eastern
Thai AirAsia
Airlines
China Southern
China to Thailand Capacity
Source: OAG Schedules Analyser
800,000
700,000
600,000
500,000
400,000
300,000
200,000
100,000
0
Jan Feb Mar Apr May Jun Jul Aug Sep Oct Nov Dec
Seats
2015
2014
2013
2012
China to the World – A look at the international markets driving growth
© 2016 OAG Aviation Worldwide Limited. All rights reserved10
Meanwhile Thai AirAsia has scaled
back its operations with the loss of 139
frequencies in November although this
still leaves them with more operations
between China and Thailand than any
airline except China Southern.
However, the majority of new frequencies
have been added by Chinese legacy
carriers – Air China, Shenzhen Airlines,
China Southern, Sichuan Airlines Xiamen
Airlines, Beijing Capital Airlines, Hainan
Airlines and 11 others.
Delving further into the past, the Thai
political crisis that occurred between
November 2013 and May 2014 clearly
disturbed scheduled traffic flows
between China and Thailand through
much of 2014, and so year-over-year
growth is measured from a depressed
2014 base figure. However, the underlying attractiveness of the market appears
relatively secure and charter traffic appears to be helping establish markets ready for
scheduled air services. Since the dip in capacity in mid-2014, growth has averaged
5% per month.
Chinese airlines strengthen position to Australia
A pattern is emerging which continues with markets further afield - that is of
strong growth in airline capacity over the last year and especially by Chinese
carriers. Australia is a good example. In November there are 40% more seats in
the China-to-Australia market than a year previously. Between them seven airlines
have 237,000 airline seats in the market spread over 13 routes; the latest market
entrant is Xiamen Airlines which starts operations between Fuzhou and Sydney
in November 2015. In November 2015 there are 438 frequencies, up 109 on the
previous year. However, all but two of the airlines are Chinese.
Qantas has made no change to its daily Shanghai (PVG) service from Sydney
(SYD), while Jetstar Airways is operating eight flights a week between Gold Coast
(OOL) and Wuhan (WUH), a service which wasn’t in place last year.
China to Thailand – Frequencies by type of airline, 5 growth
Source: OAG Schedules Analyser
LCC (Nov 2015)
LCC (new in
Nov 2015)
Legacy (new
in Nov 2015)
Legacy (Nov 2015)
China to Australia Capacity
Source: OAG Schedules Analyser
140,000
120,000
100,000
80,000
60,000
40,000
20,000
0
Jan Feb Mar Apr May Jun Jul Aug Sep Oct Nov Dec
Seats
2015
2014
2013
2012
China to the World – A look at the international markets driving growth
11
This means that over 90% of direct
frequencies are on Chinese airlines.
However, there is plenty of scope
for one-stop services via hubs such
as Singapore and while Qantas’
non-stop capacity to China may be
limited the airline does code-share
with China Eastern via Singapore.
Furthermore it has recently won
approval from Australia’s anti-
trust regulator for a joint venture
between the two carriers.
Providing a boost to an already
growing market, in January this
year Australia and China agreed
to a new air services agreement
which triples the allowed capacity
on major routes between the two
countries by 2016, and places no
capacity limits on routes serving
smaller cities. In the face of strong market growth there was clearly a case for
loosening the regulatory constraints.
Chinese carriers operate over half the China-
US market
Another long haul market which has grown strongly is from China to the US. There
are 22% more airline seats this November than this time last year. Looking at
November as a snapshot of the market gives the impression that capacity is divided
on a strictly 50:50 basis between carriers domiciled in the US and carriers domiciled
in China. Eight airlines fly between the two countries, with four from each country.
However, this is coincidence. In fact the share of capacity provided by Chinese
carriers has been rising steadily. Between July and October this year Chinese
domiciled carriers actually operated more frequencies than US domiciled carriers
but in November the share was close to even with Chinese carriers operating just 9
more frequencies over the month than US carriers.
China to Australia frequencies
Source: OAG Schedules Analyser
China Eastern
Airlines
Xiamen
Airlines
China Southern Airlines
Air China
Sichuan Airlines
Jetstar Airways
Qantas
Nov 2015
438
Nov 2014
329
China to US Capacity
Source: OAG Schedules Analyser
400,000
350,000
300,000
250,000
200,000
150,000
100,000
50,000
0
Jan Feb Mar Apr May Jun Jul Aug Sep Oct Nov Dec
Seats
2015
2014
2013
2012
China to the World – A look at the international markets driving growth
© 2016 OAG Aviation Worldwide Limited. All rights reserved12
In stark contrast to the
blossoming of new routes
from secondary Chinese
cities which characterises
airline services between
China and Japan and
between China and Thailand,
all but 36 of the more
than 1,000 frequencies in
November from China to
the US are from just three
airports in China; Beijing,
Shanghai or Guangzhou.
Scheduled frequencies from China to US
Source: OAG Schedules Analyser
800
700
600
500
400
300
200
100
0
Frequencies
US Carriers
Chinese Carriers
Jan-13
Jan-14
Jan-15
Feb-13
Feb-14
Feb-15
Mar-13
Mar-14
Mar-15
Apr-13
Apr-14
Apr-15
May-13
May-14
May-15
Jun-13
Jun-14
Jun-15
Jul-13
Jul-14
Jul-15
Aug-13
Aug-14
Aug-15
Sep-13
Sep-14
Sep-15
Oct-13
Oct-14
Oct-15
Nov-13
Nov-14
Nov-15
Dec-13
Dec-14
China to US frequencies, by carrier – November 2015
Source: OAG Schedules Analyser
United
Hawaiian
Delta
American
Hainan Airlines
Air China
China Eastern
Airlines
China Southern Airlines
China to the World – A look at the international markets driving growth
13
Where next? China’s new Silk Road
While the six international air markets profiled here account for a large proportion
of China’s international aviation capacity, strong growth is also taking place in
numerous smaller markets as Chinese carriers expand international services and
airlines from other countries see the opportunity of serving the outbound Chinese
traveller.
For instance, there are six countries that have had scheduled air services to and
from China in 2015 where none existed in 2014. These are Afghanistan, Belarus,
Czech Republic, Fiji, French Polynesia and Ukraine. In addition to four of the
countries studied here, there are a further 14 which have seen capacity grow in
excess of 20% in the first 11 months of 2015 compared to the same period last
year.
Of particular note is that six of these are in Western and Central Asia; Iraq, Iran,
Pakistan, Turkmenistan, Tajikistan and Uzbekistan. While the number of seats and
frequencies offered between these countries and China may as yet be relatively
small, these are all signs of Xi Jinping’s New Silk Road strategy which aims to
strengthen trade and economic ties with the countries along the ‘new Silk Road,
connecting east and west.
These must be markets to watch.
Source: OAG Schedules Analyser
New Silk Road capacity from China – Jan-Nov 2015 (Growth vs Jan-Nov 2014)
Iran Islamic Republic of
Uzbekistan
Pakistan
Tajikistan
Turkmenistan
Iraq
Afghanistan
+43%
+29%
+24%
+46%
+336%
New
+22%
0 40,000 80,000 120,000 160,000
Seats
China to the World – A look at the international markets driving growth
© 2016 OAG Aviation Worldwide Limited. All rights reserved14
Usage and attribution
This information can be reproduced in whole or in part, online or in print, for non-commercial purposes only and must
include attribution to OAG and a link to www.oag.com.
Disclaimer
The intended recipient (“The Customer”) acknowledges that all the data provided by or available through OAG is owned
either by OAG Aviation Worldwide Ltd or by a third party provider (“The Owners”) and that the customer shall not acquire
any ownership or interest in such data.
OAG data is solely for the benefit and purposes of the intended recipient and may not be disclosed to, used by or copied
by anyone other than the intended recipient. OAG Aviation Worldwide Ltd has used reasonable efforts in collecting and
preparing data in the report but cannot and does not warrant that the information contained in this is report is complete
or accurate, OAG Aviation Worldwide Ltd hereby disclaims liability to any person for any loss or damage caused by
errors or omissions on the report.
China to the World – A look at the international markets driving growth
15
For more information, visit www.oag.com
or email us on contactus@oag.com
Europe, Middle East & Africa
1 Capability Green
Luton
Bedfordshire LU1 3LU
United Kingdom
T: +44 (0)1582 695050
Americas
55 Chapel Street
Suite 103
Newton
MA 02458
USA
T: +1 617-787-4200
Asia
6 Shenton Way
#24-08A, Singapore
OUE Downtown 2
068809
T: +65 6395 5888
China
#3710B Jingguang Building
Hujialou Chaoyang District
Beijing China 100020
T: +86 10 5095 5960
Japan
Toranomon
40MT Building 9F5-13-1
Toranomon Minato-Ku
Tokyo 105-0001
T: +813 6402 7301
© 2016 OAG Aviation Worldwide Limited.
All rights reserved

China-to-the-World-report

  • 1.
    1 connecting the world oftravel China to the World A look at the international markets driving growth
  • 2.
    China to theWorld – A look at the international markets driving growth © 2016 OAG Aviation Worldwide Limited. All rights reserved2
  • 3.
    China to theWorld – A look at the international markets driving growth 3 Contents Introduction 4 From strength to strength 5 South Korea - The star performer 7 Dramatic increase in routes to Japan 7 Vietnam becomes China’s fastest growing market 8 Thailand benefits from services from secondary airports 9 Chinese airlines strengthen position to Australia 10 Chinese carriers operate over half the China-US market 11 Where next? China’s new Silk Road 13
  • 4.
    © 2016 OAGAviation Worldwide Limited. All rights reserved4 © 2016 OAG Aviation Worldwide Limited. All rights reserved4 China to the World – A look at the international markets driving growth China to the World A look at the international markets driving growth ______________ Chinese President Xi Jinping has been busy travelling the world this year, making numerous official visits overseas and attending summits and meetings. This reflects China’s status as the world’s largest trading nation and the outward looking nature of the current Chinese leadership. We know trade discussions often include commitments to increase air services on a bilateral basis; in September the visit of India’s Prime Minister Modi to California was swiftly followed by the announcement of a new Air India service between New Delhi and San Francisco. In October the Chinese State visit to the UK included the announcement of a new service operated by Hainan Airlines between Manchester and Beijing. With trade being a high priority for discussions on President Xi’s trips, it’s timely to look at the growth of international air travel to and from China.
  • 5.
    China to theWorld – A look at the international markets driving growth 5 Airline capacity to/from China – Nov 2015 vs Nov 2014 growth in Top 15 markets Source: OAG Schedules Analyser 80% 70% 60% 50% 40% 30% 20% 10% 0% Vietnam US South Korea Japan France M yanm ar Thailand Canada G erm any Philippines Russia UAE Australia Singapore Taiw an Seatgrowth Domestic 47.6m seats from Chinese airports November 2015 International From strength to strength In contrast to news reports of weakness in the Chinese economy, there is no sign of weakness in the Chinese aviation market. In the month of November 2015 there are 298,353 scheduled flights leaving Chinese airports for destinations in China or internationally, according to OAG Schedules Analyser. That equates to 47.6m airline seats a month and 9,945 aircraft movements every day. The average aircraft size is 159 seats. Eighty nine percent of capacity is provided on routes within China, including Hong Kong and Macau, while the remaining eleven percent is on routes between China and elsewhere. The capacity growth is enviable. There are 3.1m more domestic airline seats available in November 2015 compared to November 2014, an 8% increase. Although smaller in absolute terms, international capacity growth is a staggering 20% year-over-year, which is nearly 900,000 more airline seats in November 2015 than this time last year. The top 15 largest international markets account for 86% of all international capacity in November, with South Korea and Japan leading the way in terms of available capacity. We take a look at six of the star performer country markets for air services from China over the past year to understand the airlines and airports that are driving this level of growth. These include two markets in North East Asia – South Korea and Japan, two markets in South East Asia – Vietnam and Thailand which have seen especially strong growth, and two long haul markets – Australia and the US.
  • 6.
    China to theWorld – A look at the international markets driving growth © 2016 OAG Aviation Worldwide Limited. All rights reserved6 Scheduled airline capacity to/from China Source: OAG Schedules Analyser 2,000,000 1,800,000 1,600,000 1,400,000 1,200,000 1,000,000 800,000 600,000 400,000 200,000 0 Nov-10 Nov-15 Nov-12 Nov-11 Nov-13 Nov-14 Seats South Korea Japan Thailand Taiwan US Singapore Myanmar Australia UAE Germany Russia Vietnam France Canada Philippines 20% international seat growth Nov 15 vs Nov 14
  • 7.
    China to theWorld – A look at the international markets driving growth 7 South Korea - The star performer Five years ago scheduled airline capacity from China to Japan and from China to South Korea was almost identical at around a million seats in November 2010. In the intervening years, the China-South Korea market has grown rapidly and continuously, and capacity is now 75% larger than it was back then. Both China and South Korea have experienced steady economic growth over this period, albeit China’s was somewhat more rapid. Year-over-year (November) seats from China have grown by 10% and frequencies by 11%, making South Korea the 9th fastest growing international market for China. The dip in seats in mid 2015 reflects the effect of an outbreak of Middle East Respiratory Syndrome (MERS). Dramatic increase in routes to Japan In contrast to China-South Korea, the China-Japan aviation market declined by 20% in 2012 and has been recovering ever since. The Japanese economy has continued in the doldrums but this has not stopped the growth of air services. Comparing November 2015 with November 2014 capacity has grown by a remarkable 48%, placing Japan as the third fastest growing international market to and from China in the past year. China to Japan Capacity Source: OAG Schedules Analyser 900,000 800,000 700,000 600,000 500,000 400,000 300,000 200,000 100,000 0 Jan Feb Mar Apr May Jun Jul Aug Sep Oct Nov Dec Seats 2015 2014 2013 2012 China to South Korea Capacity Source: OAG Schedules Analyser 1,200,000 1,000,000 800,000 600,000 400,000 200,000 0 Jan Feb Mar Apr May Jun Jul Aug Sep Oct Nov Dec Seats 2015 2014 2013 2012
  • 8.
    China to theWorld – A look at the international markets driving growth © 2016 OAG Aviation Worldwide Limited. All rights reserved8 According to OAG Schedules Analyser, airlines have added 1,516 new frequencies from China to Japan over the past year (November 2014 vs November 2015), as well as 264,116 seats. Of these, just over 40% provide additional capacity on existing routes. More striking is the fact that the remaining 60% (893 frequencies) are on 48 newly operated routes. The opening of Tokyo Haneda International Airport to services from China accounts for some - but by no means all - of this. A total of 164 frequencies have started on the Shanghai-Haneda route (PVG-HND), a further 120 on Guangzhou- Haneda (CAN-HND) and 17 on Tianjin-Haneda (TSN- HND). Similarly, this rapid expansion is not a phenomenon only at China’s main international airports. Over half of all the new frequencies are to and from secondary airports in China i.e. not from Beijing, Shanghai or Guangzhou. The most remarkable feature, perhaps, of this market growth is that the vast majority of new frequencies - 94% - is operated by Chinese airlines. Vietnam becomes China’s fastest growing market While Japan might be the third fastest growing air market from China in the past year, Vietnam is the fastest. Capacity is much smaller at just over 200,000 seats from China to Vietnam in November but has grown by 75% compared to November last year. The major players are Vietnam Airlines and China Southern Airlines, the Skyteam partners operating 79% of the seats in the market, down from 90% a year ago. China to Vietnam Capacity Source: OAG Schedules Analyser 120,000 100,000 80,000 60,000 40,000 20,000 0 Jan Feb Mar Apr May Jun Jul Aug Sep Oct Nov Dec Seats 2015 2014 2013 2012 China to Vietnam frequencies Source: OAG Schedules Analyser China Eastern Airlines China Southern Airlines Air China Sichuan Airlines Kenya Airways Vietnam Airlines Nov 2015 562 Nov 2014 368
  • 9.
    China to theWorld – A look at the international markets driving growth 9 Both carriers have added capacity but have seen market share fall with the arrival of Sichuan Airlines and Kenya Airways (which operates to Guangzhou via Hanoi three times per week), and with the growth of Air China and China Eastern Airlines’ frequency additions. Thailand benefits from services from secondary airports Not far behind Vietnam in terms of growth is Thailand, with 57% more available seats in November than a year earlier. That is more than half a million more seats and nearly 1,400 new airline frequencies. This brings the total number of airlines seats from China to Thailand in November to 1.5m, not much smaller than the China-Japan market in size. Over half (53%) of all frequencies operate to or from Bangkok (BKK). Of the new frequencies, 452 have been added from the three main Chinese airports in Beijing, Shanghai and Guangzhou. The remaining 932 (67%) have been added from smaller and secondary Chinese airports. In the year since last November twenty-two new routes have been launched bringing the total number of routes to 85. Orient Thai Airlines has made the largest contribution to new frequencies with 274, although some of the new operations may represent a switch from charter to scheduled flights. The next largest contributor to new services is Spring Airlines, the Chinese low cost carrier. Over the year the airline has added 107 frequencies from Shanghai (PVG) to Thailand and 143 frequencies from smaller and secondary airports in China such as Chengdu (CTU) and Hangzhou (HGH) to Thailand, mostly Bangkok (BKK). Three other LCCs have also started services between China and Thailand in the past year - Nok Air, Thai AirAsia X and NokScoot – all of which now have 109 frequencies in the month of November. China to Thailand – Frequencies by airline, November 2015 Source: OAG Schedules Analyser Other Juneyao Airlines Shenzhen Airlines Shanghai Airlines Orient Thai Airlines Air China Spring Airlines Thai Airlines China Eastern Thai AirAsia Airlines China Southern China to Thailand Capacity Source: OAG Schedules Analyser 800,000 700,000 600,000 500,000 400,000 300,000 200,000 100,000 0 Jan Feb Mar Apr May Jun Jul Aug Sep Oct Nov Dec Seats 2015 2014 2013 2012
  • 10.
    China to theWorld – A look at the international markets driving growth © 2016 OAG Aviation Worldwide Limited. All rights reserved10 Meanwhile Thai AirAsia has scaled back its operations with the loss of 139 frequencies in November although this still leaves them with more operations between China and Thailand than any airline except China Southern. However, the majority of new frequencies have been added by Chinese legacy carriers – Air China, Shenzhen Airlines, China Southern, Sichuan Airlines Xiamen Airlines, Beijing Capital Airlines, Hainan Airlines and 11 others. Delving further into the past, the Thai political crisis that occurred between November 2013 and May 2014 clearly disturbed scheduled traffic flows between China and Thailand through much of 2014, and so year-over-year growth is measured from a depressed 2014 base figure. However, the underlying attractiveness of the market appears relatively secure and charter traffic appears to be helping establish markets ready for scheduled air services. Since the dip in capacity in mid-2014, growth has averaged 5% per month. Chinese airlines strengthen position to Australia A pattern is emerging which continues with markets further afield - that is of strong growth in airline capacity over the last year and especially by Chinese carriers. Australia is a good example. In November there are 40% more seats in the China-to-Australia market than a year previously. Between them seven airlines have 237,000 airline seats in the market spread over 13 routes; the latest market entrant is Xiamen Airlines which starts operations between Fuzhou and Sydney in November 2015. In November 2015 there are 438 frequencies, up 109 on the previous year. However, all but two of the airlines are Chinese. Qantas has made no change to its daily Shanghai (PVG) service from Sydney (SYD), while Jetstar Airways is operating eight flights a week between Gold Coast (OOL) and Wuhan (WUH), a service which wasn’t in place last year. China to Thailand – Frequencies by type of airline, 5 growth Source: OAG Schedules Analyser LCC (Nov 2015) LCC (new in Nov 2015) Legacy (new in Nov 2015) Legacy (Nov 2015) China to Australia Capacity Source: OAG Schedules Analyser 140,000 120,000 100,000 80,000 60,000 40,000 20,000 0 Jan Feb Mar Apr May Jun Jul Aug Sep Oct Nov Dec Seats 2015 2014 2013 2012
  • 11.
    China to theWorld – A look at the international markets driving growth 11 This means that over 90% of direct frequencies are on Chinese airlines. However, there is plenty of scope for one-stop services via hubs such as Singapore and while Qantas’ non-stop capacity to China may be limited the airline does code-share with China Eastern via Singapore. Furthermore it has recently won approval from Australia’s anti- trust regulator for a joint venture between the two carriers. Providing a boost to an already growing market, in January this year Australia and China agreed to a new air services agreement which triples the allowed capacity on major routes between the two countries by 2016, and places no capacity limits on routes serving smaller cities. In the face of strong market growth there was clearly a case for loosening the regulatory constraints. Chinese carriers operate over half the China- US market Another long haul market which has grown strongly is from China to the US. There are 22% more airline seats this November than this time last year. Looking at November as a snapshot of the market gives the impression that capacity is divided on a strictly 50:50 basis between carriers domiciled in the US and carriers domiciled in China. Eight airlines fly between the two countries, with four from each country. However, this is coincidence. In fact the share of capacity provided by Chinese carriers has been rising steadily. Between July and October this year Chinese domiciled carriers actually operated more frequencies than US domiciled carriers but in November the share was close to even with Chinese carriers operating just 9 more frequencies over the month than US carriers. China to Australia frequencies Source: OAG Schedules Analyser China Eastern Airlines Xiamen Airlines China Southern Airlines Air China Sichuan Airlines Jetstar Airways Qantas Nov 2015 438 Nov 2014 329 China to US Capacity Source: OAG Schedules Analyser 400,000 350,000 300,000 250,000 200,000 150,000 100,000 50,000 0 Jan Feb Mar Apr May Jun Jul Aug Sep Oct Nov Dec Seats 2015 2014 2013 2012
  • 12.
    China to theWorld – A look at the international markets driving growth © 2016 OAG Aviation Worldwide Limited. All rights reserved12 In stark contrast to the blossoming of new routes from secondary Chinese cities which characterises airline services between China and Japan and between China and Thailand, all but 36 of the more than 1,000 frequencies in November from China to the US are from just three airports in China; Beijing, Shanghai or Guangzhou. Scheduled frequencies from China to US Source: OAG Schedules Analyser 800 700 600 500 400 300 200 100 0 Frequencies US Carriers Chinese Carriers Jan-13 Jan-14 Jan-15 Feb-13 Feb-14 Feb-15 Mar-13 Mar-14 Mar-15 Apr-13 Apr-14 Apr-15 May-13 May-14 May-15 Jun-13 Jun-14 Jun-15 Jul-13 Jul-14 Jul-15 Aug-13 Aug-14 Aug-15 Sep-13 Sep-14 Sep-15 Oct-13 Oct-14 Oct-15 Nov-13 Nov-14 Nov-15 Dec-13 Dec-14 China to US frequencies, by carrier – November 2015 Source: OAG Schedules Analyser United Hawaiian Delta American Hainan Airlines Air China China Eastern Airlines China Southern Airlines
  • 13.
    China to theWorld – A look at the international markets driving growth 13 Where next? China’s new Silk Road While the six international air markets profiled here account for a large proportion of China’s international aviation capacity, strong growth is also taking place in numerous smaller markets as Chinese carriers expand international services and airlines from other countries see the opportunity of serving the outbound Chinese traveller. For instance, there are six countries that have had scheduled air services to and from China in 2015 where none existed in 2014. These are Afghanistan, Belarus, Czech Republic, Fiji, French Polynesia and Ukraine. In addition to four of the countries studied here, there are a further 14 which have seen capacity grow in excess of 20% in the first 11 months of 2015 compared to the same period last year. Of particular note is that six of these are in Western and Central Asia; Iraq, Iran, Pakistan, Turkmenistan, Tajikistan and Uzbekistan. While the number of seats and frequencies offered between these countries and China may as yet be relatively small, these are all signs of Xi Jinping’s New Silk Road strategy which aims to strengthen trade and economic ties with the countries along the ‘new Silk Road, connecting east and west. These must be markets to watch. Source: OAG Schedules Analyser New Silk Road capacity from China – Jan-Nov 2015 (Growth vs Jan-Nov 2014) Iran Islamic Republic of Uzbekistan Pakistan Tajikistan Turkmenistan Iraq Afghanistan +43% +29% +24% +46% +336% New +22% 0 40,000 80,000 120,000 160,000 Seats
  • 14.
    China to theWorld – A look at the international markets driving growth © 2016 OAG Aviation Worldwide Limited. All rights reserved14 Usage and attribution This information can be reproduced in whole or in part, online or in print, for non-commercial purposes only and must include attribution to OAG and a link to www.oag.com. Disclaimer The intended recipient (“The Customer”) acknowledges that all the data provided by or available through OAG is owned either by OAG Aviation Worldwide Ltd or by a third party provider (“The Owners”) and that the customer shall not acquire any ownership or interest in such data. OAG data is solely for the benefit and purposes of the intended recipient and may not be disclosed to, used by or copied by anyone other than the intended recipient. OAG Aviation Worldwide Ltd has used reasonable efforts in collecting and preparing data in the report but cannot and does not warrant that the information contained in this is report is complete or accurate, OAG Aviation Worldwide Ltd hereby disclaims liability to any person for any loss or damage caused by errors or omissions on the report.
  • 15.
    China to theWorld – A look at the international markets driving growth 15
  • 16.
    For more information,visit www.oag.com or email us on contactus@oag.com Europe, Middle East & Africa 1 Capability Green Luton Bedfordshire LU1 3LU United Kingdom T: +44 (0)1582 695050 Americas 55 Chapel Street Suite 103 Newton MA 02458 USA T: +1 617-787-4200 Asia 6 Shenton Way #24-08A, Singapore OUE Downtown 2 068809 T: +65 6395 5888 China #3710B Jingguang Building Hujialou Chaoyang District Beijing China 100020 T: +86 10 5095 5960 Japan Toranomon 40MT Building 9F5-13-1 Toranomon Minato-Ku Tokyo 105-0001 T: +813 6402 7301 © 2016 OAG Aviation Worldwide Limited. All rights reserved