Download to read offline

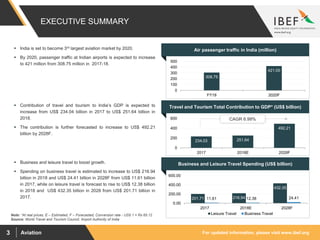

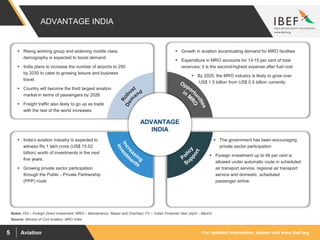

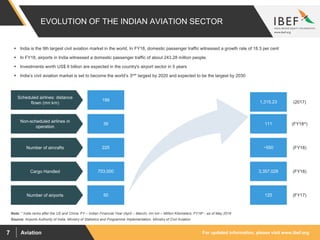
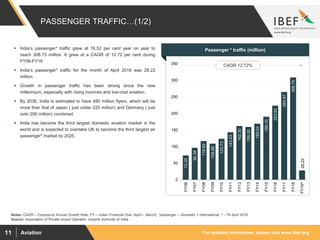


- India's aviation market is growing rapidly and is expected to become the third largest by 2020 and largest by 2030. - Air passenger traffic in India grew at a CAGR of 12.72% from 2006-2018 reaching 308.75 million passengers in 2018. - Major growth drivers include rising incomes, expansion of airports and airlines, and low cost carriers capturing more market share. - The government has implemented policies to encourage private sector participation and investment in the aviation industry.


