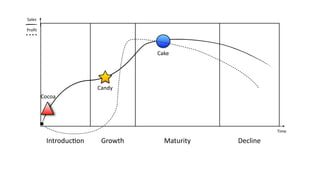
SlideShare a Scribd company logo
Chewy and the Yumities Market
 Analysis of Cake, Cocoa and Candy brands


          Cake    Cocoa    Candy
                 Team 03
Yumities Market

Chewy     Whippit       Tasty    Savor


                                             New entry


         Walnut                             CHEAP

        Wafer Wizard   Toffee    Sushi   STANDARD CHEAP


                        Taco             STANDARD PREMIUM


                       Tomato    Salad   PREMIUM
Repositioning Candy as Standard-Premium market

                              Reasons
    No evident competitive advantage against main competitors Salad and
    Tomato, but high disavantage in key attributes in Premium Market
    Continuous spending on its marketing-mix in the previous three
    periods didn’t make it better than its competitors
 
                               Actions
    Price reduced by 3.40 $
    Implementing the cost and quality R&D formulas
Launch new product Cocoa in Standard Cheap Market

                             Reasons
    Existing brands Cake and Candy were targeting the Cheap and the
    Standard-Premium market and company still didn’t have presence in
    the Standard-Cheap market.
    Standard-Cheap market share was 35% of the Yumities market 
 
                             Actions
    A new formula, C07D-I, was developed with key attributes higher
    than the competitors’
Comparative analysis of the company across periods

    From period 0 to 1                   From period 1 to 2

      Revenues        + 4,5%               Revenues       (-4.7%)
  Brand contribution + 14,1%           Brand contribution (-1.6%)
         EBIT         + 10,1%                EBIT         (-1.5%)

Increase in Brand contribution of    Launch of brand tomato with high
  both brands cake and candy.       key product attributes than Candy.
Comparative analysis of the company across periods

      From period 2 to 3                                     From period 3 to 4

            Revenues              (-11.3%)                       Revenues              +23,1%
     Brand contribution +0,8%                             Brand contribution (-27.6%)
               EBIT               (-1.9%)                           EBIT             (-40.7%)

      Although the cost formula for Candy was         ✓ Launch of a new-product Cocoa
  implemented but the price was increased whereas     ✓ Strong response by the competitors to the   launch
its competitor Salad improved the formula with only   ✓ Negative contribution of Cocoa (-9500 k$)
               slight increase in price                 shadowed the good performance of other brands
Comparative analysis of the company across periods

       From period 4 to 5                                   From period 5 to 6

            Revenues             +22,5%                           Revenues            +19,7%
     Brand contribution +77,5%                           Brand contribution            +48%
                EBIT             +166,5%                           EBIT               +65,5%

✓ Repositioning strategy of Candy worked out well    ✓ Increase in sales revenue of Cocoa by 54%
✓ Brand contribution of Candy increased by 9000 k$   ✓ Increase in brand contribution of Candy by more
✓ An improvement formula for candy was                 than 10,000 k$
  implemented
Chewy’s Main Results
Brand Cake - Main Performance

CAKE is in a maturity of market with
main competitor of WALNUT. Main
objective for CAKE is to maintain its
market performance, and allocate
more resource and budget for CANDY
and other new products on the
company’s level.

Low-price strategy is the most efficient way to stimulate sales; while other marketing
tools such as advertising, store penetration and promotions are not that effective.
However, due to the unsteady pricing strategy, consumers were quite confused and
didn’t go for sales.
Brand Cake - Main results
 CAKE                     P0        P1          P2          P3          P4          P5          P6
 Unit	
  Sold             8724     9464	
      8813	
      6963	
      8308	
      8205	
      7959	
  
 Av	
  Retail	
  Price    7.08     6.39	
      6.90	
      6.89	
      6.40	
      6.36	
      5.90	
  
 Sales	
  Revenue        38826    38494	
     38250	
     30217	
     33067	
     32464	
     29230	
  
 Brand	
  ContribuBon     6288     7821	
     11747	
      7145	
      8920	
      8622	
      6926	
  
 MarkeBng	
  Budget      17336    16009	
     16040	
     14538	
     14718	
     14593	
     13567	
  
 Market	
  Share         7.10%    6.90%       6.30%       4.50%       4.70%       4.20%       3.50%

 WALNUT                   P0        P1          P2          P3          P4          P5          P6
 Unit	
  Sold            8690     8310	
       9527	
     11019	
     10269	
     10482	
     10373	
  
 Av	
  Retail	
  Price    7.6      7.50	
      7.45	
      7.35	
      7.30	
      7.25	
      7.15	
  
 Sales	
  Revenue           -­‐      -­‐         -­‐         -­‐         -­‐         -­‐         -­‐
 Brand	
  ContribuBon       -­‐      -­‐         -­‐         -­‐         -­‐         -­‐         -­‐
 MarkeBng	
  Budget         -­‐      -­‐      16667	
     17255	
     18623	
     17367	
        -­‐
 Market	
  Share         7.50%    7.10%       7.30%       7.60%       6.60%       6.00%       5.50%
Brand Cake - Strategic Decision


Adopt improved formula C03A-COST to lower down production cost at Period 0;

Reduce the price over time as its target consumers are price sensitive; however,
due to the unsteady/changeable price strategy, it is NOT effective enough to
attract more consumer base or increase the units sold

Reduce marketing budget over time and allocate more for the company’s new
brand – COCOA as the first priority;
Brand Candy - Strategic decisions

Since Candy was in a Growth phase,
company decided to invest more in.
At the beginning we decided to not
develop any formula waiting for new
R&D discoveries in P1 and to know what
were key attributes thanks to Market
Studies.

Starting Strategy
Target - Highs and Affluents Families (in order of importance)
Product - high value with good average attributes
Price - high price but less high than the Salad one
Place - specialty stores and in second instance, supermarkets
Promotion - high investments in Adv and low investments in promotion
Brand Candy - Strategic decisions
Repositioning
In P3, with the new competitor in P2 (Tomato) and the improvement of Salad
(forecasted), the life-cycle of Candy in Premium market speeds up. So, we decided to
reposition Candy the segment below: the Standard Premium.

New Strategy
Target - Affluents, Highs, Singles, Medium (in order of importance)
Product - High quality (with new formula Improvement)
Price - High Value for Money (High Quality and competitive price)
Place - Trade marketing budget turned in specialty stores, supermarkets and mass
merchandisers too to reach new target
Promotion - Adv to reposition product on price and performance, increase of promotion
budget to attract customers price sensitives
Brand Candy - Main results
                      Competition in Premium Market
                      Competition in Standard-Premium Market


CANDY                            P0       P1       P2       P3     P4     P5     P6          SALAD                         P0       P1     P2     P3     P4     P5   P6
Units	
  Sold                   4.874    5.366    4.918    4.684 4.798 6.178 7.451           Units	
  Sold                5.018    5.000 6.500 8.000 8.000 8.141 7.644
Av	
  Retail	
  Price	
  ($)    26,50    25,41    25,36    25,50 22,11 23,09 22,64           Av	
  Retail	
  Price	
  ($) 28,10    27,65 27,25 27,45 27,75 28,00 28,30
Sales	
  Revenue	
  ($)        67.166   72.221   67.217   63.366 59.168 78.320 92.571        Sales	
  Revenue	
  ($)        -­‐      -­‐    -­‐    -­‐    -­‐    -­‐  -­‐
Brand	
  ContribuAon	
  ($)    18.148   20.056   21.779   20.524 20.777 29.585 39.692        Brand	
  ContribuAon	
  ($)    -­‐      -­‐    -­‐    -­‐    -­‐    -­‐  -­‐
MarkeAng	
  Budget	
  ($)      17.872   21.122   22.950   21.129 15.855 17.800 18.475        MarkeAng	
  Budget	
  ($)      -­‐      -­‐ 26.051 25.389 25.150 25.355  -­‐
Market	
  Share	
  ($)         14,8%    15,6%    12,9%    11,2% 9,3% 11,4% 12,6%             Market	
  Share	
  ($)       16,1%    15,8% 18,3% 20,6% 19,5% 18,2% 16,1%

                               TACO                                P3     P4     P5   P6     TOMATO                         P0      P1       P2     P3     P4       P5    P6
                               Units	
  Sold                      6.382 6.750 6.877 6.984    Units	
  Sold                   -­‐     -­‐    2.446 3.882 5.219      6.711 7.601
                               Average	
  Retail	
  Price	
  ($) 22,20 22,50 22,70 22,95     Av	
  Retail	
  Price	
  ($)    -­‐     -­‐    26,65 26,90 27,25      27,45 27,75
                               Sales	
  Revenue	
  ($)              -­‐    -­‐    -­‐  -­‐   Sales	
  Revenue	
  ($)         -­‐     -­‐      -­‐    -­‐    -­‐      -­‐   -­‐
                               Brand	
  ContribuAon	
  ($)          -­‐    -­‐    -­‐  -­‐   Brand	
  ContribuAon	
  ($)     -­‐     -­‐      -­‐    -­‐    -­‐      -­‐   -­‐
                               MarkeAng	
  Budget	
  ($)         18.800 24.300 26.700  -­‐   MarkeAng	
  Budget	
  ($)       -­‐     -­‐   17.061 18.258 20.500   26.000   -­‐
                               Market	
  Share	
  ($)            13,3% 13,4% 12,5% 12,00%    Market	
  Share	
  ($)          -­‐     -­‐    6,7%   9,8% 12,5%     14,7% 15,7%
Cocoa - The new product

Cocoa is a Chewy’s new product launched in Period 4

The reasons for launching:
  Competitor Whippit launched new brand Wizard
  We was not in the 35% of the market (Standard-Cheap)
  Cake’s market share was going down for the maturity of the product
  Improve Chewy’s total performance and revenue
Cocoa - Physical attributes comparison

                       Physical	
  ALributes	
  (0-­‐100)       Avg.	
  Retail	
   Est.	
  Unit
Firm    Brand
                 Performance	
  NutriAon	
  Packaging Flavor
                                             ackaging	
          Price	
  ($)       Cost($)

Chewy   COCOA      55          55          35         45           16.90              3.4


Tasty   TOFFEE     65          45          25         60           16.10             3.45


Savor   SUSHI      60          57          56         40           16.40              3.4

                                                    Attributes of Marketed Brands in Period 4
Budget Allocation, Price Markup and Market Share

    Budget Allocation                         Price Markup                      Market Share
30000                                 16,9                          15%

25000                                                             11,25%
                                     16,65
20000
         5993                 4611                                 7,5%
15000                4699             16,4

10000                         8979
         9425        8480            16,15                        3,75%
 5000
         5000        5000     6000    15,9                           0%
    0
                                             P4    P5        P6            P4        P5      P6
         P4           P5      P6
                Promotion                         COCOA                             COCOA
                Trading                           TOFFEE                            TOFFEE
                Advertising                       SUSHI                             SUSHI
Q&A
BE FRIEND LY, THANKS =)
Sales

Profit


                                 Cake


                       Candy
        Cocoa


                                                        Time

         IntroducAon    Growth     Maturity   Decline

More Related Content

What's hot

Krispy natural
Krispy naturalKrispy natural
Krispy natural
Surya Teja Jonnalagadda
 
Markstrat 2014
Markstrat 2014Markstrat 2014
Markstrat 2014
Raphael Chicheportiche
 
MARKSTRAT Business Simulation Presentation
MARKSTRAT Business Simulation PresentationMARKSTRAT Business Simulation Presentation
MARKSTRAT Business Simulation Presentation
caamch2
 
Overall Performance of Business Compared to Competitors
Overall Performance of Business Compared to CompetitorsOverall Performance of Business Compared to Competitors
Overall Performance of Business Compared to CompetitorsBrock Norton, MBA
 
Capstone simulation presentation
Capstone simulation presentationCapstone simulation presentation
Capstone simulation presentation
Dev Anumolu
 
Increased Sales For Petroleum Distributors
Increased Sales For Petroleum DistributorsIncreased Sales For Petroleum Distributors
Increased Sales For Petroleum Distributors
BKC2121
 
Strategic marketing management report
Strategic marketing management reportStrategic marketing management report
Strategic marketing management report
Andrea Cappozzo
 
Markstrat presentation
Markstrat presentationMarkstrat presentation
Markstrat presentation
phanquang144
 
MHK-003_Blueline_Rev
MHK-003_Blueline_RevMHK-003_Blueline_Rev
MHK-003_Blueline_Revfinance30
 
meadwestvaco 4Q07_Earnings_Slides
 meadwestvaco 4Q07_Earnings_Slides meadwestvaco 4Q07_Earnings_Slides
meadwestvaco 4Q07_Earnings_Slidesfinance33
 
Institutional presentation 080413 eng final impressão
Institutional presentation 080413 eng final impressãoInstitutional presentation 080413 eng final impressão
Institutional presentation 080413 eng final impressãovigor_ri
 
Mrfg release 1_t12_eng_14maio2012_vfinal
Mrfg release 1_t12_eng_14maio2012_vfinalMrfg release 1_t12_eng_14maio2012_vfinal
Mrfg release 1_t12_eng_14maio2012_vfinalcleberson.souza
 
Presentation Results Q1 10/11
Presentation Results Q1 10/11Presentation Results Q1 10/11
Presentation Results Q1 10/11Barry Callebaut
 
air products & chemicals 5 December 2007 Citi Basic Materials
air products & chemicals 5 December 2007 Citi Basic Materialsair products & chemicals 5 December 2007 Citi Basic Materials
air products & chemicals 5 December 2007 Citi Basic Materialsfinance26
 

What's hot (18)

Krispy natural
Krispy naturalKrispy natural
Krispy natural
 
Markstrat ppt
Markstrat ppt Markstrat ppt
Markstrat ppt
 
Markstrat 2014
Markstrat 2014Markstrat 2014
Markstrat 2014
 
MARKSTRAT Business Simulation Presentation
MARKSTRAT Business Simulation PresentationMARKSTRAT Business Simulation Presentation
MARKSTRAT Business Simulation Presentation
 
Overall Performance of Business Compared to Competitors
Overall Performance of Business Compared to CompetitorsOverall Performance of Business Compared to Competitors
Overall Performance of Business Compared to Competitors
 
Markstrat annual presentation
Markstrat annual presentationMarkstrat annual presentation
Markstrat annual presentation
 
Paper 3 2006
Paper 3 2006Paper 3 2006
Paper 3 2006
 
Capstone simulation presentation
Capstone simulation presentationCapstone simulation presentation
Capstone simulation presentation
 
Capsim presentation
Capsim presentationCapsim presentation
Capsim presentation
 
Increased Sales For Petroleum Distributors
Increased Sales For Petroleum DistributorsIncreased Sales For Petroleum Distributors
Increased Sales For Petroleum Distributors
 
Strategic marketing management report
Strategic marketing management reportStrategic marketing management report
Strategic marketing management report
 
Markstrat presentation
Markstrat presentationMarkstrat presentation
Markstrat presentation
 
MHK-003_Blueline_Rev
MHK-003_Blueline_RevMHK-003_Blueline_Rev
MHK-003_Blueline_Rev
 
meadwestvaco 4Q07_Earnings_Slides
 meadwestvaco 4Q07_Earnings_Slides meadwestvaco 4Q07_Earnings_Slides
meadwestvaco 4Q07_Earnings_Slides
 
Institutional presentation 080413 eng final impressão
Institutional presentation 080413 eng final impressãoInstitutional presentation 080413 eng final impressão
Institutional presentation 080413 eng final impressão
 
Mrfg release 1_t12_eng_14maio2012_vfinal
Mrfg release 1_t12_eng_14maio2012_vfinalMrfg release 1_t12_eng_14maio2012_vfinal
Mrfg release 1_t12_eng_14maio2012_vfinal
 
Presentation Results Q1 10/11
Presentation Results Q1 10/11Presentation Results Q1 10/11
Presentation Results Q1 10/11
 
air products & chemicals 5 December 2007 Citi Basic Materials
air products & chemicals 5 December 2007 Citi Basic Materialsair products & chemicals 5 December 2007 Citi Basic Materials
air products & chemicals 5 December 2007 Citi Basic Materials
 

Similar to Chewy Company Debrief

Applied Business Managment BoD PPT
Applied Business Managment BoD PPTApplied Business Managment BoD PPT
Applied Business Managment BoD PPTMichael Camilleri
 
Natureview farm
Natureview  farm  Natureview  farm
Natureview farm
Utkarsha Gadeela
 
dover Q206_Slides
dover Q206_Slidesdover Q206_Slides
dover Q206_Slidesfinance30
 
The_4_Sales_Reports_for_CEO
The_4_Sales_Reports_for_CEOThe_4_Sales_Reports_for_CEO
The_4_Sales_Reports_for_CEOPatrick Kenny
 
Apresentacao 4 t12_eng
Apresentacao 4 t12_engApresentacao 4 t12_eng
Apresentacao 4 t12_engMagnesita_ri
 
4 q12 results presentation
4 q12 results presentation4 q12 results presentation
4 q12 results presentationMagnesitaRI
 
Motilal Oswal reiterate bullish long term view on United Spirits
Motilal Oswal reiterate bullish long term view on United SpiritsMotilal Oswal reiterate bullish long term view on United Spirits
Motilal Oswal reiterate bullish long term view on United Spirits
IndiaNotes.com
 
Final Presentation
Final PresentationFinal Presentation
Final Presentation
JacquelineLevy5
 
Natureview Harvard Case Study
Natureview Harvard Case Study Natureview Harvard Case Study
Natureview Harvard Case Study
Shivam Gupta
 
Apresentação de resultados q312 final en(1)
Apresentação de resultados q312 final en(1)Apresentação de resultados q312 final en(1)
Apresentação de resultados q312 final en(1)vigor_ri
 
Stanford 80410 a
Stanford 80410 aStanford 80410 a
Stanford 80410 aMark Leslie
 
Resultados 2 q12 final - inglês
Resultados 2 q12   final - inglêsResultados 2 q12   final - inglês
Resultados 2 q12 final - inglêsvigor_ri
 
Vera Bradley Final Presentation
Vera Bradley Final PresentationVera Bradley Final Presentation
Vera Bradley Final PresentationBashayer Baljon
 
Natureview
NatureviewNatureview
Natureview
Raghav Jalan
 
Qliro Group Q4 and year-end results 2016
Qliro Group Q4 and year-end  results 2016Qliro Group Q4 and year-end  results 2016
Qliro Group Q4 and year-end results 2016
qlirogroup
 
Final project
Final projectFinal project
Final project
Alexander P. Garza
 
Qliro Group Q4 2016
Qliro Group Q4 2016Qliro Group Q4 2016
Qliro Group Q4 2016
qlirogroup
 
Qliro group presentation Q1 2017
Qliro group presentation Q1 2017Qliro group presentation Q1 2017
Qliro group presentation Q1 2017
qlirogroup
 
dover Q306_Slides_2
dover Q306_Slides_2dover Q306_Slides_2
dover Q306_Slides_2finance30
 

Similar to Chewy Company Debrief (20)

Applied Business Managment BoD PPT
Applied Business Managment BoD PPTApplied Business Managment BoD PPT
Applied Business Managment BoD PPT
 
Natureview farm
Natureview  farm  Natureview  farm
Natureview farm
 
dover Q206_Slides
dover Q206_Slidesdover Q206_Slides
dover Q206_Slides
 
The_4_Sales_Reports_for_CEO
The_4_Sales_Reports_for_CEOThe_4_Sales_Reports_for_CEO
The_4_Sales_Reports_for_CEO
 
Apresentacao 4 t12_eng
Apresentacao 4 t12_engApresentacao 4 t12_eng
Apresentacao 4 t12_eng
 
4 q12 results presentation
4 q12 results presentation4 q12 results presentation
4 q12 results presentation
 
Motilal Oswal reiterate bullish long term view on United Spirits
Motilal Oswal reiterate bullish long term view on United SpiritsMotilal Oswal reiterate bullish long term view on United Spirits
Motilal Oswal reiterate bullish long term view on United Spirits
 
Final Presentation
Final PresentationFinal Presentation
Final Presentation
 
Natureview Harvard Case Study
Natureview Harvard Case Study Natureview Harvard Case Study
Natureview Harvard Case Study
 
Apresentação de resultados q312 final en(1)
Apresentação de resultados q312 final en(1)Apresentação de resultados q312 final en(1)
Apresentação de resultados q312 final en(1)
 
Stanford 80410 a
Stanford 80410 aStanford 80410 a
Stanford 80410 a
 
Resultados 2 q12 final - inglês
Resultados 2 q12   final - inglêsResultados 2 q12   final - inglês
Resultados 2 q12 final - inglês
 
Vera Bradley Final Presentation
Vera Bradley Final PresentationVera Bradley Final Presentation
Vera Bradley Final Presentation
 
Natureview
NatureviewNatureview
Natureview
 
Qliro Group Q4 and year-end results 2016
Qliro Group Q4 and year-end  results 2016Qliro Group Q4 and year-end  results 2016
Qliro Group Q4 and year-end results 2016
 
Go go cameras-1
Go go cameras-1Go go cameras-1
Go go cameras-1
 
Final project
Final projectFinal project
Final project
 
Qliro Group Q4 2016
Qliro Group Q4 2016Qliro Group Q4 2016
Qliro Group Q4 2016
 
Qliro group presentation Q1 2017
Qliro group presentation Q1 2017Qliro group presentation Q1 2017
Qliro group presentation Q1 2017
 
dover Q306_Slides_2
dover Q306_Slides_2dover Q306_Slides_2
dover Q306_Slides_2
 

Recently uploaded

India Orthopedic Devices Market: Unlocking Growth Secrets, Trends and Develop...
India Orthopedic Devices Market: Unlocking Growth Secrets, Trends and Develop...India Orthopedic Devices Market: Unlocking Growth Secrets, Trends and Develop...
India Orthopedic Devices Market: Unlocking Growth Secrets, Trends and Develop...
Kumar Satyam
 
Buy Verified PayPal Account | Buy Google 5 Star Reviews
Buy Verified PayPal Account | Buy Google 5 Star ReviewsBuy Verified PayPal Account | Buy Google 5 Star Reviews
Buy Verified PayPal Account | Buy Google 5 Star Reviews
usawebmarket
 
RMD24 | Debunking the non-endemic revenue myth Marvin Vacquier Droop | First ...
RMD24 | Debunking the non-endemic revenue myth Marvin Vacquier Droop | First ...RMD24 | Debunking the non-endemic revenue myth Marvin Vacquier Droop | First ...
RMD24 | Debunking the non-endemic revenue myth Marvin Vacquier Droop | First ...
BBPMedia1
 
Set off and carry forward of losses and assessment of individuals.pptx
Set off and carry forward of losses and assessment of individuals.pptxSet off and carry forward of losses and assessment of individuals.pptx
Set off and carry forward of losses and assessment of individuals.pptx
HARSHITHV26
 
Role of Remote Sensing and Monitoring in Mining
Role of Remote Sensing and Monitoring in MiningRole of Remote Sensing and Monitoring in Mining
Role of Remote Sensing and Monitoring in Mining
Naaraayani Minerals Pvt.Ltd
 
April 2024 Nostalgia Products Newsletter
April 2024 Nostalgia Products NewsletterApril 2024 Nostalgia Products Newsletter
April 2024 Nostalgia Products Newsletter
NathanBaughman3
 
Digital Transformation in PLM - WHAT and HOW - for distribution.pdf
Digital Transformation in PLM - WHAT and HOW - for distribution.pdfDigital Transformation in PLM - WHAT and HOW - for distribution.pdf
Digital Transformation in PLM - WHAT and HOW - for distribution.pdf
Jos Voskuil
 
Sustainability: Balancing the Environment, Equity & Economy
Sustainability: Balancing the Environment, Equity & EconomySustainability: Balancing the Environment, Equity & Economy
Sustainability: Balancing the Environment, Equity & Economy
Operational Excellence Consulting
 
Improving profitability for small business
Improving profitability for small businessImproving profitability for small business
Improving profitability for small business
Ben Wann
 
一比一原版加拿大渥太华大学毕业证(uottawa毕业证书)如何办理
一比一原版加拿大渥太华大学毕业证(uottawa毕业证书)如何办理一比一原版加拿大渥太华大学毕业证(uottawa毕业证书)如何办理
一比一原版加拿大渥太华大学毕业证(uottawa毕业证书)如何办理
taqyed
 
PriyoShop Celebration Pohela Falgun Mar 20, 2024
PriyoShop Celebration Pohela Falgun Mar 20, 2024PriyoShop Celebration Pohela Falgun Mar 20, 2024
PriyoShop Celebration Pohela Falgun Mar 20, 2024
PriyoShop.com LTD
 
chapter 10 - excise tax of transfer and business taxation
chapter 10 - excise tax of transfer and business taxationchapter 10 - excise tax of transfer and business taxation
chapter 10 - excise tax of transfer and business taxation
AUDIJEAngelo
 
Meas_Dylan_DMBS_PB1_2024-05XX_Revised.pdf
Meas_Dylan_DMBS_PB1_2024-05XX_Revised.pdfMeas_Dylan_DMBS_PB1_2024-05XX_Revised.pdf
Meas_Dylan_DMBS_PB1_2024-05XX_Revised.pdf
dylandmeas
 
Accpac to QuickBooks Conversion Navigating the Transition with Online Account...
Accpac to QuickBooks Conversion Navigating the Transition with Online Account...Accpac to QuickBooks Conversion Navigating the Transition with Online Account...
Accpac to QuickBooks Conversion Navigating the Transition with Online Account...
PaulBryant58
 
Exploring Patterns of Connection with Social Dreaming
Exploring Patterns of Connection with Social DreamingExploring Patterns of Connection with Social Dreaming
Exploring Patterns of Connection with Social Dreaming
Nicola Wreford-Howard
 
3.0 Project 2_ Developing My Brand Identity Kit.pptx
3.0 Project 2_ Developing My Brand Identity Kit.pptx3.0 Project 2_ Developing My Brand Identity Kit.pptx
3.0 Project 2_ Developing My Brand Identity Kit.pptx
tanyjahb
 
Pitch Deck Teardown: RAW Dating App's $3M Angel deck
Pitch Deck Teardown: RAW Dating App's $3M Angel deckPitch Deck Teardown: RAW Dating App's $3M Angel deck
Pitch Deck Teardown: RAW Dating App's $3M Angel deck
HajeJanKamps
 
Unveiling the Secrets How Does Generative AI Work.pdf
Unveiling the Secrets How Does Generative AI Work.pdfUnveiling the Secrets How Does Generative AI Work.pdf
Unveiling the Secrets How Does Generative AI Work.pdf
Sam H
 
CADAVER AS OUR FIRST TEACHER anatomt in your.pptx
CADAVER AS OUR FIRST TEACHER anatomt in your.pptxCADAVER AS OUR FIRST TEACHER anatomt in your.pptx
CADAVER AS OUR FIRST TEACHER anatomt in your.pptx
fakeloginn69
 
Global Interconnection Group Joint Venture[960] (1).pdf
Global Interconnection Group Joint Venture[960] (1).pdfGlobal Interconnection Group Joint Venture[960] (1).pdf
Global Interconnection Group Joint Venture[960] (1).pdf
Henry Tapper
 

Recently uploaded (20)

India Orthopedic Devices Market: Unlocking Growth Secrets, Trends and Develop...
India Orthopedic Devices Market: Unlocking Growth Secrets, Trends and Develop...India Orthopedic Devices Market: Unlocking Growth Secrets, Trends and Develop...
India Orthopedic Devices Market: Unlocking Growth Secrets, Trends and Develop...
 
Buy Verified PayPal Account | Buy Google 5 Star Reviews
Buy Verified PayPal Account | Buy Google 5 Star ReviewsBuy Verified PayPal Account | Buy Google 5 Star Reviews
Buy Verified PayPal Account | Buy Google 5 Star Reviews
 
RMD24 | Debunking the non-endemic revenue myth Marvin Vacquier Droop | First ...
RMD24 | Debunking the non-endemic revenue myth Marvin Vacquier Droop | First ...RMD24 | Debunking the non-endemic revenue myth Marvin Vacquier Droop | First ...
RMD24 | Debunking the non-endemic revenue myth Marvin Vacquier Droop | First ...
 
Set off and carry forward of losses and assessment of individuals.pptx
Set off and carry forward of losses and assessment of individuals.pptxSet off and carry forward of losses and assessment of individuals.pptx
Set off and carry forward of losses and assessment of individuals.pptx
 
Role of Remote Sensing and Monitoring in Mining
Role of Remote Sensing and Monitoring in MiningRole of Remote Sensing and Monitoring in Mining
Role of Remote Sensing and Monitoring in Mining
 
April 2024 Nostalgia Products Newsletter
April 2024 Nostalgia Products NewsletterApril 2024 Nostalgia Products Newsletter
April 2024 Nostalgia Products Newsletter
 
Digital Transformation in PLM - WHAT and HOW - for distribution.pdf
Digital Transformation in PLM - WHAT and HOW - for distribution.pdfDigital Transformation in PLM - WHAT and HOW - for distribution.pdf
Digital Transformation in PLM - WHAT and HOW - for distribution.pdf
 
Sustainability: Balancing the Environment, Equity & Economy
Sustainability: Balancing the Environment, Equity & EconomySustainability: Balancing the Environment, Equity & Economy
Sustainability: Balancing the Environment, Equity & Economy
 
Improving profitability for small business
Improving profitability for small businessImproving profitability for small business
Improving profitability for small business
 
一比一原版加拿大渥太华大学毕业证(uottawa毕业证书)如何办理
一比一原版加拿大渥太华大学毕业证(uottawa毕业证书)如何办理一比一原版加拿大渥太华大学毕业证(uottawa毕业证书)如何办理
一比一原版加拿大渥太华大学毕业证(uottawa毕业证书)如何办理
 
PriyoShop Celebration Pohela Falgun Mar 20, 2024
PriyoShop Celebration Pohela Falgun Mar 20, 2024PriyoShop Celebration Pohela Falgun Mar 20, 2024
PriyoShop Celebration Pohela Falgun Mar 20, 2024
 
chapter 10 - excise tax of transfer and business taxation
chapter 10 - excise tax of transfer and business taxationchapter 10 - excise tax of transfer and business taxation
chapter 10 - excise tax of transfer and business taxation
 
Meas_Dylan_DMBS_PB1_2024-05XX_Revised.pdf
Meas_Dylan_DMBS_PB1_2024-05XX_Revised.pdfMeas_Dylan_DMBS_PB1_2024-05XX_Revised.pdf
Meas_Dylan_DMBS_PB1_2024-05XX_Revised.pdf
 
Accpac to QuickBooks Conversion Navigating the Transition with Online Account...
Accpac to QuickBooks Conversion Navigating the Transition with Online Account...Accpac to QuickBooks Conversion Navigating the Transition with Online Account...
Accpac to QuickBooks Conversion Navigating the Transition with Online Account...
 
Exploring Patterns of Connection with Social Dreaming
Exploring Patterns of Connection with Social DreamingExploring Patterns of Connection with Social Dreaming
Exploring Patterns of Connection with Social Dreaming
 
3.0 Project 2_ Developing My Brand Identity Kit.pptx
3.0 Project 2_ Developing My Brand Identity Kit.pptx3.0 Project 2_ Developing My Brand Identity Kit.pptx
3.0 Project 2_ Developing My Brand Identity Kit.pptx
 
Pitch Deck Teardown: RAW Dating App's $3M Angel deck
Pitch Deck Teardown: RAW Dating App's $3M Angel deckPitch Deck Teardown: RAW Dating App's $3M Angel deck
Pitch Deck Teardown: RAW Dating App's $3M Angel deck
 
Unveiling the Secrets How Does Generative AI Work.pdf
Unveiling the Secrets How Does Generative AI Work.pdfUnveiling the Secrets How Does Generative AI Work.pdf
Unveiling the Secrets How Does Generative AI Work.pdf
 
CADAVER AS OUR FIRST TEACHER anatomt in your.pptx
CADAVER AS OUR FIRST TEACHER anatomt in your.pptxCADAVER AS OUR FIRST TEACHER anatomt in your.pptx
CADAVER AS OUR FIRST TEACHER anatomt in your.pptx
 
Global Interconnection Group Joint Venture[960] (1).pdf
Global Interconnection Group Joint Venture[960] (1).pdfGlobal Interconnection Group Joint Venture[960] (1).pdf
Global Interconnection Group Joint Venture[960] (1).pdf
 

Chewy Company Debrief

  • 1. Chewy and the Yumities Market Analysis of Cake, Cocoa and Candy brands Cake Cocoa Candy Team 03
  • 2. Yumities Market Chewy Whippit Tasty Savor New entry Walnut CHEAP Wafer Wizard Toffee Sushi STANDARD CHEAP Taco STANDARD PREMIUM Tomato Salad PREMIUM
  • 3. Repositioning Candy as Standard-Premium market Reasons No evident competitive advantage against main competitors Salad and Tomato, but high disavantage in key attributes in Premium Market Continuous spending on its marketing-mix in the previous three periods didn’t make it better than its competitors   Actions Price reduced by 3.40 $ Implementing the cost and quality R&D formulas
  • 4. Launch new product Cocoa in Standard Cheap Market Reasons Existing brands Cake and Candy were targeting the Cheap and the Standard-Premium market and company still didn’t have presence in the Standard-Cheap market. Standard-Cheap market share was 35% of the Yumities market    Actions A new formula, C07D-I, was developed with key attributes higher than the competitors’
  • 5. Comparative analysis of the company across periods From period 0 to 1 From period 1 to 2 Revenues + 4,5% Revenues (-4.7%) Brand contribution + 14,1% Brand contribution (-1.6%) EBIT + 10,1% EBIT (-1.5%) Increase in Brand contribution of Launch of brand tomato with high both brands cake and candy. key product attributes than Candy.
  • 6. Comparative analysis of the company across periods From period 2 to 3 From period 3 to 4 Revenues (-11.3%) Revenues +23,1% Brand contribution +0,8% Brand contribution (-27.6%) EBIT (-1.9%) EBIT (-40.7%) Although the cost formula for Candy was ✓ Launch of a new-product Cocoa implemented but the price was increased whereas ✓ Strong response by the competitors to the launch its competitor Salad improved the formula with only ✓ Negative contribution of Cocoa (-9500 k$) slight increase in price shadowed the good performance of other brands
  • 7. Comparative analysis of the company across periods From period 4 to 5 From period 5 to 6 Revenues +22,5% Revenues +19,7% Brand contribution +77,5% Brand contribution +48% EBIT +166,5% EBIT +65,5% ✓ Repositioning strategy of Candy worked out well ✓ Increase in sales revenue of Cocoa by 54% ✓ Brand contribution of Candy increased by 9000 k$ ✓ Increase in brand contribution of Candy by more ✓ An improvement formula for candy was than 10,000 k$ implemented
  • 9. Brand Cake - Main Performance CAKE is in a maturity of market with main competitor of WALNUT. Main objective for CAKE is to maintain its market performance, and allocate more resource and budget for CANDY and other new products on the company’s level. Low-price strategy is the most efficient way to stimulate sales; while other marketing tools such as advertising, store penetration and promotions are not that effective. However, due to the unsteady pricing strategy, consumers were quite confused and didn’t go for sales.
  • 10. Brand Cake - Main results CAKE P0 P1 P2 P3 P4 P5 P6 Unit  Sold 8724 9464   8813   6963   8308   8205   7959   Av  Retail  Price 7.08 6.39   6.90   6.89   6.40   6.36   5.90   Sales  Revenue 38826 38494   38250   30217   33067   32464   29230   Brand  ContribuBon 6288 7821   11747   7145   8920   8622   6926   MarkeBng  Budget 17336 16009   16040   14538   14718   14593   13567   Market  Share 7.10% 6.90% 6.30% 4.50% 4.70% 4.20% 3.50% WALNUT P0 P1 P2 P3 P4 P5 P6 Unit  Sold 8690 8310   9527   11019   10269   10482   10373   Av  Retail  Price 7.6 7.50   7.45   7.35   7.30   7.25   7.15   Sales  Revenue -­‐ -­‐ -­‐ -­‐ -­‐ -­‐ -­‐ Brand  ContribuBon -­‐ -­‐ -­‐ -­‐ -­‐ -­‐ -­‐ MarkeBng  Budget -­‐ -­‐ 16667   17255   18623   17367   -­‐ Market  Share 7.50% 7.10% 7.30% 7.60% 6.60% 6.00% 5.50%
  • 11. Brand Cake - Strategic Decision Adopt improved formula C03A-COST to lower down production cost at Period 0; Reduce the price over time as its target consumers are price sensitive; however, due to the unsteady/changeable price strategy, it is NOT effective enough to attract more consumer base or increase the units sold Reduce marketing budget over time and allocate more for the company’s new brand – COCOA as the first priority;
  • 12. Brand Candy - Strategic decisions Since Candy was in a Growth phase, company decided to invest more in. At the beginning we decided to not develop any formula waiting for new R&D discoveries in P1 and to know what were key attributes thanks to Market Studies. Starting Strategy Target - Highs and Affluents Families (in order of importance) Product - high value with good average attributes Price - high price but less high than the Salad one Place - specialty stores and in second instance, supermarkets Promotion - high investments in Adv and low investments in promotion
  • 13. Brand Candy - Strategic decisions Repositioning In P3, with the new competitor in P2 (Tomato) and the improvement of Salad (forecasted), the life-cycle of Candy in Premium market speeds up. So, we decided to reposition Candy the segment below: the Standard Premium. New Strategy Target - Affluents, Highs, Singles, Medium (in order of importance) Product - High quality (with new formula Improvement) Price - High Value for Money (High Quality and competitive price) Place - Trade marketing budget turned in specialty stores, supermarkets and mass merchandisers too to reach new target Promotion - Adv to reposition product on price and performance, increase of promotion budget to attract customers price sensitives
  • 14. Brand Candy - Main results Competition in Premium Market Competition in Standard-Premium Market CANDY P0 P1 P2 P3 P4 P5 P6 SALAD P0 P1 P2 P3 P4 P5 P6 Units  Sold 4.874 5.366 4.918 4.684 4.798 6.178 7.451 Units  Sold 5.018 5.000 6.500 8.000 8.000 8.141 7.644 Av  Retail  Price  ($) 26,50 25,41 25,36 25,50 22,11 23,09 22,64 Av  Retail  Price  ($) 28,10 27,65 27,25 27,45 27,75 28,00 28,30 Sales  Revenue  ($) 67.166 72.221 67.217 63.366 59.168 78.320 92.571 Sales  Revenue  ($) -­‐ -­‐ -­‐ -­‐ -­‐ -­‐ -­‐ Brand  ContribuAon  ($) 18.148 20.056 21.779 20.524 20.777 29.585 39.692 Brand  ContribuAon  ($) -­‐ -­‐ -­‐ -­‐ -­‐ -­‐ -­‐ MarkeAng  Budget  ($) 17.872 21.122 22.950 21.129 15.855 17.800 18.475 MarkeAng  Budget  ($) -­‐ -­‐ 26.051 25.389 25.150 25.355 -­‐ Market  Share  ($) 14,8% 15,6% 12,9% 11,2% 9,3% 11,4% 12,6% Market  Share  ($) 16,1% 15,8% 18,3% 20,6% 19,5% 18,2% 16,1% TACO P3 P4 P5 P6 TOMATO P0 P1 P2 P3 P4 P5 P6 Units  Sold 6.382 6.750 6.877 6.984 Units  Sold -­‐ -­‐ 2.446 3.882 5.219 6.711 7.601 Average  Retail  Price  ($) 22,20 22,50 22,70 22,95 Av  Retail  Price  ($) -­‐ -­‐ 26,65 26,90 27,25 27,45 27,75 Sales  Revenue  ($) -­‐ -­‐ -­‐ -­‐ Sales  Revenue  ($) -­‐ -­‐ -­‐ -­‐ -­‐ -­‐ -­‐ Brand  ContribuAon  ($) -­‐ -­‐ -­‐ -­‐ Brand  ContribuAon  ($) -­‐ -­‐ -­‐ -­‐ -­‐ -­‐ -­‐ MarkeAng  Budget  ($) 18.800 24.300 26.700 -­‐ MarkeAng  Budget  ($) -­‐ -­‐ 17.061 18.258 20.500 26.000 -­‐ Market  Share  ($) 13,3% 13,4% 12,5% 12,00% Market  Share  ($) -­‐ -­‐ 6,7% 9,8% 12,5% 14,7% 15,7%
  • 15. Cocoa - The new product Cocoa is a Chewy’s new product launched in Period 4 The reasons for launching: Competitor Whippit launched new brand Wizard We was not in the 35% of the market (Standard-Cheap) Cake’s market share was going down for the maturity of the product Improve Chewy’s total performance and revenue
  • 16. Cocoa - Physical attributes comparison Physical  ALributes  (0-­‐100) Avg.  Retail   Est.  Unit Firm Brand Performance  NutriAon  Packaging Flavor ackaging   Price  ($) Cost($) Chewy COCOA 55 55 35 45 16.90 3.4 Tasty TOFFEE 65 45 25 60 16.10 3.45 Savor SUSHI 60 57 56 40 16.40 3.4 Attributes of Marketed Brands in Period 4
  • 17. Budget Allocation, Price Markup and Market Share Budget Allocation Price Markup Market Share 30000 16,9 15% 25000 11,25% 16,65 20000 5993 4611 7,5% 15000 4699 16,4 10000 8979 9425 8480 16,15 3,75% 5000 5000 5000 6000 15,9 0% 0 P4 P5 P6 P4 P5 P6 P4 P5 P6 Promotion COCOA COCOA Trading TOFFEE TOFFEE Advertising SUSHI SUSHI
  • 18. Q&A BE FRIEND LY, THANKS =)
  • 19. Sales Profit Cake Candy Cocoa Time IntroducAon Growth Maturity Decline