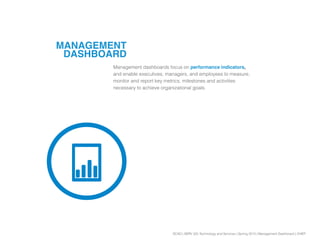
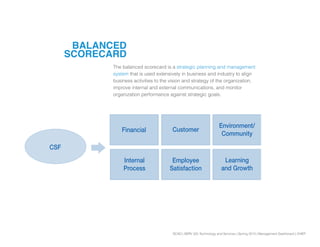
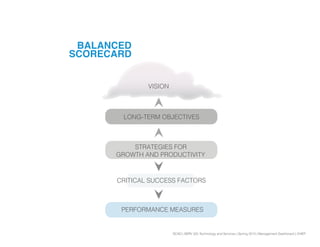
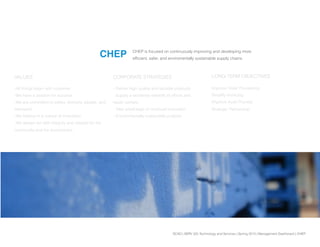
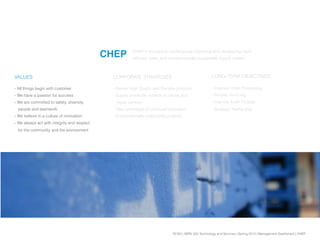
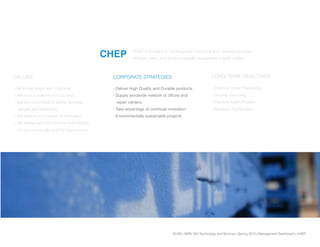
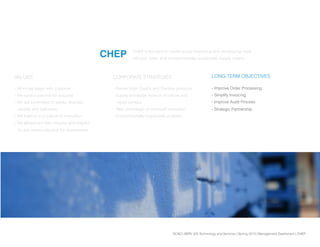
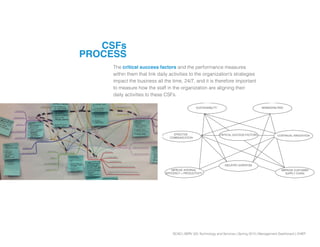
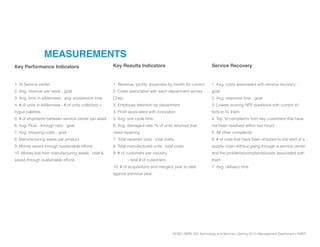
SlideShare a Scribd company logo
MANAGEMENT
DASHBOARD
SCAD | SERV 325 Technology and Services | Spring 2013 | Management Dashboard | CHEP
MANAGEMENT
Management dashboards focus on performance indicators,
and enable executives, managers, and employees to measure,
monitor and report key metrics, milestones and activities
necessary to achieve organizational goals.
DASHBOARD
SCAD | SERV 325 Technology and Services | Spring 2013 | Management Dashboard | CHEP
BALANCED
The balanced scorecard is a strategic planning and management
system that is used extensively in business and industry to align
business activities to the vision and strategy of the organization,
improve internal and external communications, and monitor
organization performance against strategic goals.
SCORECARD
Financial
Internal
Process
Customer
Employee
Satisfaction
Environment/
Community
Learning
and Growth
CSF
SCAD | SERV 325 Technology and Services | Spring 2013 | Management Dashboard | CHEP
VISION
LONG-TERM OBJECTIVES
STRATEGIES FOR
GROWTH AND PRODUCTIVITY
CRITICAL SUCCESS FACTORS
PERFORMANCE MEASURES
BALANCED
SCORECARD
SCAD | SERV 325 Technology and Services | Spring 2013 | Management Dashboard | CHEP
CHEP
We decided to work with CHEP in order to learn more about how
a service organization operates from a business to business
perspective. CHEP is the leading provider of pallet, container,
and crate pooling services for many of the world’s largest
supply chains.
SCAD | SERV 325 Technology and Services | Spring 2013 | Management Dashboard | CHEP
VALUES CORPORATE STRATEGIES
CHEP is focused on continuously improving and developing more
efficient, safer, and enviromentally sustainable supply chains.
-All things begin with customer.
-We have a passion for success.
-We are committed to safety, diversity, people, and
teamwork.
-We believe in a culture of innovation
-We always act with integrity and respect for the
community and the environment.
- Deliver high quality and durable products
- Supply a wordwide network of offices and
repair centers
- Take advantage of continual innovation
- Environmentally sustainable projects
CHEP
Improve Order Processing
Simplify Invoicing
Improve Audit Process
Strategic Partnership
LONG-TERM OBJECTIVES
SCAD | SERV 325 Technology and Services | Spring 2013 | Management Dashboard | CHEP
VALUES CORPORATE STRATEGIES
CHEP is focused on continuously improving and developing more
efficient, safer, and environmentally sustainable supply chains.
CHEP
LONG-TERM OBJECTIVES
- Deliver High Quality and Durable products
- Supply wordwide network of offices and
repair centers
- Take advantage of continual innovation
- Environmentally sustainable projects
- All things begin with customer
- We have a passion for success
- We are committed to safety, diversity,
people and teamwork
- We believe in a culture of innovation
- We always act with integrity and respect
for the community and the environment
- Improve Order Processing
- Simplify Invoicing
- Improve Audit Process
- Strategic Partnership
SCAD | SERV 325 Technology and Services | Spring 2013 | Management Dashboard | CHEP
VALUES CORPORATE STRATEGIES
CHEP
LONG-TERM OBJECTIVES
CHEP is focused on continuously improving and developing more
efficient, safer, and environmentally sustainable supply chains.
- Deliver High Quality and Durable products
- Supply wordwide network of offices and
repair centers
- Take advantage of continual innovation
- Environmentally sustainable projects
- All things begin with customer
- We have a passion for success
- We are committed to safety, diversity,
people and teamwork
- We believe in a culture of innovation
- We always act with integrity and respect
for the community and the environment
- Improve Order Processing
- Simplify Invoicing
- Improve Audit Process
- Strategic Partnership
SCAD | SERV 325 Technology and Services | Spring 2013 | Management Dashboard | CHEP
VALUES CORPORATE STRATEGIES
- Deliver High Quality and Durable products
- Supply wordwide network of offices and
repair centers
- Take advantage of continual innovation
- Environmentally sustainable projects
CHEP
LONG-TERM OBJECTIVES
CHEP is focused on continuously improving and developing more
efficient, safer, and environmentally sustainable supply chains.
- All things begin with customer
- We have a passion for success
- We are committed to safety, diversity,
people and teamwork
- We believe in a culture of innovation
- We always act with integrity and respect
for the community and the environment
- Improve Order Processing
- Simplify Invoicing
- Improve Audit Process
- Strategic Partnership
SCAD | SERV 325 Technology and Services | Spring 2013 | Management Dashboard | CHEP
INITIAL RESEARCH
SCAD | SERV 325 Technology and Services | Spring 2013 | Management Dashboard | CHEP
CORE SERVICE
Shipping Equipment
Pooling Services
FACILITATING SERVICES
Product Delivery and
Collection,
Electronic Data
Interchange
ENHANCING SERVICES
LeanLogistics,
CHEP Portfolio +Plus
DELIVERY SYSTEM
Service Centers
CHEP Portfolio +Plus
SERVICE
PACKAGE
SCAD | SERV 325 Technology and Services | Spring 2013 | Management Dashboard | CHEP
TRIGGER Customer receives equipment
at facilities and introduces it to
supply chain operations
CHEP Service Center issues
equipment to customer
Customer loads product into
CHEP equipment and ships
through supply chain
Receiving business unloads the
goods and returns the equipment to
the nearest CHEP Service Center
CHEP inspects and conditions all
returned equipment to ensure it meets
quality standards
SERVICE
DELIVERY SYSTEM
SCAD | SERV 325 Technology and Services | Spring 2013 | Management Dashboard | CHEP
Customer
Logistics Manager
Sales Representative
Depot Manager
Driver
Security Officers
Invoice Clerk
Pallet Clerk
Suppliers
Contractors
STAKEHOLDER MAP
SCAD | SERV 325 Technology and Services | Spring 2013 | Management Dashboard | CHEP
INITIAL
BLUEPRINT
SCAD | SERV 325 Technology and Services | Spring 2013 | Management Dashboard | CHEP
INTERVIEW
“The US model is more streamlined from the
manufacturer’s side, but then it gets weak.”
-We learned about supply chain operations and where CHEP fits in.
-Our contact, Dale told us how CHEP already offers management
dashboards to each department.
-CHEP has over 100 metrics, which helped us grasp what their
KRIs, KPIs, and Service Recoveries were.
-CHEP does not deliver the pallets from place to place, once they
are out of CHEPs center the client is responsible.
SCAD | SERV 325 Technology and Services | Spring 2013 | Management Dashboard | CHEP
RESEARCH REFINEMENT
SCAD | SERV 325 Technology and Services | Spring 2013 | Management Dashboard | CHEP
LEIGHTON
farms
LEIGHTON FARMS
Apple Juice Co.
Leighton Farms is one of the top apple juice distributors in the US. they
grow and harvest fresh apples and process them into fresh apple juice. The
company is known for the freshness of the juice and apples they deliver to
retailers across the country. Taking pride in the qualty of their product, Leighton
Farms sees the necessity of the secure movement of their product through the
supply chain and chose CHEP because of the consistent quality and durability
of their products.
Understanding the importance of the environment’s health to the success of
their product, Leighton Farms takes careful consideration in the sustainability
and eco-friendliness of their decisions. Bu utilizing CHEP’s services,
Leighton Farms can easily transport their products with minimal waste. And
CHEP’s pooling services not only help Leighton Farms reduce costs driven
by traditional one-way packaging, but also help the company maintain a
sustainable image.
Leighton Farm’s management uses CHEP’s online customer portal,
Portfolio+Plus, to plan and manage daily operations as well as analyze the
company’s pallet activity in real-time. Leighton Farms has experienced drastic
improvements to their operations since implementing CHEP’s services.
Goals
- To deliver their products safely and on time
- To develop a lasting partnership with CHEP
Needs
- Security: a quality product
- Efficiency: no wasted time and money
- Sustainability: an eco-friendly option
SCAD | SERV 325 Technology and Services | Spring 2013 | Management Dashboard | CHEP
TANGIBLE/
PHYSICAL
EVIDENCE
CUSTOMER
ACTIONS
FRONT
STAGE
BACK
STAGE
SUPPORT
SYSTEMS
Line of interaction
Line of visibility
Line of internal interaction
BUILD REPAIRDELIVERSUPPLY COLLECT
Portfolio+Plus
Conditions
or Repairs
Pallets
Truck Service
Products
Shipped through
Supply Chain
Receives
Large
Order
Returns Pallets
to Service
Centre
Quality
Control
Processes
Order
EDI
Lean
Logistics
Debits
Company
Account
NPS
Issues
Pallets
TRIGGER PRE-SERVICE DURING AFTER
Requests
Pallets
Receives
Pallets
Loads
Pallets
Ships
Pallets
Tracks
Request
Logs onto
Customer
Portal
Manages
Shipment
Delivers
Pallets
Organizes
Shipments
Collects
Pallets
Re-delivers
Pallets
Places Equipment
Order and Monitors
Request Status
Views Past Orders Monitors Shipment
via Dashboard
Inspects, Re-
pairs, and Condi-
tions Pallets
Builds
Pallet
Inspects
Pallets
Retailer
Receives
Goods
Pallet
! !
SERVICE
BLUEPRINT
We created a service blueprint, a visual map of the sequence of CHEP’s
activities required for successful service delivery.
We used this blueprint to identify problems within CHEP’s service offerings.
SCAD | SERV 325 Technology and Services | Spring 2013 | Management Dashboard | CHEP
Truck Service
Products
Shipped through
Supply Chain
Returns Pallets
to Service
Centre
Issues
Pallets
AFTER
Receives
Pallets
Loads
Pallets
Ships
Pallets
Tracks
Request
Manages
Shipment
Delivers
Pallets
Organizes
Shipments
Collects
Pallets
s Monitors Shipment
via Dashboard
Inspects, Re-
pairs, and Condi-
tions Pallets
In
P
Retailer
Receives
Goods
!
SERVICE
BLUEPRINT
We created a service blueprint, a visual map of the sequence of CHEP’s
activities required for successful service delivery.
We used this blueprint to identify problems within CHEP’s service offerings.
SCAD | SERV 325 Technology and Services | Spring 2013 | Management Dashboard | CHEP
MEASUREMENT IDENTIFICATION
SCAD | SERV 325 Technology and Services | Spring 2013 | Management Dashboard | CHEP
The critical success factors and the performance measures
within them that link daily activities to the organization’s strategies
impact the business all the time, 24/7, and it is therefore important
to measure how the staff in the organization are aligning their
daily activities to these CSFs.
CSFs
PROCESS
EFFECTIVE
COMMUNICATION
SUSTAINABILITY MINIMIZING RISK
INDUSTRY EXPERTISE
IMPROVE INTERNAL
EFFICENCY + PRODUCTIVITY
IMPROVE CUSTOMER
SUPPLY CHAIN
CRITICAL SUCCESS FACTORS CONTINUAL INNOVATION
SCAD | SERV 325 Technology and Services | Spring 2013 | Management Dashboard | CHEP
CSFs
Share Learnings
Transaction
Asset Managment
Education
Transparency
# of aquistions and
mergers year
to date against previous year
# of units in wilderness - # of
units collected = rogue pallets
Percentage of managers with
satisfactory IT literacy
Number of employees for skilled
job functions or positions
Percentage of managers with
satisfactory IT literacy
Number of photos in papers last
month, months2 to 3, and 4 to 6Number of positive press releas-
es issued to the press in the 30
days/60 days
Donations to
community
Industry ExpertiseLogistics
Supplier Diversity
Years of Experience
Outsourcing
Employee retention
by department
# of high performance
employees per position
per department
Name, training hours,
last recognition date, rewards
Number of sponsorships
projects in past 12 months
by company
Number of employees involved
in up-skilling local community
organizations
have been in the same position
for over two years
Number of projects that
contractors or consultants
Average mainframe
response time
Percentage of time IT program
developers have spent on
programming
Number of IT contractors as a
percentage of IT employess
systems
Manufacturing waste
per product
Money Saved through
Money lost from manufacturing
waste : total & saved through
Sustainability
Tree Farms
Lumber Quality
Lumber Sources Reduce / Reuse / Recycle
Carbon Footprint
Minimizing
Entries to environment/community
awards to be completed in the next
three months
# of units in wilderness - # of units
collected = rogue pallets
Energy consumed by
department
Percentage of recycled
material used as consumables
Percentage of waste generated
from concumables and is later
recycled
Improve Customer Supply
Save Customer time and money
Pooling Solutions ManagementHiring less Employees
Transport Services
Increase ProductivityCHEPP+
# of customers per industry
Total number of customers
All other complaints
Top 10 complaints from
key customers that have not
been resolved in 2 hours
Average response time : goal
Average delivery time
Average unit cycle time
Number of processes made
foolproof
Top 10 customers
# of units that have been shipped
without going through a service
center and the problems / complaints /
costs associated with them
Capital Equipment
Direct CostsIndirect Costs
Revenue
Logistics
Average shipping costs : goal
Number of shipments between
service centers per week
Average time in
wilderness : average posses-
sion time
Average revenue per
issue : goal
month for current year against
previous year
By industry by current year
against previous year
By product for current year
against previous year
Costs associated with each
department across CHEP
Total manufactured units : total costs
Average costs associated with
service recovery : goal
Average Flow - Through
Ratio : Goal
Bottom 10 service centers
Bottom 10 customers
Top 10 service centers
and Productivity
Total headquarters costs/em-
Total repaired units : total costs
Continual Innovation Easier for Customers to
do Business
Product / Services
Technology
Increase Quality
Fast and Straight-Forward
Businesses
Industry Trends
Planned innovations against
projected time
Pending innovations against
time taken and time on hold
In progress innovations
against time taken
Implemented innovations
against time taken
to implement
Innovation
Percentage of managers with
satisfactory IT literacy
Date of next innovation to
our key services
Investment in new product
support and training
Number of innovations
implemented last month by
team, reported to the CEO
Date of prototype completion
Percentage of days where key
systems were backed-up
at night this week
Investment in new product
support and training
Average damaged rate : percent
of units returned that
need repairing
Top 10 complaints from
key customers that have not been
resolved in 2 hours
All other complaints
Minimizing Risk
Risk Management
NET promoter system
Sale Work
Environment
Lowest scoring NPS questions
At Service Center
Awaiting Repair
Damaged rates per
reception
Average repairs
per week
Average repair
turnaround time
Average weekly
repair costs
Quality problems detected
during product audits
Initiatives completed from last
Employee complaint resolution
Unresolved
complaints
List of key customers for whom
time since last order is > xx weeks
Complaints not resolved during
Employee complaint resolution
Analysis of absenteeism
Calls on hold longer
than xx seconds
SCAD | SERV 325 Technology and Services | Spring 2013 | Management Dashboard | CHEP
CSFs
Share Learnings
Transaction
Asset Managment
Education
Transparency
# of aquistions and
mergers year
to date against previous year
# of units in wilderness - # of
units collected = rogue pallets
Percentage of managers with
satisfactory IT literacy
Number of employees for skilled
job functions or positions
Percentage of managers with
satisfactory IT literacy
days/60 days
Lumber Sources Reduce / Reuse / Recycle
nits Energy consumed by
department
Percentage of recycled
material used as consumables
Percentage of waste generated
from concumables and is later
recycled
Improve Customer Supply
Save Customer time and money
Pooling Solutions Managementees
Transport Services
Increase Productivity
# of customers per industry
al number of customers
Average response time : goal
Average delivery time
Average unit cycle time
Number of processes made
foolproof
Product / Services
In progress innovations
against time taken
Im
Percentage of managers with
satisfactory IT literacy
Number of innovations
implemented last month by
team, reported to the CEO
Top 10 complaints from
key customers that have not been
resolved in 2 hours
All other complaints
Minimizing Risk
NET promoter system
Sale Work
Environment
Lowest sco
At Service Center
Awaiting Repair
Damaged rates per
reception
Average repairs
per week
Average repair
turnaround time
Average weekly
repair costs
Unresolved
complaints
Complaints not resolved during
Employee complaint resolution
Analysis of absenteeism
Calls on hold longer
than xx seconds
SCAD | SERV 325 Technology and Services | Spring 2013 | Management Dashboard | CHEP
MEASUREMENTS
1. Revenue, profits, expenses by month for current
2. Costs associated with each department across
Chep
3. Employee retention by department
4. Profit associated with innovation
5. Avg. unit cycle time
6. Avg. damaged rate: % of units returned that
need repairing
7. Total repaired units : total costs
8. Total manufactured units : total costs
9. # of customers per industry
	 - total # of customers
10. # of acquisitions and mergers year to date
against previous year
1. At Service center
2. Avg. revenue per issue : goal
3. Avg. time in wilderness : avg. possession time
4. # of units in wilderness - # of units collected =
rogue palettes
5. # of shipments between service center per week
6. Avg. Flow - through ratio : goal
7. Avg. shipping costs : goal
8. Manufacturing waste per product
9. Money saved through sustainable efforts
10. Money lost from manufacturing waste : total &
saved through sustainable efforts
1. Avg. costs associated with service recovery :
goal
2. Avg. response time : goal
3. Lowest scoring NPS questions with current ef-
forts to fix them
4. Top 10 complaints from key customers that have
not been resolved within two hours
5. All other complaints
6. # of units that have been shipped to the start of a
supply chain without going through a service center
and the problems/complaints/costs associated with
them
7. Avg. delivery time
Key Performance Indicators Key Results Indicators Service Recovery
SCAD | SERV 325 Technology and Services | Spring 2013 | Management Dashboard | CHEP
WIREFRAMING
SCAD | SERV 325 Technology and Services | Spring 2013 | Management Dashboard | CHEP
DASHBOARDS
SCAD | SERV 325 Technology and Services | Spring 2013 | Management Dashboard | CHEP
MARK ELLIS
Corporate Finance Director
	 Mark’s position at CHEP revolves around operational cost efficiency,
performance, and profitability analysis. He uses complex financial modeling
and detailed management reporting to aid in CHEP’s decision-making and to
meet the company’s corporate objectives. Mark held a previous position at
CHEP as a logistics coordinator. His current position enables him to apply his
technical knowledge and supply chain experience to CHEP’s sales operations,
aiding in the effective identification of CHEP’s potential opportunities
and threats.
	 As the director of such an important department, Mark has little time
to focus on the nitty-gritty. He needs to see the most important statistics, and
quickly. CHEP’s high-level information dashboard allows Mark to obtain real
time reporting and strategic decision making tools, enabling him to effectively
visualize overall performance, identify the financial opportunities that drive
profitability, and manage CHEP’s existing customer base. He can visualize
both long-term effects of past actions and monitor the impact of day-to-day
happenings.
Goals
. To make informative decisions
. To identify any critical problems
Needs
. High -level information, simple navigation
Motivations
. Quick access to critical information
SCAD | SERV 325 Technology and Services | Spring 2013 | Management Dashboard | CHEP
USER SCENARIO
It is a normal day for Mark, he
needs up-to-date information and is
confident he will quickly find all the
information he needs about CHEP
pooling system in his performance
dashboard.
Mark is able to use his dashboard
anywhere he goes in the CHEP
facility. He steps away from his
desk and he receives a page from
a co-worker who has sent out the
plastic crates to their current client,
Leighton Apple Farm. He wants to
know the most up to date information
on the service recovery because the
crates had yet to arrive at the farm.
This information given to Mark on the
dashboard gives him a clear visual
to give his co-worker the average
delivery time on pallets.
After Mark comes back from a
meeting he decides to engage
with his co-workers about the late
delivery of plastic crates this morning.
He shows the information on his
Scorecard dashboard to show to them
exactly how the information works and
how easily accessible it is if there is a
failure.
Mark arrives to his other meeting and
feels very excited and connected
with the other co-workers in other
departments. The easy visualization
of complaints and other efforts of
innovation within the company always
reminds him of how his experience
and ideas are helping CHEP and their
pooling cycle.
SCAD | SERV 325 Technology and Services | Spring 2013 | Management Dashboard | CHEP
SCORECARD PERFORMANCE RECOVERY
SCAD | SERV 325 Technology and Services | Spring 2013 | Management Dashboard | CHEP
DESIGN AND INTERFACE
Easy Access:
Upon login, Mark
can choose which
dashboard he’d like to
start with.
Easy Navigation:
Mark may choose to
thumb the menu dot at
any time, which allows
him to access any
dashboard, as well as
system preferences and
help.
SCAD | SERV 325 Technology and Services | Spring 2013 | Management Dashboard | CHEP
SCORECARD
Key Result Indicators:
The Scorecard dashboard
displays several key result
indicators, allowing Mark
to visualize CHEP’s past
performance at a high
level.
Further Measurements:
Mark can click on a given
measurement to view further
pertinent measurements.
Dashboard Icon:
Mark can access the
other dashboards by
thumbing the menu
dot, which also acts as
an indicator of which
dashboad he is curently
viewing.
SCAD | SERV 325 Technology and Services | Spring 2013 | Management Dashboard | CHEP
PERFORMACE
Key Performance
Indicators:
Mark can use the
Performance dashboard
to keep an CHEP’s
current performance,
up to the very minute.
Further Measurements:
Mark can click on a given
measurement to view further
pertinent measurements.
SCAD | SERV 325 Technology and Services | Spring 2013 | Management Dashboard | CHEP
RECOVERY
A Measurement Mix:
The Recovery dashboard
allows Mark to see how
well CHEP is performing
as a service using a
mix of current and past
measurements.
Further Measurements:
Mark can click on a given
measurement to view further
pertinent measurements.
SCAD | SERV 325 Technology and Services | Spring 2013 | Management Dashboard | CHEP
SOURCES
Baltzan, Paige. M: Information Systems. Avenue of the Americas, New
York: McGraw-Hill/Irwin, 2013, 2011.
Caddick and Cable. Communicating the User Experience: A Practical
Guide for Creating Useful UX Documentation. West Sussex: John Wiley &
Sons Ltd, 2011.
Few, Stephen . Show Me the Numbers: Designing Tables and Graphs to
Enlighten. Burlingame, California: Analytics Press, 2012.
Lovelock and Wirtz, Services Marketing: People, Technology, Strategy.
New Jersey: Pearson Education, Inc., 2011.
Parmenter, David. Key performance indicators for government and non
profit agencies: implementing winning KPIS. Hoboken New Jersey: John
Wiley & Sons, Inc, 2012.
Stickdorn and Schneider. This is Service Design Thinking. New Jersey:
John Wiley & Sons, Inc., 2011.
SCAD | SERV 325 Technology and Services | Spring 2013 | Management Dashboard | CHEP
CHEP
Lincoln Neiger
Erika Bazo
Hannah Wilcox
Alesandra Gagnon
Technology and Services
Serv 311 Spring 2013 | SCAD
Prof. Robert Bau
THANK YOU
SCAD | SERV 325 Technology and Services | Spring 2013 | Management Dashboard | CHEP

More Related Content

What's hot

Credit risk manager kpi
Credit risk manager kpiCredit risk manager kpi
Credit risk manager kpi
vitrajom
 
Key Performance Indicators
Key Performance IndicatorsKey Performance Indicators
Key Performance Indicators
CIToolkit
 
Softengi Software Development Company Profile
Softengi Software Development Company ProfileSoftengi Software Development Company Profile
Softengi Software Development Company Profile
Softengi
 
Industry 4.0 at Kuehne + Nagel
Industry 4.0 at Kuehne + NagelIndustry 4.0 at Kuehne + Nagel
Industry 4.0 at Kuehne + Nagel
Srpska Logistička Asocijacija
 
ASI LOGISTICS COMPANY PROFILE 2015
ASI LOGISTICS COMPANY PROFILE 2015ASI LOGISTICS COMPANY PROFILE 2015
ASI LOGISTICS COMPANY PROFILE 2015
Eric TOUATI
 
Plan biznesi
Plan biznesiPlan biznesi
Plan biznesi
Diana Rama
 
Key Performance Indicators
Key Performance Indicators Key Performance Indicators
Key Performance Indicators
shady mohammed
 
Plani i biznesit 2014 librari elektronike
Plani i biznesit 2014 librari elektronikePlani i biznesit 2014 librari elektronike
Plani i biznesit 2014 librari elektronikeEsjona
 
Презентация EPAM(из материалов Любомира Остапива)
Презентация EPAM(из материалов Любомира Остапива)Презентация EPAM(из материалов Любомира Остапива)
Презентация EPAM(из материалов Любомира Остапива)
It Business School
 
Helping business with Digital Transformation
Helping business with Digital TransformationHelping business with Digital Transformation
Helping business with Digital Transformation
Digital Works Consulting
 
Kerry Logistics Corporate presentation
Kerry Logistics Corporate presentation Kerry Logistics Corporate presentation
Kerry Logistics Corporate presentation
Marcio Freitas
 
Telecommunication
TelecommunicationTelecommunication
Telecommunication
Amilakavinda
 
Stores manager kpi
Stores manager kpiStores manager kpi
Stores manager kpi
jomcerfus
 
Strategic Planning - Dialog submarine cable
Strategic Planning - Dialog submarine cableStrategic Planning - Dialog submarine cable
Strategic Planning - Dialog submarine cable
Buddhi Sulochana
 
A STUDY ON CUSTOMER’S SATISFACTION MARKS CARGO PRIVATE LIMITED - 2
A STUDY ON CUSTOMER’S SATISFACTION MARKS CARGO PRIVATE LIMITED -  2A STUDY ON CUSTOMER’S SATISFACTION MARKS CARGO PRIVATE LIMITED -  2
A STUDY ON CUSTOMER’S SATISFACTION MARKS CARGO PRIVATE LIMITED - 2
Yogesh Santhan
 
Management Information System
Management Information SystemManagement Information System
Management Information System
amana fathima
 
SAP S4/HANA meetup overview
SAP S4/HANA meetup overview SAP S4/HANA meetup overview
SAP S4/HANA meetup overview
Accenture Hungary
 

What's hot (17)

Credit risk manager kpi
Credit risk manager kpiCredit risk manager kpi
Credit risk manager kpi
 
Key Performance Indicators
Key Performance IndicatorsKey Performance Indicators
Key Performance Indicators
 
Softengi Software Development Company Profile
Softengi Software Development Company ProfileSoftengi Software Development Company Profile
Softengi Software Development Company Profile
 
Industry 4.0 at Kuehne + Nagel
Industry 4.0 at Kuehne + NagelIndustry 4.0 at Kuehne + Nagel
Industry 4.0 at Kuehne + Nagel
 
ASI LOGISTICS COMPANY PROFILE 2015
ASI LOGISTICS COMPANY PROFILE 2015ASI LOGISTICS COMPANY PROFILE 2015
ASI LOGISTICS COMPANY PROFILE 2015
 
Plan biznesi
Plan biznesiPlan biznesi
Plan biznesi
 
Key Performance Indicators
Key Performance Indicators Key Performance Indicators
Key Performance Indicators
 
Plani i biznesit 2014 librari elektronike
Plani i biznesit 2014 librari elektronikePlani i biznesit 2014 librari elektronike
Plani i biznesit 2014 librari elektronike
 
Презентация EPAM(из материалов Любомира Остапива)
Презентация EPAM(из материалов Любомира Остапива)Презентация EPAM(из материалов Любомира Остапива)
Презентация EPAM(из материалов Любомира Остапива)
 
Helping business with Digital Transformation
Helping business with Digital TransformationHelping business with Digital Transformation
Helping business with Digital Transformation
 
Kerry Logistics Corporate presentation
Kerry Logistics Corporate presentation Kerry Logistics Corporate presentation
Kerry Logistics Corporate presentation
 
Telecommunication
TelecommunicationTelecommunication
Telecommunication
 
Stores manager kpi
Stores manager kpiStores manager kpi
Stores manager kpi
 
Strategic Planning - Dialog submarine cable
Strategic Planning - Dialog submarine cableStrategic Planning - Dialog submarine cable
Strategic Planning - Dialog submarine cable
 
A STUDY ON CUSTOMER’S SATISFACTION MARKS CARGO PRIVATE LIMITED - 2
A STUDY ON CUSTOMER’S SATISFACTION MARKS CARGO PRIVATE LIMITED -  2A STUDY ON CUSTOMER’S SATISFACTION MARKS CARGO PRIVATE LIMITED -  2
A STUDY ON CUSTOMER’S SATISFACTION MARKS CARGO PRIVATE LIMITED - 2
 
Management Information System
Management Information SystemManagement Information System
Management Information System
 
SAP S4/HANA meetup overview
SAP S4/HANA meetup overview SAP S4/HANA meetup overview
SAP S4/HANA meetup overview
 

Viewers also liked

Ecr presentation jw
Ecr presentation jwEcr presentation jw
Ecr presentation jw
ECR Community
 
Capabilities presentation 100101 kk chep
Capabilities presentation 100101 kk   chepCapabilities presentation 100101 kk   chep
Capabilities presentation 100101 kk chep
흥규 김
 
Project Management KPIs
Project Management KPIsProject Management KPIs
Project Management KPIs
Tom Tsongas, PMP, CSM
 
Quality management dashboard
Quality management dashboardQuality management dashboard
Quality management dashboard
selinasimpson2901
 
CHEP Capabilities Brochure
CHEP Capabilities BrochureCHEP Capabilities Brochure
CHEP Capabilities Brochure
CHEP South Africa
 
e-Collaboration on Asia Pallet Pool System
e-Collaboration on Asia Pallet Pool Systeme-Collaboration on Asia Pallet Pool System
e-Collaboration on Asia Pallet Pool System
ECR Community
 
IPP Logipal Introduction
IPP Logipal IntroductionIPP Logipal Introduction
IPP Logipal Introduction
jboelaars
 
Knowledge design packaging, brands for businesses
Knowledge design packaging, brands for businessesKnowledge design packaging, brands for businesses
Knowledge design packaging, brands for businesses
BUG Corporation
 
Designing the perfect display monetization dashboard (public)
Designing the perfect display monetization dashboard (public)Designing the perfect display monetization dashboard (public)
Designing the perfect display monetization dashboard (public)
Ian Thomas
 
Measuring Effectiveness
Measuring EffectivenessMeasuring Effectiveness
Measuring Effectiveness
National Arts Strategies
 
Nabil Malik - Security performance metrics
Nabil Malik - Security performance metricsNabil Malik - Security performance metrics
Nabil Malik - Security performance metrics
nooralmousa
 
Helpdesk
HelpdeskHelpdesk
Helpdesk
shishir.jain
 
Metrics & Analytics That Matter - Steve Krull, CEO, Be Found Online
Metrics & Analytics That Matter - Steve Krull, CEO, Be Found OnlineMetrics & Analytics That Matter - Steve Krull, CEO, Be Found Online
Metrics & Analytics That Matter - Steve Krull, CEO, Be Found Online
BrightEdge Technologies
 
Lean Workbench For Creating And Tracking Metrics That Matter
Lean Workbench For Creating And Tracking Metrics That MatterLean Workbench For Creating And Tracking Metrics That Matter
Lean Workbench For Creating And Tracking Metrics That Matter
Jennifer Rubinovitz
 
DataPower Operations Dashboard
DataPower Operations DashboardDataPower Operations Dashboard
DataPower Operations Dashboard
IBM Integration
 

Viewers also liked (15)

Ecr presentation jw
Ecr presentation jwEcr presentation jw
Ecr presentation jw
 
Capabilities presentation 100101 kk chep
Capabilities presentation 100101 kk   chepCapabilities presentation 100101 kk   chep
Capabilities presentation 100101 kk chep
 
Project Management KPIs
Project Management KPIsProject Management KPIs
Project Management KPIs
 
Quality management dashboard
Quality management dashboardQuality management dashboard
Quality management dashboard
 
CHEP Capabilities Brochure
CHEP Capabilities BrochureCHEP Capabilities Brochure
CHEP Capabilities Brochure
 
e-Collaboration on Asia Pallet Pool System
e-Collaboration on Asia Pallet Pool Systeme-Collaboration on Asia Pallet Pool System
e-Collaboration on Asia Pallet Pool System
 
IPP Logipal Introduction
IPP Logipal IntroductionIPP Logipal Introduction
IPP Logipal Introduction
 
Knowledge design packaging, brands for businesses
Knowledge design packaging, brands for businessesKnowledge design packaging, brands for businesses
Knowledge design packaging, brands for businesses
 
Designing the perfect display monetization dashboard (public)
Designing the perfect display monetization dashboard (public)Designing the perfect display monetization dashboard (public)
Designing the perfect display monetization dashboard (public)
 
Measuring Effectiveness
Measuring EffectivenessMeasuring Effectiveness
Measuring Effectiveness
 
Nabil Malik - Security performance metrics
Nabil Malik - Security performance metricsNabil Malik - Security performance metrics
Nabil Malik - Security performance metrics
 
Helpdesk
HelpdeskHelpdesk
Helpdesk
 
Metrics & Analytics That Matter - Steve Krull, CEO, Be Found Online
Metrics & Analytics That Matter - Steve Krull, CEO, Be Found OnlineMetrics & Analytics That Matter - Steve Krull, CEO, Be Found Online
Metrics & Analytics That Matter - Steve Krull, CEO, Be Found Online
 
Lean Workbench For Creating And Tracking Metrics That Matter
Lean Workbench For Creating And Tracking Metrics That MatterLean Workbench For Creating And Tracking Metrics That Matter
Lean Workbench For Creating And Tracking Metrics That Matter
 
DataPower Operations Dashboard
DataPower Operations DashboardDataPower Operations Dashboard
DataPower Operations Dashboard
 

Similar to CHEP Management Dashboard Final Presentation

SWJ TECHNOLOGY Talent Acquisition
SWJ TECHNOLOGY Talent AcquisitionSWJ TECHNOLOGY Talent Acquisition
SWJ TECHNOLOGY Talent Acquisition
Amber Skinner
 
Burak kayabasi scm_cv_pre.
Burak kayabasi scm_cv_pre.Burak kayabasi scm_cv_pre.
Burak kayabasi scm_cv_pre.
Burak Kayabasi
 
How to build Rome in a day
How to build Rome in a dayHow to build Rome in a day
How to build Rome in a day
Scrum Australia Pty Ltd
 
SAP Strategy on Sustainability and AI
SAP Strategy on Sustainability and AISAP Strategy on Sustainability and AI
SAP Strategy on Sustainability and AI
Manish Singh
 
Mahendra Shah, Green-Lean V-6 Sigma BI BPM Evangelsit. Empowering Enterpris...
 Mahendra  Shah, Green-Lean V-6 Sigma BI BPM Evangelsit. Empowering Enterpris... Mahendra  Shah, Green-Lean V-6 Sigma BI BPM Evangelsit. Empowering Enterpris...
Mahendra Shah, Green-Lean V-6 Sigma BI BPM Evangelsit. Empowering Enterpris...
Mahendra Shah,
 
Lean six sigma and process excellence ppt
Lean six sigma and process excellence pptLean six sigma and process excellence ppt
Lean six sigma and process excellence ppt
Anexas Consultancy
 
Rapid Deployment of ERP solutions using agile practices by Husni Roukbi
Rapid Deployment of ERP solutions using agile practices by Husni Roukbi Rapid Deployment of ERP solutions using agile practices by Husni Roukbi
Rapid Deployment of ERP solutions using agile practices by Husni Roukbi
Agile ME
 
Kabeer credential feb 2021_v1.0
Kabeer credential  feb 2021_v1.0Kabeer credential  feb 2021_v1.0
Kabeer credential feb 2021_v1.0
dilipsadh
 
Collaborative Demand Planning: A Requirement for Successful Integrated Busine...
Collaborative Demand Planning: A Requirement for Successful Integrated Busine...Collaborative Demand Planning: A Requirement for Successful Integrated Busine...
Collaborative Demand Planning: A Requirement for Successful Integrated Busine...
Steelwedge
 
Lisa Ruddle CV 2016
Lisa Ruddle CV 2016Lisa Ruddle CV 2016
Lisa Ruddle CV 2016
Lisa Hodkinson
 
How To Align All Business Functions For Maximum ROI PowerPoint Presentation S...
How To Align All Business Functions For Maximum ROI PowerPoint Presentation S...How To Align All Business Functions For Maximum ROI PowerPoint Presentation S...
How To Align All Business Functions For Maximum ROI PowerPoint Presentation S...
SlideTeam
 
Savic Corporate Presentation
Savic Corporate PresentationSavic Corporate Presentation
Savic Corporate Presentation
Supriya SAVIC
 
Key Business Processes And Activities For Excellence PowerPoint Presentation ...
Key Business Processes And Activities For Excellence PowerPoint Presentation ...Key Business Processes And Activities For Excellence PowerPoint Presentation ...
Key Business Processes And Activities For Excellence PowerPoint Presentation ...
SlideTeam
 
Sap Business Analytics Services
Sap Business Analytics ServicesSap Business Analytics Services
Sap Business Analytics Services
dansapinsiderep
 
Aligning People, Processes and Technology in Field Service
Aligning People, Processes and Technology in Field ServiceAligning People, Processes and Technology in Field Service
Aligning People, Processes and Technology in Field Service
fieldaware1
 
Introduction to ACCELytics
Introduction to ACCELyticsIntroduction to ACCELytics
Introduction to ACCELytics
Kamal Verma
 
Lec 01 om b 02 09-2015
Lec 01 om b  02 09-2015Lec 01 om b  02 09-2015
Lec 01 om b 02 09-2015
Muhammad Zahid Maitlo
 
Blaine G Kriebel Professional Profile
Blaine G Kriebel Professional Profile  Blaine G Kriebel Professional Profile
Blaine G Kriebel Professional Profile
Blaine Kriebel
 
Cons & Trng - Lean Transformation
Cons & Trng - Lean TransformationCons & Trng - Lean Transformation
Cons & Trng - Lean Transformation
Ranjith Devadoss
 
Cons & Trng - Lean Transformation
Cons & Trng - Lean TransformationCons & Trng - Lean Transformation
Cons & Trng - Lean Transformation
Procexcellenz Business Services
 

Similar to CHEP Management Dashboard Final Presentation (20)

SWJ TECHNOLOGY Talent Acquisition
SWJ TECHNOLOGY Talent AcquisitionSWJ TECHNOLOGY Talent Acquisition
SWJ TECHNOLOGY Talent Acquisition
 
Burak kayabasi scm_cv_pre.
Burak kayabasi scm_cv_pre.Burak kayabasi scm_cv_pre.
Burak kayabasi scm_cv_pre.
 
How to build Rome in a day
How to build Rome in a dayHow to build Rome in a day
How to build Rome in a day
 
SAP Strategy on Sustainability and AI
SAP Strategy on Sustainability and AISAP Strategy on Sustainability and AI
SAP Strategy on Sustainability and AI
 
Mahendra Shah, Green-Lean V-6 Sigma BI BPM Evangelsit. Empowering Enterpris...
 Mahendra  Shah, Green-Lean V-6 Sigma BI BPM Evangelsit. Empowering Enterpris... Mahendra  Shah, Green-Lean V-6 Sigma BI BPM Evangelsit. Empowering Enterpris...
Mahendra Shah, Green-Lean V-6 Sigma BI BPM Evangelsit. Empowering Enterpris...
 
Lean six sigma and process excellence ppt
Lean six sigma and process excellence pptLean six sigma and process excellence ppt
Lean six sigma and process excellence ppt
 
Rapid Deployment of ERP solutions using agile practices by Husni Roukbi
Rapid Deployment of ERP solutions using agile practices by Husni Roukbi Rapid Deployment of ERP solutions using agile practices by Husni Roukbi
Rapid Deployment of ERP solutions using agile practices by Husni Roukbi
 
Kabeer credential feb 2021_v1.0
Kabeer credential  feb 2021_v1.0Kabeer credential  feb 2021_v1.0
Kabeer credential feb 2021_v1.0
 
Collaborative Demand Planning: A Requirement for Successful Integrated Busine...
Collaborative Demand Planning: A Requirement for Successful Integrated Busine...Collaborative Demand Planning: A Requirement for Successful Integrated Busine...
Collaborative Demand Planning: A Requirement for Successful Integrated Busine...
 
Lisa Ruddle CV 2016
Lisa Ruddle CV 2016Lisa Ruddle CV 2016
Lisa Ruddle CV 2016
 
How To Align All Business Functions For Maximum ROI PowerPoint Presentation S...
How To Align All Business Functions For Maximum ROI PowerPoint Presentation S...How To Align All Business Functions For Maximum ROI PowerPoint Presentation S...
How To Align All Business Functions For Maximum ROI PowerPoint Presentation S...
 
Savic Corporate Presentation
Savic Corporate PresentationSavic Corporate Presentation
Savic Corporate Presentation
 
Key Business Processes And Activities For Excellence PowerPoint Presentation ...
Key Business Processes And Activities For Excellence PowerPoint Presentation ...Key Business Processes And Activities For Excellence PowerPoint Presentation ...
Key Business Processes And Activities For Excellence PowerPoint Presentation ...
 
Sap Business Analytics Services
Sap Business Analytics ServicesSap Business Analytics Services
Sap Business Analytics Services
 
Aligning People, Processes and Technology in Field Service
Aligning People, Processes and Technology in Field ServiceAligning People, Processes and Technology in Field Service
Aligning People, Processes and Technology in Field Service
 
Introduction to ACCELytics
Introduction to ACCELyticsIntroduction to ACCELytics
Introduction to ACCELytics
 
Lec 01 om b 02 09-2015
Lec 01 om b  02 09-2015Lec 01 om b  02 09-2015
Lec 01 om b 02 09-2015
 
Blaine G Kriebel Professional Profile
Blaine G Kriebel Professional Profile  Blaine G Kriebel Professional Profile
Blaine G Kriebel Professional Profile
 
Cons & Trng - Lean Transformation
Cons & Trng - Lean TransformationCons & Trng - Lean Transformation
Cons & Trng - Lean Transformation
 
Cons & Trng - Lean Transformation
Cons & Trng - Lean TransformationCons & Trng - Lean Transformation
Cons & Trng - Lean Transformation
 

Recently uploaded

一比一原版(Vancouver毕业证书)温哥华岛大学毕业证如何办理
一比一原版(Vancouver毕业证书)温哥华岛大学毕业证如何办理一比一原版(Vancouver毕业证书)温哥华岛大学毕业证如何办理
一比一原版(Vancouver毕业证书)温哥华岛大学毕业证如何办理
ijk38lw
 
International Upcycling Research Network advisory board meeting 4
International Upcycling Research Network advisory board meeting 4International Upcycling Research Network advisory board meeting 4
International Upcycling Research Network advisory board meeting 4
Kyungeun Sung
 
LGBTQIA Pride Month presentation Template
LGBTQIA Pride Month presentation TemplateLGBTQIA Pride Month presentation Template
LGBTQIA Pride Month presentation Template
DakshGudwani
 
Divertidamente SLIDE.pptxufururururuhrurid8dj
Divertidamente SLIDE.pptxufururururuhrurid8djDivertidamente SLIDE.pptxufururururuhrurid8dj
Divertidamente SLIDE.pptxufururururuhrurid8dj
lunaemel03
 
NHR Engineers Portfolio 2023 2024 NISHANT RATHI
NHR Engineers Portfolio 2023 2024 NISHANT RATHINHR Engineers Portfolio 2023 2024 NISHANT RATHI
NHR Engineers Portfolio 2023 2024 NISHANT RATHI
NishantRathi18
 
欧洲杯买球-欧洲杯买球买球网好的网站-欧洲杯买球哪里有正规的买球网站|【​网址​🎉ac123.net🎉​】
欧洲杯买球-欧洲杯买球买球网好的网站-欧洲杯买球哪里有正规的买球网站|【​网址​🎉ac123.net🎉​】欧洲杯买球-欧洲杯买球买球网好的网站-欧洲杯买球哪里有正规的买球网站|【​网址​🎉ac123.net🎉​】
欧洲杯买球-欧洲杯买球买球网好的网站-欧洲杯买球哪里有正规的买球网站|【​网址​🎉ac123.net🎉​】
jafiradnan336
 
一比一原版(LaTrobe毕业证书)拉筹伯大学毕业证如何办理
一比一原版(LaTrobe毕业证书)拉筹伯大学毕业证如何办理一比一原版(LaTrobe毕业证书)拉筹伯大学毕业证如何办理
一比一原版(LaTrobe毕业证书)拉筹伯大学毕业证如何办理
67n7f53
 
一比一原版马来西亚世纪大学毕业证成绩单一模一样
一比一原版马来西亚世纪大学毕业证成绩单一模一样一比一原版马来西亚世纪大学毕业证成绩单一模一样
一比一原版马来西亚世纪大学毕业证成绩单一模一样
k4krdgxx
 
Introduction to User experience design for beginner
Introduction to User experience design for beginnerIntroduction to User experience design for beginner
Introduction to User experience design for beginner
ellemjani
 
Discovering the Best Indian Architects A Spotlight on Design Forum Internatio...
Discovering the Best Indian Architects A Spotlight on Design Forum Internatio...Discovering the Best Indian Architects A Spotlight on Design Forum Internatio...
Discovering the Best Indian Architects A Spotlight on Design Forum Internatio...
Designforuminternational
 
原版制作(MDIS毕业证书)新加坡管理发展学院毕业证学位证一模一样
原版制作(MDIS毕业证书)新加坡管理发展学院毕业证学位证一模一样原版制作(MDIS毕业证书)新加坡管理发展学院毕业证学位证一模一样
原版制作(MDIS毕业证书)新加坡管理发展学院毕业证学位证一模一样
hw2xf1m
 
按照学校原版(UIUC文凭证书)伊利诺伊大学|厄巴纳-香槟分校毕业证快速办理
按照学校原版(UIUC文凭证书)伊利诺伊大学|厄巴纳-香槟分校毕业证快速办理按照学校原版(UIUC文凭证书)伊利诺伊大学|厄巴纳-香槟分校毕业证快速办理
按照学校原版(UIUC文凭证书)伊利诺伊大学|厄巴纳-香槟分校毕业证快速办理
kuapy
 
NHL Stenden University of Applied Sciences Diploma Degree Transcript
NHL Stenden University of Applied Sciences Diploma Degree TranscriptNHL Stenden University of Applied Sciences Diploma Degree Transcript
NHL Stenden University of Applied Sciences Diploma Degree Transcript
lhtvqoag
 
ADESGN3S_Case-Study-Municipal-Health-Center.pdf
ADESGN3S_Case-Study-Municipal-Health-Center.pdfADESGN3S_Case-Study-Municipal-Health-Center.pdf
ADESGN3S_Case-Study-Municipal-Health-Center.pdf
GregMichaelTapawan
 
UXpert_Report (UALR Mapping Renewal 2022).pdf
UXpert_Report (UALR Mapping Renewal 2022).pdfUXpert_Report (UALR Mapping Renewal 2022).pdf
UXpert_Report (UALR Mapping Renewal 2022).pdf
anthonylin333
 
一比一原版布兰登大学毕业证(BU毕业证书)如何办理
一比一原版布兰登大学毕业证(BU毕业证书)如何办理一比一原版布兰登大学毕业证(BU毕业证书)如何办理
一比一原版布兰登大学毕业证(BU毕业证书)如何办理
wkip62b
 
一比一原版(LSBU毕业证书)伦敦南岸大学毕业证如何办理
一比一原版(LSBU毕业证书)伦敦南岸大学毕业证如何办理一比一原版(LSBU毕业证书)伦敦南岸大学毕业证如何办理
一比一原版(LSBU毕业证书)伦敦南岸大学毕业证如何办理
k7nm6tk
 
Graphic Design Tools and Software .pptx
Graphic Design Tools and Software   .pptxGraphic Design Tools and Software   .pptx
Graphic Design Tools and Software .pptx
Virtual Real Design
 
一比一原版肯特大学毕业证UKC成绩单一模一样
一比一原版肯特大学毕业证UKC成绩单一模一样一比一原版肯特大学毕业证UKC成绩单一模一样
一比一原版肯特大学毕业证UKC成绩单一模一样
tobbk6s8
 
一比一原版南安普顿索伦特大学毕业证Southampton成绩单一模一样
一比一原版南安普顿索伦特大学毕业证Southampton成绩单一模一样一比一原版南安普顿索伦特大学毕业证Southampton成绩单一模一样
一比一原版南安普顿索伦特大学毕业证Southampton成绩单一模一样
3vgr39kx
 

Recently uploaded (20)

一比一原版(Vancouver毕业证书)温哥华岛大学毕业证如何办理
一比一原版(Vancouver毕业证书)温哥华岛大学毕业证如何办理一比一原版(Vancouver毕业证书)温哥华岛大学毕业证如何办理
一比一原版(Vancouver毕业证书)温哥华岛大学毕业证如何办理
 
International Upcycling Research Network advisory board meeting 4
International Upcycling Research Network advisory board meeting 4International Upcycling Research Network advisory board meeting 4
International Upcycling Research Network advisory board meeting 4
 
LGBTQIA Pride Month presentation Template
LGBTQIA Pride Month presentation TemplateLGBTQIA Pride Month presentation Template
LGBTQIA Pride Month presentation Template
 
Divertidamente SLIDE.pptxufururururuhrurid8dj
Divertidamente SLIDE.pptxufururururuhrurid8djDivertidamente SLIDE.pptxufururururuhrurid8dj
Divertidamente SLIDE.pptxufururururuhrurid8dj
 
NHR Engineers Portfolio 2023 2024 NISHANT RATHI
NHR Engineers Portfolio 2023 2024 NISHANT RATHINHR Engineers Portfolio 2023 2024 NISHANT RATHI
NHR Engineers Portfolio 2023 2024 NISHANT RATHI
 
欧洲杯买球-欧洲杯买球买球网好的网站-欧洲杯买球哪里有正规的买球网站|【​网址​🎉ac123.net🎉​】
欧洲杯买球-欧洲杯买球买球网好的网站-欧洲杯买球哪里有正规的买球网站|【​网址​🎉ac123.net🎉​】欧洲杯买球-欧洲杯买球买球网好的网站-欧洲杯买球哪里有正规的买球网站|【​网址​🎉ac123.net🎉​】
欧洲杯买球-欧洲杯买球买球网好的网站-欧洲杯买球哪里有正规的买球网站|【​网址​🎉ac123.net🎉​】
 
一比一原版(LaTrobe毕业证书)拉筹伯大学毕业证如何办理
一比一原版(LaTrobe毕业证书)拉筹伯大学毕业证如何办理一比一原版(LaTrobe毕业证书)拉筹伯大学毕业证如何办理
一比一原版(LaTrobe毕业证书)拉筹伯大学毕业证如何办理
 
一比一原版马来西亚世纪大学毕业证成绩单一模一样
一比一原版马来西亚世纪大学毕业证成绩单一模一样一比一原版马来西亚世纪大学毕业证成绩单一模一样
一比一原版马来西亚世纪大学毕业证成绩单一模一样
 
Introduction to User experience design for beginner
Introduction to User experience design for beginnerIntroduction to User experience design for beginner
Introduction to User experience design for beginner
 
Discovering the Best Indian Architects A Spotlight on Design Forum Internatio...
Discovering the Best Indian Architects A Spotlight on Design Forum Internatio...Discovering the Best Indian Architects A Spotlight on Design Forum Internatio...
Discovering the Best Indian Architects A Spotlight on Design Forum Internatio...
 
原版制作(MDIS毕业证书)新加坡管理发展学院毕业证学位证一模一样
原版制作(MDIS毕业证书)新加坡管理发展学院毕业证学位证一模一样原版制作(MDIS毕业证书)新加坡管理发展学院毕业证学位证一模一样
原版制作(MDIS毕业证书)新加坡管理发展学院毕业证学位证一模一样
 
按照学校原版(UIUC文凭证书)伊利诺伊大学|厄巴纳-香槟分校毕业证快速办理
按照学校原版(UIUC文凭证书)伊利诺伊大学|厄巴纳-香槟分校毕业证快速办理按照学校原版(UIUC文凭证书)伊利诺伊大学|厄巴纳-香槟分校毕业证快速办理
按照学校原版(UIUC文凭证书)伊利诺伊大学|厄巴纳-香槟分校毕业证快速办理
 
NHL Stenden University of Applied Sciences Diploma Degree Transcript
NHL Stenden University of Applied Sciences Diploma Degree TranscriptNHL Stenden University of Applied Sciences Diploma Degree Transcript
NHL Stenden University of Applied Sciences Diploma Degree Transcript
 
ADESGN3S_Case-Study-Municipal-Health-Center.pdf
ADESGN3S_Case-Study-Municipal-Health-Center.pdfADESGN3S_Case-Study-Municipal-Health-Center.pdf
ADESGN3S_Case-Study-Municipal-Health-Center.pdf
 
UXpert_Report (UALR Mapping Renewal 2022).pdf
UXpert_Report (UALR Mapping Renewal 2022).pdfUXpert_Report (UALR Mapping Renewal 2022).pdf
UXpert_Report (UALR Mapping Renewal 2022).pdf
 
一比一原版布兰登大学毕业证(BU毕业证书)如何办理
一比一原版布兰登大学毕业证(BU毕业证书)如何办理一比一原版布兰登大学毕业证(BU毕业证书)如何办理
一比一原版布兰登大学毕业证(BU毕业证书)如何办理
 
一比一原版(LSBU毕业证书)伦敦南岸大学毕业证如何办理
一比一原版(LSBU毕业证书)伦敦南岸大学毕业证如何办理一比一原版(LSBU毕业证书)伦敦南岸大学毕业证如何办理
一比一原版(LSBU毕业证书)伦敦南岸大学毕业证如何办理
 
Graphic Design Tools and Software .pptx
Graphic Design Tools and Software   .pptxGraphic Design Tools and Software   .pptx
Graphic Design Tools and Software .pptx
 
一比一原版肯特大学毕业证UKC成绩单一模一样
一比一原版肯特大学毕业证UKC成绩单一模一样一比一原版肯特大学毕业证UKC成绩单一模一样
一比一原版肯特大学毕业证UKC成绩单一模一样
 
一比一原版南安普顿索伦特大学毕业证Southampton成绩单一模一样
一比一原版南安普顿索伦特大学毕业证Southampton成绩单一模一样一比一原版南安普顿索伦特大学毕业证Southampton成绩单一模一样
一比一原版南安普顿索伦特大学毕业证Southampton成绩单一模一样
 

CHEP Management Dashboard Final Presentation

  • 2. SCAD | SERV 325 Technology and Services | Spring 2013 | Management Dashboard | CHEP MANAGEMENT Management dashboards focus on performance indicators, and enable executives, managers, and employees to measure, monitor and report key metrics, milestones and activities necessary to achieve organizational goals. DASHBOARD
  • 3. SCAD | SERV 325 Technology and Services | Spring 2013 | Management Dashboard | CHEP BALANCED The balanced scorecard is a strategic planning and management system that is used extensively in business and industry to align business activities to the vision and strategy of the organization, improve internal and external communications, and monitor organization performance against strategic goals. SCORECARD Financial Internal Process Customer Employee Satisfaction Environment/ Community Learning and Growth CSF
  • 4. SCAD | SERV 325 Technology and Services | Spring 2013 | Management Dashboard | CHEP VISION LONG-TERM OBJECTIVES STRATEGIES FOR GROWTH AND PRODUCTIVITY CRITICAL SUCCESS FACTORS PERFORMANCE MEASURES BALANCED SCORECARD
  • 5. SCAD | SERV 325 Technology and Services | Spring 2013 | Management Dashboard | CHEP
  • 6. SCAD | SERV 325 Technology and Services | Spring 2013 | Management Dashboard | CHEP CHEP We decided to work with CHEP in order to learn more about how a service organization operates from a business to business perspective. CHEP is the leading provider of pallet, container, and crate pooling services for many of the world’s largest supply chains.
  • 7. SCAD | SERV 325 Technology and Services | Spring 2013 | Management Dashboard | CHEP VALUES CORPORATE STRATEGIES CHEP is focused on continuously improving and developing more efficient, safer, and enviromentally sustainable supply chains. -All things begin with customer. -We have a passion for success. -We are committed to safety, diversity, people, and teamwork. -We believe in a culture of innovation -We always act with integrity and respect for the community and the environment. - Deliver high quality and durable products - Supply a wordwide network of offices and repair centers - Take advantage of continual innovation - Environmentally sustainable projects CHEP Improve Order Processing Simplify Invoicing Improve Audit Process Strategic Partnership LONG-TERM OBJECTIVES
  • 8. SCAD | SERV 325 Technology and Services | Spring 2013 | Management Dashboard | CHEP VALUES CORPORATE STRATEGIES CHEP is focused on continuously improving and developing more efficient, safer, and environmentally sustainable supply chains. CHEP LONG-TERM OBJECTIVES - Deliver High Quality and Durable products - Supply wordwide network of offices and repair centers - Take advantage of continual innovation - Environmentally sustainable projects - All things begin with customer - We have a passion for success - We are committed to safety, diversity, people and teamwork - We believe in a culture of innovation - We always act with integrity and respect for the community and the environment - Improve Order Processing - Simplify Invoicing - Improve Audit Process - Strategic Partnership
  • 9. SCAD | SERV 325 Technology and Services | Spring 2013 | Management Dashboard | CHEP VALUES CORPORATE STRATEGIES CHEP LONG-TERM OBJECTIVES CHEP is focused on continuously improving and developing more efficient, safer, and environmentally sustainable supply chains. - Deliver High Quality and Durable products - Supply wordwide network of offices and repair centers - Take advantage of continual innovation - Environmentally sustainable projects - All things begin with customer - We have a passion for success - We are committed to safety, diversity, people and teamwork - We believe in a culture of innovation - We always act with integrity and respect for the community and the environment - Improve Order Processing - Simplify Invoicing - Improve Audit Process - Strategic Partnership
  • 10. SCAD | SERV 325 Technology and Services | Spring 2013 | Management Dashboard | CHEP VALUES CORPORATE STRATEGIES - Deliver High Quality and Durable products - Supply wordwide network of offices and repair centers - Take advantage of continual innovation - Environmentally sustainable projects CHEP LONG-TERM OBJECTIVES CHEP is focused on continuously improving and developing more efficient, safer, and environmentally sustainable supply chains. - All things begin with customer - We have a passion for success - We are committed to safety, diversity, people and teamwork - We believe in a culture of innovation - We always act with integrity and respect for the community and the environment - Improve Order Processing - Simplify Invoicing - Improve Audit Process - Strategic Partnership
  • 11. SCAD | SERV 325 Technology and Services | Spring 2013 | Management Dashboard | CHEP INITIAL RESEARCH
  • 12. SCAD | SERV 325 Technology and Services | Spring 2013 | Management Dashboard | CHEP CORE SERVICE Shipping Equipment Pooling Services FACILITATING SERVICES Product Delivery and Collection, Electronic Data Interchange ENHANCING SERVICES LeanLogistics, CHEP Portfolio +Plus DELIVERY SYSTEM Service Centers CHEP Portfolio +Plus SERVICE PACKAGE
  • 13. SCAD | SERV 325 Technology and Services | Spring 2013 | Management Dashboard | CHEP TRIGGER Customer receives equipment at facilities and introduces it to supply chain operations CHEP Service Center issues equipment to customer Customer loads product into CHEP equipment and ships through supply chain Receiving business unloads the goods and returns the equipment to the nearest CHEP Service Center CHEP inspects and conditions all returned equipment to ensure it meets quality standards SERVICE DELIVERY SYSTEM
  • 14. SCAD | SERV 325 Technology and Services | Spring 2013 | Management Dashboard | CHEP Customer Logistics Manager Sales Representative Depot Manager Driver Security Officers Invoice Clerk Pallet Clerk Suppliers Contractors STAKEHOLDER MAP
  • 15. SCAD | SERV 325 Technology and Services | Spring 2013 | Management Dashboard | CHEP
  • 16. SCAD | SERV 325 Technology and Services | Spring 2013 | Management Dashboard | CHEP INITIAL BLUEPRINT
  • 17. SCAD | SERV 325 Technology and Services | Spring 2013 | Management Dashboard | CHEP INTERVIEW “The US model is more streamlined from the manufacturer’s side, but then it gets weak.” -We learned about supply chain operations and where CHEP fits in. -Our contact, Dale told us how CHEP already offers management dashboards to each department. -CHEP has over 100 metrics, which helped us grasp what their KRIs, KPIs, and Service Recoveries were. -CHEP does not deliver the pallets from place to place, once they are out of CHEPs center the client is responsible.
  • 18. SCAD | SERV 325 Technology and Services | Spring 2013 | Management Dashboard | CHEP RESEARCH REFINEMENT
  • 19. SCAD | SERV 325 Technology and Services | Spring 2013 | Management Dashboard | CHEP LEIGHTON farms LEIGHTON FARMS Apple Juice Co. Leighton Farms is one of the top apple juice distributors in the US. they grow and harvest fresh apples and process them into fresh apple juice. The company is known for the freshness of the juice and apples they deliver to retailers across the country. Taking pride in the qualty of their product, Leighton Farms sees the necessity of the secure movement of their product through the supply chain and chose CHEP because of the consistent quality and durability of their products. Understanding the importance of the environment’s health to the success of their product, Leighton Farms takes careful consideration in the sustainability and eco-friendliness of their decisions. Bu utilizing CHEP’s services, Leighton Farms can easily transport their products with minimal waste. And CHEP’s pooling services not only help Leighton Farms reduce costs driven by traditional one-way packaging, but also help the company maintain a sustainable image. Leighton Farm’s management uses CHEP’s online customer portal, Portfolio+Plus, to plan and manage daily operations as well as analyze the company’s pallet activity in real-time. Leighton Farms has experienced drastic improvements to their operations since implementing CHEP’s services. Goals - To deliver their products safely and on time - To develop a lasting partnership with CHEP Needs - Security: a quality product - Efficiency: no wasted time and money - Sustainability: an eco-friendly option
  • 20. SCAD | SERV 325 Technology and Services | Spring 2013 | Management Dashboard | CHEP TANGIBLE/ PHYSICAL EVIDENCE CUSTOMER ACTIONS FRONT STAGE BACK STAGE SUPPORT SYSTEMS Line of interaction Line of visibility Line of internal interaction BUILD REPAIRDELIVERSUPPLY COLLECT Portfolio+Plus Conditions or Repairs Pallets Truck Service Products Shipped through Supply Chain Receives Large Order Returns Pallets to Service Centre Quality Control Processes Order EDI Lean Logistics Debits Company Account NPS Issues Pallets TRIGGER PRE-SERVICE DURING AFTER Requests Pallets Receives Pallets Loads Pallets Ships Pallets Tracks Request Logs onto Customer Portal Manages Shipment Delivers Pallets Organizes Shipments Collects Pallets Re-delivers Pallets Places Equipment Order and Monitors Request Status Views Past Orders Monitors Shipment via Dashboard Inspects, Re- pairs, and Condi- tions Pallets Builds Pallet Inspects Pallets Retailer Receives Goods Pallet ! ! SERVICE BLUEPRINT We created a service blueprint, a visual map of the sequence of CHEP’s activities required for successful service delivery. We used this blueprint to identify problems within CHEP’s service offerings.
  • 21. SCAD | SERV 325 Technology and Services | Spring 2013 | Management Dashboard | CHEP Truck Service Products Shipped through Supply Chain Returns Pallets to Service Centre Issues Pallets AFTER Receives Pallets Loads Pallets Ships Pallets Tracks Request Manages Shipment Delivers Pallets Organizes Shipments Collects Pallets s Monitors Shipment via Dashboard Inspects, Re- pairs, and Condi- tions Pallets In P Retailer Receives Goods ! SERVICE BLUEPRINT We created a service blueprint, a visual map of the sequence of CHEP’s activities required for successful service delivery. We used this blueprint to identify problems within CHEP’s service offerings.
  • 22. SCAD | SERV 325 Technology and Services | Spring 2013 | Management Dashboard | CHEP MEASUREMENT IDENTIFICATION
  • 23. SCAD | SERV 325 Technology and Services | Spring 2013 | Management Dashboard | CHEP The critical success factors and the performance measures within them that link daily activities to the organization’s strategies impact the business all the time, 24/7, and it is therefore important to measure how the staff in the organization are aligning their daily activities to these CSFs. CSFs PROCESS EFFECTIVE COMMUNICATION SUSTAINABILITY MINIMIZING RISK INDUSTRY EXPERTISE IMPROVE INTERNAL EFFICENCY + PRODUCTIVITY IMPROVE CUSTOMER SUPPLY CHAIN CRITICAL SUCCESS FACTORS CONTINUAL INNOVATION
  • 24. SCAD | SERV 325 Technology and Services | Spring 2013 | Management Dashboard | CHEP CSFs Share Learnings Transaction Asset Managment Education Transparency # of aquistions and mergers year to date against previous year # of units in wilderness - # of units collected = rogue pallets Percentage of managers with satisfactory IT literacy Number of employees for skilled job functions or positions Percentage of managers with satisfactory IT literacy Number of photos in papers last month, months2 to 3, and 4 to 6Number of positive press releas- es issued to the press in the 30 days/60 days Donations to community Industry ExpertiseLogistics Supplier Diversity Years of Experience Outsourcing Employee retention by department # of high performance employees per position per department Name, training hours, last recognition date, rewards Number of sponsorships projects in past 12 months by company Number of employees involved in up-skilling local community organizations have been in the same position for over two years Number of projects that contractors or consultants Average mainframe response time Percentage of time IT program developers have spent on programming Number of IT contractors as a percentage of IT employess systems Manufacturing waste per product Money Saved through Money lost from manufacturing waste : total & saved through Sustainability Tree Farms Lumber Quality Lumber Sources Reduce / Reuse / Recycle Carbon Footprint Minimizing Entries to environment/community awards to be completed in the next three months # of units in wilderness - # of units collected = rogue pallets Energy consumed by department Percentage of recycled material used as consumables Percentage of waste generated from concumables and is later recycled Improve Customer Supply Save Customer time and money Pooling Solutions ManagementHiring less Employees Transport Services Increase ProductivityCHEPP+ # of customers per industry Total number of customers All other complaints Top 10 complaints from key customers that have not been resolved in 2 hours Average response time : goal Average delivery time Average unit cycle time Number of processes made foolproof Top 10 customers # of units that have been shipped without going through a service center and the problems / complaints / costs associated with them Capital Equipment Direct CostsIndirect Costs Revenue Logistics Average shipping costs : goal Number of shipments between service centers per week Average time in wilderness : average posses- sion time Average revenue per issue : goal month for current year against previous year By industry by current year against previous year By product for current year against previous year Costs associated with each department across CHEP Total manufactured units : total costs Average costs associated with service recovery : goal Average Flow - Through Ratio : Goal Bottom 10 service centers Bottom 10 customers Top 10 service centers and Productivity Total headquarters costs/em- Total repaired units : total costs Continual Innovation Easier for Customers to do Business Product / Services Technology Increase Quality Fast and Straight-Forward Businesses Industry Trends Planned innovations against projected time Pending innovations against time taken and time on hold In progress innovations against time taken Implemented innovations against time taken to implement Innovation Percentage of managers with satisfactory IT literacy Date of next innovation to our key services Investment in new product support and training Number of innovations implemented last month by team, reported to the CEO Date of prototype completion Percentage of days where key systems were backed-up at night this week Investment in new product support and training Average damaged rate : percent of units returned that need repairing Top 10 complaints from key customers that have not been resolved in 2 hours All other complaints Minimizing Risk Risk Management NET promoter system Sale Work Environment Lowest scoring NPS questions At Service Center Awaiting Repair Damaged rates per reception Average repairs per week Average repair turnaround time Average weekly repair costs Quality problems detected during product audits Initiatives completed from last Employee complaint resolution Unresolved complaints List of key customers for whom time since last order is > xx weeks Complaints not resolved during Employee complaint resolution Analysis of absenteeism Calls on hold longer than xx seconds
  • 25. SCAD | SERV 325 Technology and Services | Spring 2013 | Management Dashboard | CHEP CSFs Share Learnings Transaction Asset Managment Education Transparency # of aquistions and mergers year to date against previous year # of units in wilderness - # of units collected = rogue pallets Percentage of managers with satisfactory IT literacy Number of employees for skilled job functions or positions Percentage of managers with satisfactory IT literacy days/60 days Lumber Sources Reduce / Reuse / Recycle nits Energy consumed by department Percentage of recycled material used as consumables Percentage of waste generated from concumables and is later recycled Improve Customer Supply Save Customer time and money Pooling Solutions Managementees Transport Services Increase Productivity # of customers per industry al number of customers Average response time : goal Average delivery time Average unit cycle time Number of processes made foolproof Product / Services In progress innovations against time taken Im Percentage of managers with satisfactory IT literacy Number of innovations implemented last month by team, reported to the CEO Top 10 complaints from key customers that have not been resolved in 2 hours All other complaints Minimizing Risk NET promoter system Sale Work Environment Lowest sco At Service Center Awaiting Repair Damaged rates per reception Average repairs per week Average repair turnaround time Average weekly repair costs Unresolved complaints Complaints not resolved during Employee complaint resolution Analysis of absenteeism Calls on hold longer than xx seconds
  • 26. SCAD | SERV 325 Technology and Services | Spring 2013 | Management Dashboard | CHEP MEASUREMENTS 1. Revenue, profits, expenses by month for current 2. Costs associated with each department across Chep 3. Employee retention by department 4. Profit associated with innovation 5. Avg. unit cycle time 6. Avg. damaged rate: % of units returned that need repairing 7. Total repaired units : total costs 8. Total manufactured units : total costs 9. # of customers per industry - total # of customers 10. # of acquisitions and mergers year to date against previous year 1. At Service center 2. Avg. revenue per issue : goal 3. Avg. time in wilderness : avg. possession time 4. # of units in wilderness - # of units collected = rogue palettes 5. # of shipments between service center per week 6. Avg. Flow - through ratio : goal 7. Avg. shipping costs : goal 8. Manufacturing waste per product 9. Money saved through sustainable efforts 10. Money lost from manufacturing waste : total & saved through sustainable efforts 1. Avg. costs associated with service recovery : goal 2. Avg. response time : goal 3. Lowest scoring NPS questions with current ef- forts to fix them 4. Top 10 complaints from key customers that have not been resolved within two hours 5. All other complaints 6. # of units that have been shipped to the start of a supply chain without going through a service center and the problems/complaints/costs associated with them 7. Avg. delivery time Key Performance Indicators Key Results Indicators Service Recovery
  • 27. SCAD | SERV 325 Technology and Services | Spring 2013 | Management Dashboard | CHEP WIREFRAMING
  • 28. SCAD | SERV 325 Technology and Services | Spring 2013 | Management Dashboard | CHEP
  • 29. SCAD | SERV 325 Technology and Services | Spring 2013 | Management Dashboard | CHEP DASHBOARDS
  • 30. SCAD | SERV 325 Technology and Services | Spring 2013 | Management Dashboard | CHEP MARK ELLIS Corporate Finance Director Mark’s position at CHEP revolves around operational cost efficiency, performance, and profitability analysis. He uses complex financial modeling and detailed management reporting to aid in CHEP’s decision-making and to meet the company’s corporate objectives. Mark held a previous position at CHEP as a logistics coordinator. His current position enables him to apply his technical knowledge and supply chain experience to CHEP’s sales operations, aiding in the effective identification of CHEP’s potential opportunities and threats. As the director of such an important department, Mark has little time to focus on the nitty-gritty. He needs to see the most important statistics, and quickly. CHEP’s high-level information dashboard allows Mark to obtain real time reporting and strategic decision making tools, enabling him to effectively visualize overall performance, identify the financial opportunities that drive profitability, and manage CHEP’s existing customer base. He can visualize both long-term effects of past actions and monitor the impact of day-to-day happenings. Goals . To make informative decisions . To identify any critical problems Needs . High -level information, simple navigation Motivations . Quick access to critical information
  • 31. SCAD | SERV 325 Technology and Services | Spring 2013 | Management Dashboard | CHEP USER SCENARIO It is a normal day for Mark, he needs up-to-date information and is confident he will quickly find all the information he needs about CHEP pooling system in his performance dashboard. Mark is able to use his dashboard anywhere he goes in the CHEP facility. He steps away from his desk and he receives a page from a co-worker who has sent out the plastic crates to their current client, Leighton Apple Farm. He wants to know the most up to date information on the service recovery because the crates had yet to arrive at the farm. This information given to Mark on the dashboard gives him a clear visual to give his co-worker the average delivery time on pallets. After Mark comes back from a meeting he decides to engage with his co-workers about the late delivery of plastic crates this morning. He shows the information on his Scorecard dashboard to show to them exactly how the information works and how easily accessible it is if there is a failure. Mark arrives to his other meeting and feels very excited and connected with the other co-workers in other departments. The easy visualization of complaints and other efforts of innovation within the company always reminds him of how his experience and ideas are helping CHEP and their pooling cycle.
  • 32. SCAD | SERV 325 Technology and Services | Spring 2013 | Management Dashboard | CHEP SCORECARD PERFORMANCE RECOVERY
  • 33. SCAD | SERV 325 Technology and Services | Spring 2013 | Management Dashboard | CHEP DESIGN AND INTERFACE Easy Access: Upon login, Mark can choose which dashboard he’d like to start with. Easy Navigation: Mark may choose to thumb the menu dot at any time, which allows him to access any dashboard, as well as system preferences and help.
  • 34. SCAD | SERV 325 Technology and Services | Spring 2013 | Management Dashboard | CHEP SCORECARD Key Result Indicators: The Scorecard dashboard displays several key result indicators, allowing Mark to visualize CHEP’s past performance at a high level. Further Measurements: Mark can click on a given measurement to view further pertinent measurements. Dashboard Icon: Mark can access the other dashboards by thumbing the menu dot, which also acts as an indicator of which dashboad he is curently viewing.
  • 35. SCAD | SERV 325 Technology and Services | Spring 2013 | Management Dashboard | CHEP PERFORMACE Key Performance Indicators: Mark can use the Performance dashboard to keep an CHEP’s current performance, up to the very minute. Further Measurements: Mark can click on a given measurement to view further pertinent measurements.
  • 36. SCAD | SERV 325 Technology and Services | Spring 2013 | Management Dashboard | CHEP RECOVERY A Measurement Mix: The Recovery dashboard allows Mark to see how well CHEP is performing as a service using a mix of current and past measurements. Further Measurements: Mark can click on a given measurement to view further pertinent measurements.
  • 37. SCAD | SERV 325 Technology and Services | Spring 2013 | Management Dashboard | CHEP SOURCES Baltzan, Paige. M: Information Systems. Avenue of the Americas, New York: McGraw-Hill/Irwin, 2013, 2011. Caddick and Cable. Communicating the User Experience: A Practical Guide for Creating Useful UX Documentation. West Sussex: John Wiley & Sons Ltd, 2011. Few, Stephen . Show Me the Numbers: Designing Tables and Graphs to Enlighten. Burlingame, California: Analytics Press, 2012. Lovelock and Wirtz, Services Marketing: People, Technology, Strategy. New Jersey: Pearson Education, Inc., 2011. Parmenter, David. Key performance indicators for government and non profit agencies: implementing winning KPIS. Hoboken New Jersey: John Wiley & Sons, Inc, 2012. Stickdorn and Schneider. This is Service Design Thinking. New Jersey: John Wiley & Sons, Inc., 2011.
  • 38. SCAD | SERV 325 Technology and Services | Spring 2013 | Management Dashboard | CHEP CHEP Lincoln Neiger Erika Bazo Hannah Wilcox Alesandra Gagnon Technology and Services Serv 311 Spring 2013 | SCAD Prof. Robert Bau THANK YOU
  • 39. SCAD | SERV 325 Technology and Services | Spring 2013 | Management Dashboard | CHEP