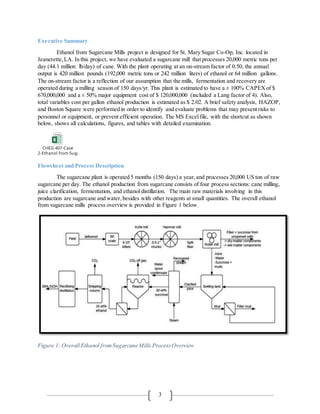
This document presents a process design for producing ethanol from sugarcane mills. Key aspects of the process include:
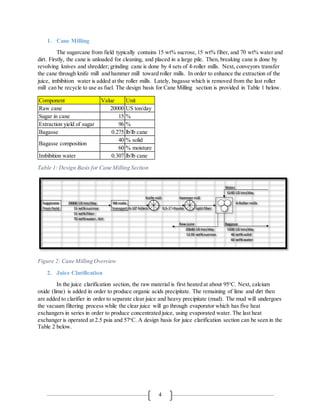
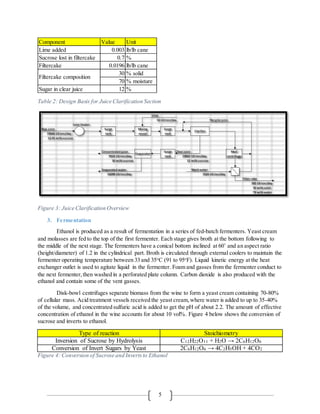
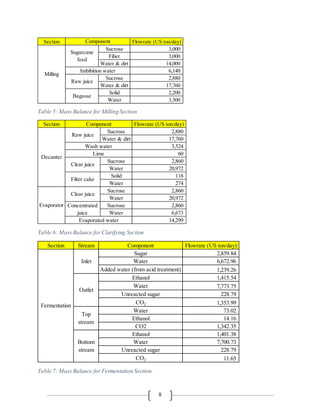
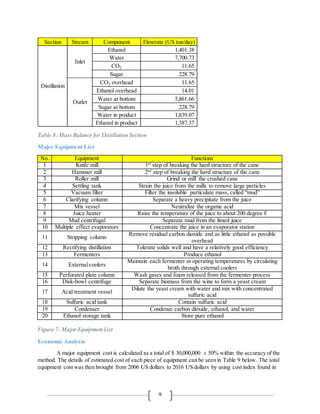
1) Cane milling to extract juice from sugarcane, followed by juice clarification to remove impurities.
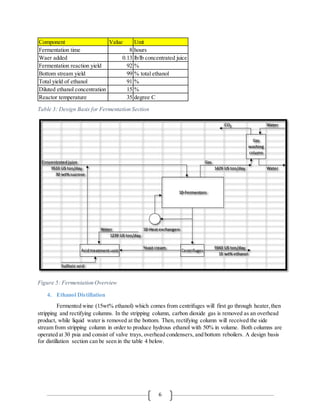
2) Fermentation of the clarified juice to produce ethanol. Multiple fermenters are used in a fed-batch process.
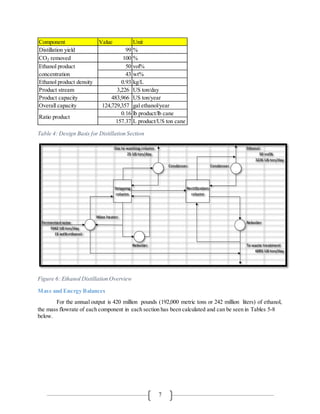
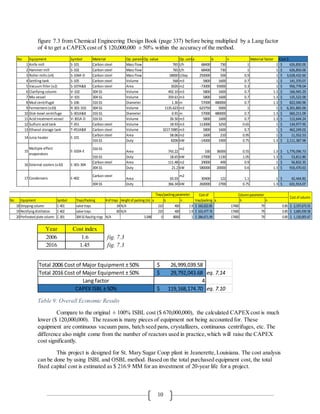
3) Distillation of the fermented broth using a stripping column and rectifying column to recover ethanol.
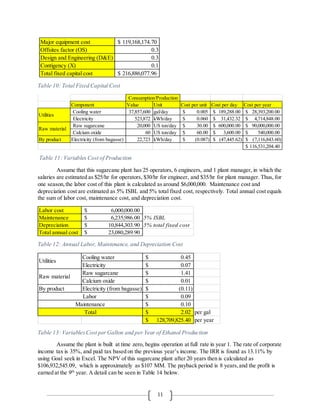
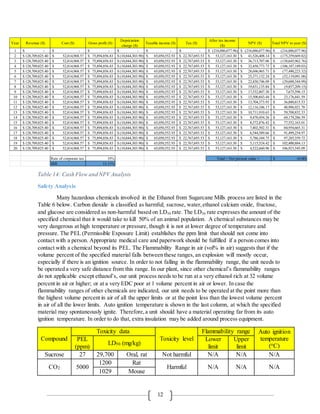
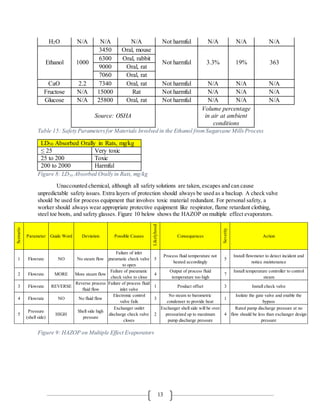
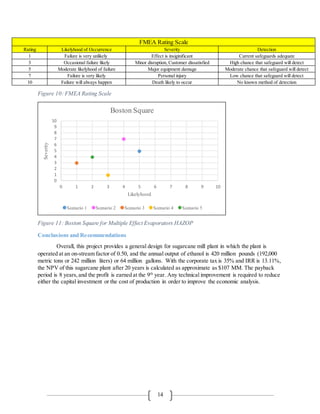
Mass and energy balances were developed for each section. Major equipment, economic analysis including capital and operating costs, and a safety analysis were also presented. The overall process is designed to produce 124.7 million gallons of ethanol per year
The document describes the design of a Karr reciprocating-plate extractor to separate a mixture of methylene chloride and methanol. The extractor is designed to separate a feed with mass flow rates of 2185 lb/h of methylene chloride and 33 lb/h of methanol, using water as the selective solvent at a mass flow rate of 2218 lb/h, to recover 95% of the methanol. The design process involves calculating the mass fractions, minimum solvent flow rate, extraction factor, number of equilibrium stages, and diameter and height of the extractor. The calculated diameter and height of the designed extractor are 10.42 inches and 7 feet, respectively.
The document discusses the design of a Karr reciprocating-plate extractor (T-102) for a liquid-liquid extraction process in a biodiesel production plant. Key details include:
- Methanol will be used as the key component for the extractor design due to its solubility in both the feed and solvent streams.
- Design calculations are provided for the methanol recovery, distribution coefficient, continuous phase flux, and mass fraction of methanol in the raffinate stream.
- The operating feed to minimum solvent flow rate ratio is calculated as 2.2 based on the methanol distribution coefficient and mass fractions. This ratio is used to determine the minimum solvent flow rate of 2775.08 kg/h for
This document is a lab report submitted by Bassam El Ghoul to Mr. Jamil Mahfoud on May 24, 2018 regarding an experiment using a colorimeter. The experiment tested various water and juice samples to measure color and concentration. Key findings included some mineral water brands showing minor impurities while distilled water and other brands showed no color. Darker juice samples like pomegranate had higher readings than lighter samples like pineapple. The experiment was subject to potential errors but provided conclusions on using colorimetry to determine concentration based on light absorption.
This experiment involves conducting a saponification reaction between sodium hydroxide (NaOH) and ethyl acetate (Et(Ac)) in a continuous stirred tank reactor (CSTR) to determine the effect of residence time on conversion. A calibration curve will be prepared to relate conductivity measurements to conversion values for the 0.1M NaOH and 0.1M Et(Ac) reaction. The objectives are to determine conversion, the reaction rate constant, and the effect of residence time on conversion.
The document is an internship report submitted by Abdul Rahim detailing his 4-week internship at a vegetable ghee manufacturing company. It includes an introduction to oils and fats, percentages of oil in various seeds, procedures for manufacturing vegetable ghee including pre-neutralization, bleaching, hydrogenation, and deodorization. It also includes flow diagrams, analytical methods to determine properties like FFA and moisture content, and safety procedures.
The document outlines the design of an MTBE plant that produces 2000 tons of MTBE per day. It discusses MTBE synthesis from methanol and isobutylene over a catalyst in a liquid-phase reactor. The process involves reacting a butenes stream containing isobutylene with methanol in a reactor, distilling the MTBE product, and recycling unreacted methanol. Safety considerations for the reactor, distillation columns, and process in general are also outlined.
Astm method for distillation of petroleum products at atmospheric pressureStudent
This document summarizes an experiment to determine the boiling range of kerosene using ASTM distillation. The experiment involves heating a 100mL gasoline sample in a distillation flask and measuring the temperature and volume percent distilled at intervals. A plot of the results shows the boiling range is 54-180°C. The document discusses how boiling range indicates a fuel's composition and properties, and how it affects safety, performance, and tendency to be explosive. Factors like vapor losses and condenser efficiency can impact the accuracy of the results.
Solvent extraction,Leaching, gas absorption equipmentVinithaKannan1
Solvent extraction, leaching, and gas absorption are separation processes used in food processing. Solvent extraction uses immiscible liquids to separate solutes. Liquid-liquid extraction uses mixing tanks or columns, while solid-liquid extraction uses static beds. Gas absorption uses agitated vessels or multistage columns like packed towers to transfer gases into liquids. Equipment is designed using equilibrium models and mass transfer principles to maximize separation efficiency.
Difference between batch,mixed flow & plug-flow reactorUsman Shah
This slide completely describes you about the stuff include in it and also everything about chemical engineering. Fluid Mechanics. Thermodynamics. Mass Transfer Chemical Engineering. Energy Engineering, Mass Transfer 2, Heat Transfer,
The document is a lab report from a chemical engineering class at Koya University. It details an experiment conducted by 8 students to determine the cloud point and pour point of an oil sample. The introduction discusses cloud point and pour point theory. The procedure describes how the cloud point and pour point were measured using a thermometer, test jar, and cooling bath. The results table lists the cloud point and pour point temperatures measured for two samples. Discussions by each student analyze how adding hydrotropes or salt would affect the oil solution and why thermometer readings are important.
The document contains lecture notes on mass and heat transfer in steady state processes. It discusses key concepts like Fick's law of diffusion, examples of mass transfer in membrane separation processes used in the food industry like reverse osmosis. It also covers the basic mechanisms of heat transfer through conduction, convection and radiation. Specific equations for heat transfer by conduction through a hollow cylinder are provided.
The document provides design details for an acetic acid process plant with a capacity of 400,000 tonnes per year. It evaluates various process technologies for producing acetic acid and selects the methanol carbonylation process. The design includes piping and instrumentation diagrams and specifications for the main unit operations - reactor, flash tank, drying distillation column, heavy ends distillation column, absorption column, and storage tank. It also covers process control and instrumentation, safety, environmental, and economic aspects of the plant design.
The document analyzes the economic viability of a proposed plant to produce 100 million kg of styrene per year from ethylbenzene. An optimal conversion of 65% ethylbenzene was determined using discounted cash flow analysis. An isothermal reactor at 600°C and 2 atm converts ethylbenzene and steam over an iron catalyst to produce styrene. Styrene is separated using a 3-column system. The discounted cash flow analysis determined a net present value of $28 million, an internal rate of return of 7.9%, and a total capital investment of $29.4 million. The profitability is contingent on the corporate tax rate, with a higher rate indicating more financial risk for the venture
This experiment aims to calibrate venturi and orifice flow meters by plotting the coefficient of discharge against Reynolds number for each and measuring the pressure drop across them at various flow rates. A known volume of water is passed through the meters and the flow rate is calculated. For both meters, the coefficient of discharge increases as the Reynolds number decreases, and the pressure drop increases non-linearly with flow rate, with a greater pressure drop observed for the orifice meter.
This experiment aimed to determine how concentration affects the weight and volume of cake obtained from a plate and frame filter press, as well as the length of time needed to obtain a certain volume of filtrate. The results showed that as concentration increased, the time required to collect a set volume of filtrate also increased. A linear relationship was observed between volume of filtrate and time per volume of filtrate, with an r-squared value of 0.95, indicating these variables increased proportionally. Sources of error included possible equipment defects and variability in cake weights.
In this presentation I have mentioned whatever the possible relevant content is required for this method
Citation Is done at the end of slide.
Content is up to date & true to my belief.
Thanks & Best Regards.
Anurag Pandey
B.Pharm (FACULTY OF PHARMACY, INVERTIS UNIVERSITY)
M.Pharm (INSTITUTE OF PHARMACY, NIRMA UNIVERSITY)
Email :- anurag.dmk05@gmail.com
This document discusses non-ideal flow and residence time distribution (RTD) analysis for non-ideal reactors. It begins by describing deviations from ideal reactor behavior, such as dead zones and bypassing, and how these affect residence times. It then covers RTD concepts like E(t), F(t), and normalized E(θ) curves. Measurement of RTD using tracers is described. Ideal reactor RTDs and models for non-ideal reactors like segregation and tanks-in-series are presented. The document stresses that RTD alone may not characterize non-ideal reactors and that flow models are also needed to analyze performance.
PRODUCTION OF METHYL TERTIARY BUTYL ETHER (MTBE)Aree Salah
this project submitted in partial fulfilment of the requirements for the degree of bachelor in science in Chemical engineering at Koya University.
The main purpose of our project is to describe and design the production of MTBE, and using it as an additive to gasoline in order to increase its quality.
We work at this plant to produce 112,200tons / year (112,200,000 kg/y) of methyl tertiary butyl ether (MTBE)
The document discusses size reduction, which is the process of reducing the size of solid materials through mechanisms like impact, attrition, compression, and cutting. Size reduction is important to increase surface area for applications like reactions. Common size reduction equipment includes crushers, grinders, and cutting machines. Crushers are used for coarse size reduction through impacts. Grinders provide intermediate and fine size reduction through impacts or abrasion. Factors that influence equipment choice include the feed and desired product sizes, material properties, and capacity needs. The efficiency of size reduction depends on factors like the energy required to generate new surface area.
This document discusses various types of reactors used for gas-solid catalytic reactions, with a focus on packed bed reactors. It summarizes:
1) The main types of reactors are adiabatic packed beds, wall cooled tubular reactors, fluidized beds, and risers.
2) Key design considerations for adiabatic packed beds include controlling the adiabatic temperature rise, pressure drop, and explosion potential.
3) Wall cooled tubular reactors require plug flow and careful control of wall cooling to prevent hot spots from forming.
4) Scale up of these reactors aims to maintain the same conditions as the laboratory scale, such as space time and flow distribution. Novel designs and operation methods aim
Cara 's ethanol laboratory testing requirementsCara Mullen
This document discusses testing services available at an ethanol plant laboratory. It outlines the typical tests conducted on incoming grain, mash, ethanol, distillers grains, and wastewater samples. These include tests for moisture, protein, starch, fat, minerals and other compositional parameters. Methods include NIR, Kjeldahl, HPLC, ASTM standards. The document also details the ethanol production process and quality tests required by ASTM for fuel-grade ethanol.
This document discusses a project on studying the steam economy of a multiple effect evaporator plant that produces sodium sulfate. It is a report submitted by 4 students to fulfill their Bachelor of Engineering degree requirements. The project aims to determine why steam utility increases over time in the plant's multiple effect evaporator for sodium sulfate production and find a suitable solution to reduce it. It will also involve simulating the multiple effect evaporator process using Excel. The document provides background on evaporators, multiple effect evaporators, sodium sulfate and its applications.
Solution Diffusion Model in Membrane TechnologySatish Movaliya
The solution-diffusion (SD) model is one of the earliest models proposed for reverse osmosis. The SD model is based on the principle of membrane diffusion through a dense layer. The model equations describe water and solute flux as functions of pressure, osmotic pressure, and permeability constants. Solute rejection is defined as the fraction of solute remaining in the feed stream and can be calculated from the concentration difference across the membrane and the feed concentration. Key parameters like permeability constants must be determined experimentally for different membrane types.
1) Conversion and reactor sizing for different reactor types such as batch, CSTR, PFR and reactors in series are discussed. Key equations for calculating conversion and sizing reactors given reaction rate data are presented.
2) Examples are provided to calculate the volume of a CSTR and PFR needed to achieve 80% conversion of a reactant based on rate data, and to compare the required volumes between reactor types.
3) For an isothermal reaction, a CSTR typically requires a larger volume than a PFR to achieve the same conversion due to operating at the lowest reaction rate throughout the reactor.
Armfield Gas Absorption Column ExperimentHadeer Khalid
The absorption of CO2 from air to water was studied in Gas absorption column built by Armfield company. Lab report and experiment was part of Separation Lab.
This document summarizes a design project for a fixed bed catalytic reactor. It includes an executive summary highlighting the economic and environmental benefits of the project. The design basis and constraints are outlined. Environmental considerations like mist formation and corrosion are addressed. The design was optimized using software tools, and equipment was sized. Capital costs were estimated for the reactor and other plant equipment based on mechanical designs and cost data. Appendices provide detailed calculations and specifications for the reactor design and equipment.
AgroNova : From Wet Organic Waste to Liquid Bio EnergyInnovation Norway
The AgroNova Process turns wet organic waste into biomass in 5-7 days using an in-vessel composting technology. It uses recycled newsprint and hydrogel as a bulking agent. The process produces energy-rich biomass that can be used for fertilizer, energy production, or gasification into liquid renewable fuels. AgroNova has invested €20M in research and development and plans to build a full-scale pilot plant in Norway in 2015 to further develop the technology and validate gasification of the biomass into green fuel.
A presentation to explain the challenges of municipal solid waste management in Gurgaon (India) - aimed at high school students. Promotes moving towards a circular economy and an integrated approach to waste management. Promotes adoption of MSW Rules and offers suggestions for action - at a citizens level.
Shree Renuka Sugars Ltd is a leading global agribusiness and bioenergy corporation. It is the 5th largest sugar producer in the world with sugar and ethanol production facilities in India and Brazil. The presentation provides details on the company's production capacities, financial performance, strategies in the Indian and Brazilian markets and goals to expand its integrated sugar and ethanol business globally.
Presentation of Celso Manzato for the "2nd Workshop on the Impact of New Technologies on the Sustainability of the Sugarcane/Bioethanol Production Cycle"
Apresentação de Celso Manzato realizada no "2nd Workshop on the Impact of New Technologies on the Sustainability of the Sugarcane/Bioethanol Production Cycle"
Date / Data : Novr 11th - 12th 2009/
11 e 12 de novembro de 2009
Place / Local: CTBE, Campinas, Brazil
Event Website / Website do evento: http://www.bioetanol.org.br/workshop5
This document discusses sugarcane ethanol production in India. It notes that sugarcane is a perennial crop that sequesters carbon dioxide and its entire biomass can be utilized. However, the sugarcane industry in India currently lacks innovative developments and policies to fully support ethanol production. The document outlines developments in sugarcane crops in other countries and calls for India to develop a comprehensive ethanol policy, infrastructure to support ethanol trade, and incentives for multi-fuel vehicles to increase ethanol blending and utilization.
This document provides an annual report for Flour Mills of Nigeria PLC for the financial year ending 31 March 2013. It includes the Chairman's statement which summarizes the company's financial performance and highlights major events of the year. The Chairman notes that despite challenges, the company achieved growth in revenue and profits. Two acquisitions and two mergers were completed to further the company's strategic objectives. The food business also saw growth with new investments and certifications for quality standards. The Chairman expresses confidence in the company's future prospects.
The document discusses the benefits of meditation for reducing stress and anxiety. Regular meditation practice can help calm the mind and body by lowering heart rate and blood pressure. Making meditation a part of a daily routine, even if just 10-15 minutes per day, can have mental and physical health benefits over time by helping people feel more relaxed and better able to handle life's stresses.
This document is Flour Mills of Nigeria PLC's 2014 annual report. It provides an overview of the company's operations and financial highlights for the year. Flour Mills is a leading food and agro-allied company in Nigeria with a diversified portfolio including flour milling, pasta/noodles, edible oil, sugar production, and other agricultural activities. In the past year, the company invested over $65 million to expand flour production capacity and commissioned a $250 million sugar refinery. The company is pursuing additional investments and acquisitions to strengthen its food business and agricultural supply chains.
This document provides an overview of bioethanol, including its production process, feedstocks, fuel properties, advantages, and disadvantages. Bioethanol is produced through sugar fermentation of plants containing sugars and starch, such as corn, sugarcane, or wheat. It is used as a substitute for gasoline in vehicles. While bioethanol production reduces greenhouse gas emissions and reliance on oil, it also requires large amounts of land and water and has lower energy content than gasoline. Brazil is highlighted as the largest producer and user of bioethanol due to its sugarcane crops and government policies supporting ethanol production.
The document is a project report submitted by Deepesh Awasthi to Sri Balaji Society regarding a study of the equity market at Edelweiss. It includes sections on introduction, research methodology, literature review, company profile, analysis of the equity market and Edelweiss, data analysis and interpretation, findings and recommendations, bibliography, and annexures. The project focuses on analyzing Edelweiss' role in the investment banking sector and equity market, comparing its financial performance to other firms.
A Hazard and Operability (HAZOP) study is a structured and systematic examination of a planned or existing process or operation in order to identify and evaluate problems that may represent risks to personnel or equipment, or prevent efficient operation.
This document discusses risk and return analysis for equity shares. It defines risk as the possibility of the actual outcome differing from the expected outcome, and return as the reward for undertaking an investment. It discusses calculating return using techniques like net asset value and calculating risk using statistical methods like standard deviation. Equity shareholders take on risk but can potentially earn profits. The relationship between higher risk and higher potential returns is also covered.
With rising crude prices and depleting quality of crude, however, the level of wastewater pollutants in petroleum wastewater is at new high. Such conditions are forcing refineries to use a more advanced water treatment, water recovery methods, and robust processes that work well under a variety of conditions and can handle the changing refinery effluent flow rates. Finally a process that is economical in overall life time cost is needed to make all of this feasible. Aquatech has experience working with these refinery effluent pollutants in the refinery market and offers the advanced petroleum wastewater treatment and recovery technology necessary for the refinery’s needs.
This document discusses conducting a Hazard and Operability (HAZOP) study. A HAZOP study is a systematic technique used to identify potential hazards and operating problems in a process. It involves examining process diagrams and considering how deviations from normal operating conditions could lead to hazardous situations. The document outlines the origins and development of HAZOP studies, their objectives, how and why they are used, and key aspects of conducting one such as focusing on specific nodes, parameters, and guide words to identify deviations, causes, consequences and actions.
This document summarizes Jagruti Godambe's project on equity research in the banking sector completed as part of a one month internship with Birla Sun Life Insurance in 2012-2013. The project analyzed the banking sector through fundamental and technical analysis and examined four Indian banks. Jagruti conducted the project under the guidance of Mr. Subojeet Sen Gupta and acknowledges his support. The project includes analysis of the banking sector, tools used, profiles of sample banks, and recommendations.
BE Chemical Engineering Design Project Production Of Propylene Oxidepatrickconneran
The document summarizes the design of a plant to produce 100,000 tonnes per year of 99.8% propylene oxide. It describes the selection of the cumene hydroperoxide process and provides details on the design of the key equipment, including oxidation, epoxidation, and distillation reactors and columns. It also discusses cost estimates, environmental impact assessments, hazard and operability studies, and the proposed site layout.
A HAZOP (Hazard and Operability) study is a systematic technique used to identify potential hazards and operability problems in processes. It involves a team reviewing a process and its design to identify possible deviations from safe operation. The document outlines the HAZOP process including preparation, terminology, meeting procedures, follow up actions and documentation. Key aspects include selecting a team with relevant expertise, gathering process information, using guide words to identify deviations, assessing risks, recommending safeguards, and documenting actions.
Project on equity analysis on banking sectorHIMANI PADIA
This document outlines an equity analysis project on the banking sector submitted by Himani P. Padia to partially fulfill requirements for a PGDM program. The project was conducted under the guidance of faculty member Prof. Jagadish Reddy and the Director of Academics Prof. Mir Irfan Ul Haque. The analysis focuses on evaluating current growth trends in banking sector stocks in the equity market based on a study of the Indian economy.
This document discusses Hazard and Operability Studies (HAZOP). It provides an overview of the HAZOP methodology, including that it involves a team systematically using guidewords to identify deviations from the design intent and their potential causes and consequences. The document also gives examples of applying the HAZOP technique to analyze specific components, like conducting a HAZOP study on a shell and tube heat exchanger using relevant guidewords. Overall, the HAZOP method aims to identify hazards as well as operability problems for improved safety and operations.
This document presents a process design for producing ethanol from sugarcane at a plant in Louisiana. It includes mass and energy balances for the four main processes: milling, juice clarification, fermentation, and distillation. The total equipment cost is $21 million and the projected revenue is $145 million per year. A cash flow analysis over 20 years using a 7% discount rate yields a positive net present value of $60 million.
This document is a GET panel report presented by Mhd. Yamen Bambouk that discusses instrumentation and preventive maintenance at Al Khaleej Sugar Refinery. It begins with an acknowledgment and table of contents, then provides an overview of the sugar refining process and key unit operations. It discusses instrumentation measurement and control, and outlines the objectives of preventive maintenance programs, including setting them up effectively and managing associated risks.
This document discusses options for distilling dilute ethanol to produce 99.5% ethanol. It analyzes pressure swing distillation versus azeotropic distillation, with benzene as a common entrainer. Preliminary simulations show pressure swing distillation yields the desired product composition with less ethanol loss. A three-column system is also considered but deemed too costly. The document outlines objectives of determining the optimal distillation method, finalizing a process flow diagram, performing safety and economic analyses, and achieving a 5% annual ROI.
This document summarizes the production of sugar from sugar cane. It discusses the sources of sugar, the manufacturing process which includes harvesting, transportation, cutting, extraction of juice, filtration, evaporation, crystallization, centrifugation, drying and packing. It also discusses the byproducts of sugar production including bagasse, blackstrap molasses and filter cake. Finally, it provides information on major sugar producing areas in India and around the world.
Preliminary Study for Exergetic Analysis on Sugar Production in Tanzania the ...Patrick VanSchijndel
Tanzania is striving to reach the levels of economic well being which the developed countries have achieved. However, the industrial development as was undertaken by the first world countries would be catastrophic for the environment. Therefore this study focussed on how to combine economic growth with sustainable development.
Due to the bad condition in which some of the equipment at TPC was, it proved not to be possible to map all the energetic difficulties at the factory. Though, it was possible to address the main bottlenecks of the process and suggestions for improvement were done. However, improving the course of the process is not sufficient to improve the sustainability of the factory. Non-technical aspects, like behaviour of operators and management can also do one's bit for a more reliable, time and cost efficient and less polluting factory. Of course this will inevitably ask for investments.
Despite the fact that some well-intentioned criticism is uttered in this report, TPC seems to have the power to survive, as it did for the past 65 years. If TPC’s new owner deals with the factory’s bottlenecks and takes the issues dealt with in this report to hart, the future of TPC looks promising.
This document provides an overview and details of the raw water pretreatment system for a 6 x 600 MW subcritical coal-fired power plant project in Chhattisgarh, India. The raw water pretreatment system uses coagulation, clarification, and filtration processes to remove suspended solids and colloids from raw water sourced from the Mahanadi river system. Key equipment includes coagulant dosing, mechanically accelerated clarification tanks, and filters. The document also outlines design raw water quality parameters and treatment system capacity.
Punjab Beverages Company is a leading franchise of PepsiCo International established in 1974 in Faisalabad, Pakistan. The internship report summarizes the author's training at Punjab Beverages, including descriptions of departments like Quality Control that ensure product quality. Key learnings included food safety standards, water treatment processes, syrup production, packaging procedures, and quality parameters. A SWOT analysis found strengths in experienced staff but weaknesses in poor hygiene and wastage increasing costs.
The document provides details on the process of producing ethanol from corn using the dry milling method. It includes a block flow diagram outlining the key steps: preprocessing, liquefaction/saccharification, fermentation, and purification. A process flow diagram shows the flow of materials between major equipment like reactors, distillation columns, and storage tanks. Mass and energy balances are also presented, calculating theoretical yields at each stage based on inputs of 1,000,000 metric tons of corn feedstock per year. Key reactions and conversions are defined, with calculations of water, glucose, ethanol, carbon dioxide, alpha amylase, and yeast flows.
This document is a winter internship report submitted by Aamir Ali Seelro for their internship at Naudero Sugar Mills (Pvt) Limited. It provides an overview of the sugar production process at Naudero Sugar Mills, including weighing cane, cutting, fiberizing, milling, juice extraction, clarification, evaporation, crystallization, separation, refining, drying, and finishing/packing. It describes each major step in the production process and the equipment used. The report also includes background information on Naudero Sugar Mills and thanks those who supported the internship.
Tertiary treatment of wastewater in Food Processing IndustriesAbdul Rehman
The document discusses various tertiary wastewater treatment techniques for removing nitrogen, phosphorus, and sulfur from wastewater, including biological, chemical, and physical-chemical methods. It focuses on the microbial removal of nitrogen through nitrification and denitrification processes, precipitation of phosphorus using calcium or aluminum salts, and control of sulfur species through pH adjustment, oxidation, or stripping. The document also examines membrane-based separation techniques like reverse osmosis and electrodialysis as well as ion exchange for advanced wastewater treatment.
This document provides an overview of pollution prevention opportunities in the dairy industry across Mediterranean countries. It describes the status of the dairy sector, main production processes and their environmental effects, and opportunities to reduce pollution. The objectives are to characterize the dairy industry in MAP regions, key processes, secondary operations, products, environmental impacts, and recommend pollution prevention approaches. Case studies from MAP countries are presented to illustrate best practices for reducing water usage, wastewater, energy use, and emissions in dairy production.
This document outlines the design of a carbon neutral farm in Ontario. The farm will consist of two plots, one in Chatham-Kent for growing canola and food crops, and one in eastern Ontario for growing switchgrass. The canola will be processed into biodiesel to power farm equipment, while the switchgrass will be converted to ethanol for fuel use. Various constraints on location, social factors, technical requirements, and raw material availability are considered. Crop yields are highest in southern Ontario, so Chatham-Kent is selected for optimal production of canola, wheat, soybeans, and corn. Eastern Ontario is chosen for switchgrass due to suitable soil conditions.
Rice value chain report in Kampot and Takeo provincesSoksophors yim
This document summarizes the findings of a study on the paddy value chain in Kompot and Takeo provinces of Cambodia. It provides details on production costs, yields, credit services, food security, supply and demand trends, price trends, and a SWOT analysis of different actors in the value chain. Some key findings include:
- Rice production is a major livelihood for rural households in the study areas, with over 97% of families engaged in rice farming.
- Production costs for wet season paddy averaged around $450/ha compared to $550/ha for dry season. Yields were higher for wet season at over 3 tons/ha.
- The majority of paddy is sold to local collectors
Olive pomace, the byproduct of olive oil extraction, still contains residual oil that can be extracted through solvent extraction or a second centrifugation process. This pomace oil extraction involves drying the pomace to around 8% moisture then using hexane solvent or centrifugal machines to separate 40-60% of the remaining oil. The extracted pomace oil is known as crude pomace oil and is classified for commercial use based on its properties.
Cpgp day02 7- comprehensive case study-pineaple 25.6.10 -samanthazubeditufail
The pineapple juice factory processes 10,000 pineapples per day into bottled juice for the local and export markets. To meet export demands, the factory needs ISO and HACCP certifications as well as an environmental audit. The production process involves peeling, cutting, blending pineapples with coconut water, filtering, cooking with sugar, and manual bottling. Wastewater discharged to a nearby canal and solid waste disposal have caused environmental issues. A material balance and analysis of resource losses and their costs are required to improve sustainability.
The sugar manufacturing process involves several steps: 1) Growing and harvesting sugarcane, 2) Preparing the cane for milling by cutting or crushing it to extract juice, 3) Milling the cane using roller mills to extract more juice, 4) Clarifying the extracted juice by removing impurities using chemicals like lime, 5) Evaporating the clarified juice in multiple effects to increase concentration, 6) Crystallizing sugar in evaporator-crystallizers then centrifuging to separate raw sugar from molasses.
This document provides an overview of the process at Gobind Sugar Mills Ltd in India. It discusses the various stages of sugar cane cultivation including sowing, harvesting, transporting cane to the plant, inspection, and payment to farmers. It then describes the sugar production process which involves crushing cane to extract juice, boiling the juice to produce raw sugar, and refining the raw sugar. It also discusses the co-generation power plant which uses bagasse from the mill to produce steam and electricity. Various departments involved in human resources, accounting, stores are also outlined.
This document provides an overview of the manufacturing process at Rajshree Sugars and Chemicals Ltd plant. The plant has a capacity of 2500 tons of cane crushed per day and produces sugar, power, ethanol, and biocomposition. It utilizes a double sulphitation sugar production process across various houses including milling, boiling, and drying. Byproducts like bagasse and molasses are used to generate power and produce ethanol. The plant's process design is both product and process focused to efficiently produce sugar and maintain equipment. Key factors like nature of demand, vertical integration, flexibility, automation, and quality influence the plant's overall process design.
This document provides an overview of the organic farming practices used at the ADAS Pwllpeiran organic research farm in Wales. It describes the farm's land types and organic enclosures, grassland management practices according to ESA prescriptions, and the performance of the organic suckler herd and sheep flock. It also discusses beef and sheep feeding regimes and the financial performance of organic upland farms based on long-term studies.
Similar to CHEG 407-Case 2-Ethanol from Sugarcane Mills Process (20)
CHEG 407-Case 2-Ethanol from Sugarcane Mills Process
1. Ethanol from Sugarcane Mills Process
An Le Thuy Tran
ID#: xxxxx7066
Chemical Engineering
CHEG 407-A
Spring 2016
Apr. 14, 2016
Submitted to Dr. Jacob R. Borden
2. 1
Table ofContents
Executive Summary..........................................................................................................................3
Flowsheet and Process Description...................................................................................................3
Cane Milling...................................................................................................................................4
Juice Clarification ...........................................................................................................................4
Fermentation...................................................................................................................................5
Ethanol Distillation .........................................................................................................................6
Mass and Energy Balances................................................................................................................7
Major Equipment List......................................................................................................................9
Economic Analysis............................................................................................................................9
ISBL/OSBL.................................................................................................................................. 10
CAPEX........................................................................................................................................ 10
OPEX........................................................................................................................................... 10
NPV/IRR...................................................................................................................................... 11
Safety Analysis................................................................................................................................12
Toxicity/ Flammability/ Auto-ignition ............................................................................................ 12
HAZOP........................................................................................................................................ 13
Boston Square............................................................................................................................... 14
Conclusions and Recommendations................................................................................................14
3. 2
Figures
Figure 1: Overall Ethanol from Sugarcane Mills Process Overview........................................................3
Figure 2: Cane Milling Overview.........................................................................................................4
Figure 3: Juice Clarification Overview .................................................................................................5
Figure 4: Conversion of Sucrose and Inverts to Ethanol.........................................................................5
Figure 5: Fermentation Overview ........................................................................................................6
Figure 6: Ethanol Distillation Overview ...............................................................................................7
Figure 7: Major Equipment List...........................................................................................................9
Figure 8: LD50 Absorbed Orally in Rats, mg/kg ..................................................................................13
Figure 9: HAZOP on Multiple Effect Evaporators ..............................................................................13
Figure 10: FMEA Rating Scale..........................................................................................................14
Figure 11: Boston Square for Multiple Effect Evaporators HAZOP......................................................14
Tables
Table 1: Design Basis for Cane Milling Section....................................................................................4
Table 2: Design Basis for Juice Clarification Section ............................................................................5
Table 3: Design Basis for Fermentation Section....................................................................................6
Table 4: Design Basis for Distillation Section.......................................................................................7
Table 5: Mass Balance for Milling Section ...........................................................................................8
Table 6: Mass Balance for Clarifying Section.......................................................................................8
Table 7: Mass Balance for Fermentation Section...................................................................................8
Table 8: Mass Balance for Distillation Section......................................................................................9
Table 9: Overall Economic Results ....................................................................................................10
Table 10: Total Fixed Capital Cost.....................................................................................................11
Table 11: Variables Cost of Production ..............................................................................................11
Table 12: Annual Labor, Maintenance, and Depreciation Cost.............................................................11
Table 13: Variables Cost per Gallon and per Year of Ethanol Production .............................................11
Table 14: Cash Flow and NPV Analysis.............................................................................................12
Table 15: Safety Parameters for Materials Involved in the Ethanol from Sugarcane Mills Process..........13
4. 3
Executive Summary
Ethanol from Sugarcane Mills project is designed for St. Mary Sugar Co-Op, Inc. located in
Jeanerette,LA. In this project, we have evaluated a sugarcane mill that processes 20,000 metric tons per
day (44.1 million lb/day) of cane. With the plant operating at an on-stream factor of 0.50, the annual
output is 420 million pounds (192,000 metric tons or 242 million liters) of ethanol or 64 million gallons.
The on-stream factor is a reflection of our assumption that the mills, fermentation and recovery are
operated during a milling season of 150 days/yr. This plant is estimated to have a ± 100% CAPEX of $
670,000,000 and a ± 50% major equipment cost of $ 120,000,000 (included a Lang factor of 4). Also,
total variables cost per gallon ethanol production is estimated as $ 2.02. A brief safety analysis, HAZOP,
and Boston Square were performed in order to identify and evaluate problems that may present risks to
personnel or equipment, or prevent efficient operation. The MS Excel file, with the shortcut as shown
below, shows all calculations, figures, and tables with detailed examination.
CHEG 407-Case
2-Ethanol from Sugarcane Mills Process.xlsx
Flowsheet and Process Description
The sugarcane plant is operated 5 months (150 days) a year,and processes 20,000 US ton of raw
sugarcane per day. The ethanol production from sugarcane consists of four process sections: cane milling,
juice clarification, fermentation, and ethanol distillation. The main raw materials involving in this
production are sugarcane and water, besides with other reagents at small quantities. The overall ethanol
from sugarcane mills process overview is provided in Figure 1 below.
Figure 1: Overall Ethanol fromSugarcane Mills ProcessOverview
5. 4
1. Cane Milling
The sugarcane from field typically contains 15 wt% sucrose,15 wt% fiber, and 70 wt% water and
dirt. Firstly, the cane is unloaded for cleaning, and placed in a large pile. Then, breaking cane is done by
revolving knives and shredder; grinding cane is done by 4 sets of 4-roller mills. Next, conveyors transfer
the cane through knife mill and hammer mill toward roller mills. In order to enhance the extraction of the
juice, imbibition water is added at the roller mills. Lately, bagasse which is removed from the last roller
mill can be recycle to use as fuel. The design basis for Cane Milling section is provided in Table 1 below.
Table 1: Design Basis for Cane Milling Section
Figure 2: Cane Milling Overview
2. Juice Clarification
In the juice clarification section, the raw material is first heated at about 95o
C. Next, calcium
oxide (lime) is added in order to produce organic acids precipitate. The remaining of lime and dirt then
are added to clarifier in order to separate clear juice and heavy precipitate (mud). The mud will undergoes
the vacuum filtering process while the clear juice will go through evaporator which has five heat
exchangers in series in order to produce concentrated juice, using evaporated water. The last heat
exchanger is operated at 2.5 psia and 57o
C. A design basis for juice clarification section can be seen in the
Table 2 below.
Component Value Unit
Raw cane 20000 US ton/day
Sugar in cane 15 %
Extraction yield of sugar 96 %
Bagasse 0.275 lb/lb cane
40 % solid
60 % moisture
Imbibition water 0.307 lb/lb cane
Bagasse composition
Water
6140 US ton/day
Knife mill Hammer mill
20000 US ton/day 4-Roller mills
15 wt% sucrose 6-10" billets 0.5-1" chunks split fiber
15 wt% fiber
70 wt% water, dirt
Raw juice Bagasse
20640 US ton/day 5500 US ton/day
13.95 wt% sucrose 40 wt% solid
60 wt% water
Sugarcane
from field
Wt scale,
transport
6. 5
Table 2: Design Basis for Juice Clarification Section
Figure 3: Juice Clarification Overview
3. Fermentation
Ethanol is produced as a result of fermentation in a series of fed-batch fermenters. Yeast cream
and molasses are fed to the top of the first fermenter. Each stage gives broth at the bottom following to
the middle of the next stage. The fermenters have a conical bottom inclined at 60˚ and an aspect ratio
(height/diameter) of 1.2 in the cylindrical part. Broth is circulated through external coolers to maintain the
fermenter operating temperature between 33 and 35o
C (91 to 95o
F). Liquid kinetic energy at the heat
exchanger outlet is used to agitate liquid in the fermenter. Foam and gasses from the fermenter conduct to
the next fermenter,then washed in a perforated plate column. Carbon dioxide is also produced with the
ethanol and contain some of the vent gasses.
Disk-bowl centrifuges separate biomass from the wine to form a yeast cream containing 70-80%
of cellular mass. Acid treatment vessels received the yeast cream,where water is added to up to 35-40%
of the volume, and concentrated sulfuric acid is added to get the pH of about 2.2. The amount of effective
concentration of ethanol in the wine accounts for about 10 vol%. Figure 4 below shows the conversion of
sucrose and inverts to ethanol.
Type of reaction Stoichiometry
Inversion of Sucrose by Hydrolysis C12H22O11 + H2O → 2C6H12O6
Conversion of Invert Sugars by Yeast 2C6H12O6 → 4C2H5OH + 4CO2
Figure 4: Conversion of Sucrose and Invertsto Ethanol
Component Value Unit
Lime added 0.003 lb/lb cane
Sucrose lost in filtercake 0.7 %
Filtercake 0.0196 lb/lb cane
30 % solid
70 % moisture
Sugar in clear juice 12 %
Filtercake composition
Lime
60 US ton/day Recycle juice
Juice heater
Raw juice
20640 US ton/day
13.95 wt% sucrose
Concentrated juice Clear juice
9533 US ton/day 23832 US ton/day
30 wt% sucrose 12 wt% sucrose
Evaporated water Wash water
14299 US ton/day 3524 US ton/day
Filter cake
392 US ton/day
30 wt% solid
70 wt% water
Mud
centrifuge
Surge
tank
Mixing
vessel
Surge
tank
Clarifier
Surge
tank
Evaporator
7. 6
Table 3: Design Basis for Fermentation Section
Figure 5: Fermentation Overview
4. Ethanol Distillation
Fermented wine (15wt% ethanol) which comes from centrifuges will first go through heater,then
stripping and rectifying columns. In the stripping column, carbon dioxide gas is removed as an overhead
product, while liquid water is removed at the bottom. Then, rectifying column will received the side
stream from stripping column in order to produce hydrous ethanol with 50% in volume. Both columns are
operated at 30 psia and consist of valve trays, overhead condensers, and bottom reboilers. A design basis
for distillation section can be seen in the table 4 below.
Component Value Unit
Fermentation time 8 hours
Waer added 0.13 lb/lb concentrated juice
Fermentation reaction yield 92 %
Bottom stream yield 99 % total ethanol
Total yield of ethanol 91 %
Diluted ethanol concentration 15 %
Reactor temperature 35 degree C
CO2 Water
Concentrated juice Gas
9533 US ton/day 1429 US ton/day Water
30 wt% sucrose
Water 10-Heat exchangers
1239 US ton/day
Yeast cream 9343 US ton/day
15 wt% ethanol
Sulfuric acid
10-Fermentors
Gas
washing
column
Acid treatment unit Centrifuges
8. 7
Table 4: Design Basis for Distillation Section
Figure 6: Ethanol Distillation Overview
Mass and Energy Balances
For the annual output is 420 million pounds (192,000 metric tons or 242 million liters) of ethanol,
the mass flowrate of each component in each section has been calculated and can be seen in Tables 5-8
below.
Component Value Unit
Distillation yield 99 %
CO2 removed 100 %
50 vol%
43 wt%
Ethanol product density 0.93 kg/L
Product stream 3,226 US ton/day
Product capacity 483,966 US ton/year
Overall capacity 124,729,357 gal ethanol/year
0.16 lb product/lb cane
157.37 L product/US ton cane
Ethanol product
concentration
Ratio product
Gas to washing column Ethanol
25 US ton/day 50 vol%
3226 US ton/day
Condenser Condenser
Wine heater
Fermented wine Reboiler
9342 US ton/day
15 wt% ethanol
Reboiler To waste treatment
6091 US ton/day
Stripping
column
Rectification
column
9. 8
Table 5: Mass Balance for Milling Section
Table 6: Mass Balance for Clarifying Section
Table 7: Mass Balance for Fermentation Section
Section Flowrate (US ton/day)
Sucrose 3,000
Fiber 3,000
Water & dirt 14,000
6,140
Sucrose 2,880
Water & dirt 17,760
Solid 2,200
Water 3,300
Component
Sugarcane
feed
Milling
Imbibition water
Raw juice
Bagasse
Section Flowrate (US ton/day)
Sucrose 2,880
Water & dirt 17,760
3,524
60
Sucrose 2,860
Water 20,972
Solid 118
Water 274
Sucrose 2,860
Water 20,972
Sucrose 2,860
Water 6,673
14,299
Clear juice
Lime
Wash water
Raw juice
Component
Decanter
Evaporator Concentrated
juice
Evaporated water
Clear juice
Filter cake
Section Stream Component Flowrate (US ton/day)
Sugar 2,859.84
Water 6,672.96
Added water (from acid treatment) 1,239.26
Ethanol 1,415.54
Water 7,773.75
Unreacted sugar 228.79
CO2 1,353.99
Water 73.02
Ethanol 14.16
CO2 1,342.35
Ethanol 1,401.38
Water 7,700.73
Unreacted sugar 228.79
CO2 11.65
Fermentation
Inlet
Outlet
Top
stream
Bottom
stream
10. 9
Table 8: Mass Balance for Distillation Section
Major Equipment List
No. Equipment Functions
1 Knife mill 1st
step of breaking the hard structure of the cane
2 Hammer mill 2nd
step of breaking the hard structure of the cane
3 Roller mill Grind or mill the crushed cane
4 Settling tank Strain the juice from the mills to remove large particles
5 Vacuum filter Filter the insoluble particulate mass, called “mud”
6 Clarifying column Separate a heavy precipitate from the juice
7 Mix vessel Neutralize the organic acid
8 Juice heater Raise the temperature of the juice to about 200 degree F
9 Mud centrifugal Separate mud from the limed juice
10 Multiple effect evaporators Concentrate the juice in an evaporator station
11 Stripping column
Remove residual carbon dioxide and as little ethanol as possible
overhead
12 Rectifying distillation Tolerate solids well and have a relatively good efficiency
13 Fermenters Produce ethanol
14 External coolers
Maintain each fermenter at operating temperatures by circulating
broth through external coolers
15 Perforated plate column Wash gases and foam released from the fermenter process
16 Disk-bowl centrifuge Separate biomass from the wine to form a yeast cream
17 Acid treatment vessel
Dilute the yeast cream with water and mix with concentrated
sulfuric acid
18 Sulfuric acid tank Contain sulfuric acid
19 Condenser Condense carbon dioxide, ethanol, and water
20 Ethanol storage tank Store pure ethanol
Figure 7: Major Equipment List
Economic Analysis
A major equipment cost is calculated as a total of $ 30,000,000 ± 50% within the accuracy of the
method. The details of estimated cost of each piece of equipment can be seen in Table 9 below. The total
equipment cost was then brought from 2006 US dollars to 2016 US dollars by using cost index found in
Section Stream Component Flowrate (US ton/day)
Ethanol 1,401.38
Water 7,700.73
CO2 11.65
Sugar 228.79
CO2 overhead 11.65
Ethanol overhead 14.01
Water at bottom 5,861.66
Sugar at bottom 228.79
Water in product 1,839.07
Ethanol in product 1,387.37
Distillation
Inlet
Outlet
11. 10
figure 7.3 from Chemical Engineering Design Book (page 337) before being multiplied by a Lang factor
of 4 to get a CAPEXcost of $ 120,000,000 ± 50% within the accuracy of the method.
Year Cost index
2006 1.6 fig. 7.3
2016 1.45 fig. 7.3
Table 9: Overall Economic Results
Compare to the original ± 100% ISBL cost ($ 670,000,000), the calculated CAPEXcost is much
lower ($ 120,000,000). The reason is many pieces of equipment not being accounted for. These
equipment are continuous vacuum pans, batch seed pans, crystallizers, continuous centrifuges, etc. The
difference also might come from the number of reactors used in practice,which will raise the CAPEX
cost significantly.
This project is designed for St. Mary Sugar Coop plant in Jeanerette,Louisiana. The cost analysis
can be done by using ISBL and OSBL method. Based on the total purchased equipment cost, the total
fixed capital cost is estimated as $ 216.9 MM for an investment of 20-year life for a project.
No Equipment Symbol Material Op. parameterOp. value Op. unita b n Material factor Cost $
1 Knife mill S-101 Carbon steel Mass flow 765 t/h 68400 730 1 1 626,850.00$
2 Hammer mill S-102 Carbon steel Mass flow 765 t/h 68400 730 1 1 626,850.00$
3 Roller mills (x4) S-104A-D Carbon steel Mass flow 18000 t/day 250000 500 0.9 1 3,628,432.60$
4 Settling tank S-105 Carbon steel Volume 568 m3 5800 1600 0.7 1 141,370.07$
5 Vacuum filter (x2) S-107A&B Carbon steel Area 3026 m2 -73000 93000 0.3 1 956,778.04$
6 Clarifying column V-102 304SS Volume 492.10 m3 5800 1600 0.7 1.3 166,945.29$
7 Mix vessel V-101 304SS Volume 359.61 m3 5800 1600 0.7 1.3 135,522.00$
8 Mud centrifugal S-106 316SS Diameter 1.30 m 57000 480000 0.7 1.3 822,040.96$
9 Fermenters (x10) R-301-310 304SS Volume 1135.623 m3 623750 5000 1 1 6,301,865.00$
10 Disk-bowl centrifuge S-301A&B 316SS Diameter 0.91 m 57000 480000 0.7 1.3 660,211.09$
11 Acid treatment vessel V-301A-D 316SS Volume 26.50 m3 5800 1600 0.7 1.3 112,644.24$
12 Sulfuric acid tank T-351 Carbon steel Volume 18.93 m3 113000 3250 0.65 1 134,977.95$
13 Ethanol storage tank T-451A&B Carbon steel Volume 3217.5985 m3 5800 1600 0.7 1 462,249.02$
Carbon steel Area 58.06 m2 1600 210 0.95 1 11,552.53$
316SS Duty 8206 kW -14000 1900 0.75 1.3 2,111,387.98$
316SS
Area 743.22
m2
330 36000 0.55 1.3 1,776,096.73$
316SS Duty 18.65 kW 17000 1130 1.05 1.3 53,812.80$
Carbon steel Area 111.48 m2 29000 400 0.9 1 56,832.35$
304SS Duty 21.2 kW 580000 20000 0.6 1.3 916,470.63$
Carbon steel
Area 65.03
m2
30400 122 1.1 1 42,444.82$
304SS Duty 366.34 kW 260000 2700 0.75 1.3 631,914.07$
14 Juice heater E-101
15
Multiple effect
evaporators
E-102A-E
16 External coolers (x10) E-301-304
17 Condensers E-402
No Equipment Symbol Trays/Packing #of trays Height of packing (m) a b n a b n
18 Stripping column C-401 valve trays 34 N/A 210 400 1.9 160,022.85$ 17400 79 0.85 2,197,673.55$
19 Rectifying distillation C-402 valve trays 60 N/A 210 400 1.9 163,477.76$ 17400 79 0.85 2,685,939.58$
20 Perforated plate column C-301 304SS Raschig rings N/A 3.048 0 8000 1 284,671.99$ 17400 79 0.85 1,130,005.67$
Trays/packing parameter Column parameterCost of
tray/packing
Cost of column
26,999,039.58$
Total 2016 Cost of Major Equipment ± 50% 29,792,043.68$ eq. 7.14
4
119,168,174.70$ eq. 7.10
Lang factor
CAPEX ISBL ± 50%
Total 2006 Cost of Major Equipment ± 50%
12. 11
Table 10: Total Fixed Capital Cost
Table 11: Variables Cost of Production
Assume that this sugarcane plant has 25 operators, 6 engineers, and 1 plant manager, in which the
salaries are estimated as $25/hr for operators, $30/hr for engineer, and $35/hr for plant manager. Thus, for
one season,the labor cost of this plant is calculated as around $6,000,000. Maintenance cost and
depreciation cost are estimated as 5% ISBL and 5% total fixed cost, respectively. Total annual cost equals
the sum of labor cost, maintenance cost, and depreciation cost.
Table 12: Annual Labor, Maintenance, and Depreciation Cost
Table 13: VariablesCost per Gallon and per Year of Ethanol Production
Assume the plant is built at time zero, begins operation at full rate in year 1. The rate of corporate
income tax is 35%, and paid tax based on the previous year’s income. The IRR is found as 13.11% by
using Goal seek in Excel. The NPV of this sugarcane plant after 20 years then is calculated as
$106,932,545.09, which is approximately as $107 MM. The payback period is 8 years,and the profit is
earned at the 9th
year. A detail can be seen in Table 14 below.
Major equipment cost 119,168,174.70$
Offsites factor (OS) 0.3
Design and Engineering (D&E) 0.3
Contigency (X) 0.1
Total fixed capital cost 216,886,077.96$
Component Value Unit Cost per unit Cost per day Cost per year
Cooling water 37,857,600 gal/day 0.005$ 189,288.00$ 28,393,200.00$
Electricity 523,872 kWh/day 0.060$ 31,432.32$ 4,714,848.00$
Raw sugarcane 20,000 US ton/day 30.00$ 600,000.00$ 90,000,000.00$
Calcium oxide 60 US ton/day 60.00$ 3,600.00$ 540,000.00$
By product Electricity (from bagasse) 22,723 kWh/day (0.087)$ (47,445.62)$ (7,116,843.60)$
116,531,204.40$
Utilities
Raw material
Consumption/Production
Labor cost 6,000,000.00$
Maintenance 6,235,986.00$ 5% ISBL
Depreciation 10,844,303.90$ 5% total fixed cost
Total annual cost 23,080,289.90$
Cooling water 0.45$
Electricity 0.07$
Raw sugarcane 1.41$
Calcium oxide 0.01$
By product Electricity (from bagasse) (0.11)$
0.09$
0.10$
2.02$ per gal
128,709,825.40$ per year
Maintenance
Utilities
Raw material
Total
Labor
13. 12
Table 14: Cash Flow and NPV Analysis
Safety Analysis
Many hazardous chemicals involved in the Ethanol from Sugarcane Mills process are listed in the
Table 6 below. Carbon dioxide is classified as harmful; sucrose, water,ethanol calcium oxide, fructose,
and glucose are considered as non-harmful based on LD50 rate. The LD50 rate expresses the amount of the
specified chemical that it would take to kill 50% of an animal population. A chemical substances may be
very dangerous at high temperature or pressure, though it is not at lower degree of temperature and
pressure. The PEL (Permissible Exposure Limit) establishes the ppm limit that should not come into
contact with a person. Appropriate medical care and paperwork should be fulfilled if a person comes into
contact with a chemical beyond its PEL. The Flammability Range in air (vol% in air) suggests that if the
volume percent of the specified material falls between these ranges, an explosion will mostly occur,
especially if there is an ignition source. In order to not falling in the flammability range, the unit needs to
be operated a very safe distance from this range. In our plant, since other chemical’s flammability ranges
do not applicable except ethanol’s, our unit process needs to be run at a very ethanol rich at 32 volume
percent in air or higher; or at a very EDC poor at 1 volume percent in air or lower. In case the
flammability ranges of other chemicals are indicated, our unit needs to be operated at the point more than
the highest volume percent in air of all the upper limits or at the point less than the lowest volume percent
in air of all the lower limits. Auto ignition temperature is shown in the last column, at which the specified
material may spontaneously ignite. Therefore,a unit should have a material operating far from its auto
ignition temperature. In order to do that, extra insulation may be added around process equipment.
Compound
Toxicity data
Toxicity level
Flammability range Auto ignition
temperature
(oC)
PEL
(ppm)
LD50 (mg/kg)
Lower
limit
Upper
limit
Sucrose 27 29,700 Oral, rat Not harmful N/A N/A N/A
CO2 5000
1200 Rat
Harmful N/A N/A N/A
1029 Mouse
Year Revenue ($) Cost ($) Gross profit (S)
Depriciation
charge ($)
Taxable income ($) Tax ($)
After tax income
($)
NPV ($) Total NPV to year ($)
1 -$ -$ -$ -$ -$ -$ (216,886,077.96)$ (216,886,077.96)$ (216,886,077.96)$
2 128,709,825.40$ 52,814,968.57$ 75,894,856.83$ (10,844,303.90)$ 65,050,552.93$ 22,767,693.53$ 53,127,163.30$ 41,526,408.14$ (175,359,669.82)$
3 128,709,825.40$ 52,814,968.57$ 75,894,856.83$ (10,844,303.90)$ 65,050,552.93$ 22,767,693.53$ 53,127,163.30$ 36,713,707.06$ (138,645,962.76)$
4 128,709,825.40$ 52,814,968.57$ 75,894,856.83$ (10,844,303.90)$ 65,050,552.93$ 22,767,693.53$ 53,127,163.30$ 32,458,773.73$ (106,187,189.03)$
5 128,709,825.40$ 52,814,968.57$ 75,894,856.83$ (10,844,303.90)$ 65,050,552.93$ 22,767,693.53$ 53,127,163.30$ 28,696,965.71$ (77,490,223.32)$
6 128,709,825.40$ 52,814,968.57$ 75,894,856.83$ (10,844,303.90)$ 65,050,552.93$ 22,767,693.53$ 53,127,163.30$ 25,371,132.24$ (52,119,091.08)$
7 128,709,825.40$ 52,814,968.57$ 75,894,856.83$ (10,844,303.90)$ 65,050,552.93$ 22,767,693.53$ 53,127,163.30$ 22,430,746.09$ (29,688,344.99)$
8 128,709,825.40$ 52,814,968.57$ 75,894,856.83$ (10,844,303.90)$ 65,050,552.93$ 22,767,693.53$ 53,127,163.30$ 19,831,135.84$ (9,857,209.15)$
9 128,709,825.40$ 52,814,968.57$ 75,894,856.83$ (10,844,303.90)$ 65,050,552.93$ 22,767,693.53$ 53,127,163.30$ 17,532,807.30$ 7,675,598.15$
10 128,709,825.40$ 52,814,968.57$ 75,894,856.83$ (10,844,303.90)$ 65,050,552.93$ 22,767,693.53$ 53,127,163.30$ 15,500,843.44$ 23,176,441.59$
11 128,709,825.40$ 52,814,968.57$ 75,894,856.83$ (10,844,303.90)$ 65,050,552.93$ 22,767,693.53$ 53,127,163.30$ 13,704,373.93$ 36,880,815.53$
12 128,709,825.40$ 52,814,968.57$ 75,894,856.83$ (10,844,303.90)$ 65,050,552.93$ 22,767,693.53$ 53,127,163.30$ 12,116,106.17$ 48,996,921.70$
13 128,709,825.40$ 52,814,968.57$ 75,894,856.83$ (10,844,303.90)$ 65,050,552.93$ 22,767,693.53$ 53,127,163.30$ 10,711,910.63$ 59,708,832.33$
14 128,709,825.40$ 52,814,968.57$ 75,894,856.83$ (10,844,303.90)$ 65,050,552.93$ 22,767,693.53$ 53,127,163.30$ 9,470,454.26$ 69,179,286.59$
15 128,709,825.40$ 52,814,968.57$ 75,894,856.83$ (10,844,303.90)$ 65,050,552.93$ 22,767,693.53$ 53,127,163.30$ 8,372,876.42$ 77,552,163.01$
16 128,709,825.40$ 52,814,968.57$ 75,894,856.83$ (10,844,303.90)$ 65,050,552.93$ 22,767,693.53$ 53,127,163.30$ 7,402,502.31$ 84,954,665.31$
17 128,709,825.40$ 52,814,968.57$ 75,894,856.83$ (10,844,303.90)$ 65,050,552.93$ 22,767,693.53$ 53,127,163.30$ 6,544,589.66$ 91,499,254.97$
18 128,709,825.40$ 52,814,968.57$ 75,894,856.83$ (10,844,303.90)$ 65,050,552.93$ 22,767,693.53$ 53,127,163.30$ 5,786,104.75$ 97,285,359.72$
19 128,709,825.40$ 52,814,968.57$ 75,894,856.83$ (10,844,303.90)$ 65,050,552.93$ 22,767,693.53$ 53,127,163.30$ 5,115,524.42$ 102,400,884.13$
20 128,709,825.40$ 52,814,968.57$ 75,894,856.83$ (10,844,303.90)$ 65,050,552.93$ 22,767,693.53$ 53,127,163.30$ 4,522,660.96$ 106,923,545.09$
Rate of corporate tax 35% (0.00)$
IRR 13.11%
Total = Net present value =
14. 13
H2O N/A N/A N/A Not harmful N/A N/A N/A
Ethanol 1000
3450 Oral, mouse
Not harmful 3.3% 19% 363
6300 Oral, rabbit
9000 Oral, rat
7060 Oral, rat
CaO 2.2 7340 Oral, rat Not harmful N/A N/A N/A
Fructose N/A 15000 Rat Not harmful N/A N/A N/A
Glucose N/A 25800 Oral, rat Not harmful N/A N/A N/A
Source: OSHA
Volume percentage
in air at ambient
conditions
Table 15: Safety Parametersfor Materials Involved in the Ethanol fromSugarcane MillsProcess
LD50 Absorbed Orally in Rats, mg/kg
≤ 25 Very toxic
25 to 200 Toxic
200 to 2000 Harmful
Figure 8: LD50 Absorbed Orally in Rats, mg/kg
Unaccounted chemical, although all safety solutions are taken, escapes and can cause
unpredictable safety issues. Extra layers of protection should always be used as a backup. A check valve
should be used for process equipment that involves toxic material redundant. For personal safety, a
worker should always wear appropriate protective equipment like respirator, flame retardant clothing,
steel toe boots, and safety glasses. Figure 10 below shows the HAZOP on multiple effect evaporators.
Figure 9: HAZOP on Multiple Effect Evaporators
Scenario
Parameter Guide Word Deviation Possible Causes
Likelyhood
Consequences
Severity
Action
1 Flowrate NO No steam flow
Failure of inlet
pneumatic check valve
to open
5
Process fluid temperature not
heated accordingly
5
Install flowmeter to detect incident and
notice maintenance
2 Flowrate MORE More steam flow
Failure of pneumatic
check valve to close
4
Output of process fluid
temperature too high
7
Install temperature controller to control
steam
3 Flowrate REVERSE
Reverse process
fluid flow
Failure of process fluid
inlet valve
1 Product offset 3 Install check valve
4 Flowrate NO No fluid flow
Electronic control
valve fails
3
No steam to barometric
condenser to provide heat
1
Isolate the gate valve and enable the
bypass
5
Pressure
(shell side)
HIGH
Shell side high
pressure
Exchanger outlet
discharge check valve
closes
2
Exchanger shell side will be over
pressurized up to maximum
pump discharge pressure
4
Rated pump discharge pressure at no
flow should be less than exchanger design
pressure
15. 14
Figure 10: FMEA Rating Scale
Figure 11: Boston Square for Multiple Effect Evaporators HAZOP
Conclusions and Recommendations
Overall, this project provides a general design for sugarcane mill plant in which the plant is
operated at an on-stream factor of 0.50, and the annual output of ethanol is 420 million pounds (192,000
metric tons or 242 million liters) or 64 million gallons. With the corporate tax is 35% and IRR is 13.11%,
the NPV of this sugarcane plant after 20 years is calculated as approximate as $107 MM. The payback
period is 8 years,and the profit is earned at the 9th
year. Any technical improvement is required to reduce
either the capital investment or the cost of production in order to improve the economic analysis.
Rating Detection
1 Current safeguards adequate
3 High chance that safeguard will detect
5 Moderate chance that safeguard will detect
7 Low chance that safeguard will detect
10 No known method of detection
Severity
FMEA Rating Scale
Likelyhood of Occurrence
Failure will always happen
Effect is insiginificant
Minor disruption, Customer dissatisfied
Major equipment damage
Personal injury
Death likely to occur
Failure is very unlikely
Occasional failure likely
Moderate likelyhood of failure
Failure is very likely
0
1
2
3
4
5
6
7
8
9
10
0 1 2 3 4 5 6 7 8 9 10
Severity
Likelyhood
Boston Square
Scenario 1 Scenario 2 Scenario 3 Scenario 4 Scenario 5