The document describes the formatting requirements for different chart types. Line charts require category labels in the first column and numeric data values in subsequent columns, which can include optional annotation text. Bar and column charts require category labels in the first column and numeric values in other columns to determine bar heights. Pie charts only need two columns, with the first containing slice labels and the second containing corresponding numeric values.
UiPath manufacturing technology benefits and AI overview
Chart Formats
1. Chart Formats
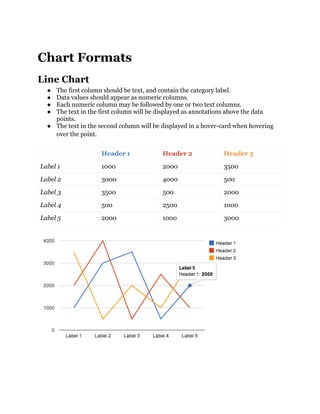
Line Chart
● The first column should be text, and contain the category label.
● Data values should appear as numeric columns.
● Each numeric column may be followed by one or two text columns.
● The text in the first column will be displayed as annotations above the data
points.
● The text in the second column will be displayed in a hover-card when hovering
over the point.
Header 1 Header 2 Header 3
Label 1 1000 2000 3500
Label 2 3000 4000 500
Label 3 3500 500 2000
Label 4 500 2500 1000
Label 5 2000 1000 3000
2. Bar Chart
● The first column in the table should be a string, and represents the label of that
group of bars.
● Any number of columns can follow, all numeric, each representing the bars with
the same color and relative position in each group.
● The value at a given row and column controls the height of the single bar
represented by this row and column.
Header 1 Header 2 Header 3
Label 1 1000 2000 3500
Label 2 3000 4000 500
Label 3 3500 500 2000
Label 4 500 2500 1000
Label 5 2000 1000 3000
3. Column Chart
● The first column in the table should be a string, and represents the label of that
group of bars.
● Any number of columns can follow, all numeric, each representing the bars with
the same color and relative position in each group.
● The value at a given row and column controls the height of the single bar
represented by this row and column.
Header 1 Header 2 Header 3
Label 1 1000 2000 3500
Label 2 3000 4000 500
Label 3 3500 500 2000
Label 4 500 2500 1000
Label 5 2000 1000 3000
4. Pie Chart
● The first column should be a string, and contain the slice label.
● The second column should be a number, and contain the slice value.
Header
Label 1 1000
Label 2 3000
Label 3 3500
Label 4 500
Label 5 2000