This document serves as a comprehensive guide to using Microsoft Project 2013, detailing the steps to open templates, adjust screen elements, utilize various project views, create reports, and apply filters. It emphasizes the importance of understanding project management concepts, such as work breakdown structures and resource assignments, before utilizing the software. Additionally, it provides hands-on activities and instructions for creating new project files, as well as accessing help features for further learning.
![Chapter A: Guide to Using Microsoft Project 2013 Exploring
Project 2013 Using an Existing File
Book Title: Information Technology Project Management
Printed By: Joseph English ([email protected])
© 2016 Cengage Learning, Cengage Learning
Exploring Project 2013 Using an Existing File
To open a template file and adjust Project 2013 screen
elements:
1.
Open Project 2013 and select the Customer Service template
file. Click the
Start button on the taskbar, select Project 2013, click Customer
Service,
and then click Create. These screen shots were taken on April 3,
2013,
so you can enter that date if you like. Your screen should
resemble
Figure A-12. (Note: If you cannot find the template, you can
download it
from www.intropm.com and open it. To open an existing file,
click the File
tab, then select Open, and browse to find the file.)
Figure A-12
Customer Service Template File
Created using Microsoft Project, used with permission from
Microsoft.](https://image.slidesharecdn.com/chapteraguidetousingmicrosoftproject2013exploringpro-221025174332-358401bd/75/Chapter-A-Guide-to-Using-Microsoft-Project-2013-Exploring-Pro-docx-1-2048.jpg)
![only the critical tasks appear in the WBS. Experiment with
other filters.
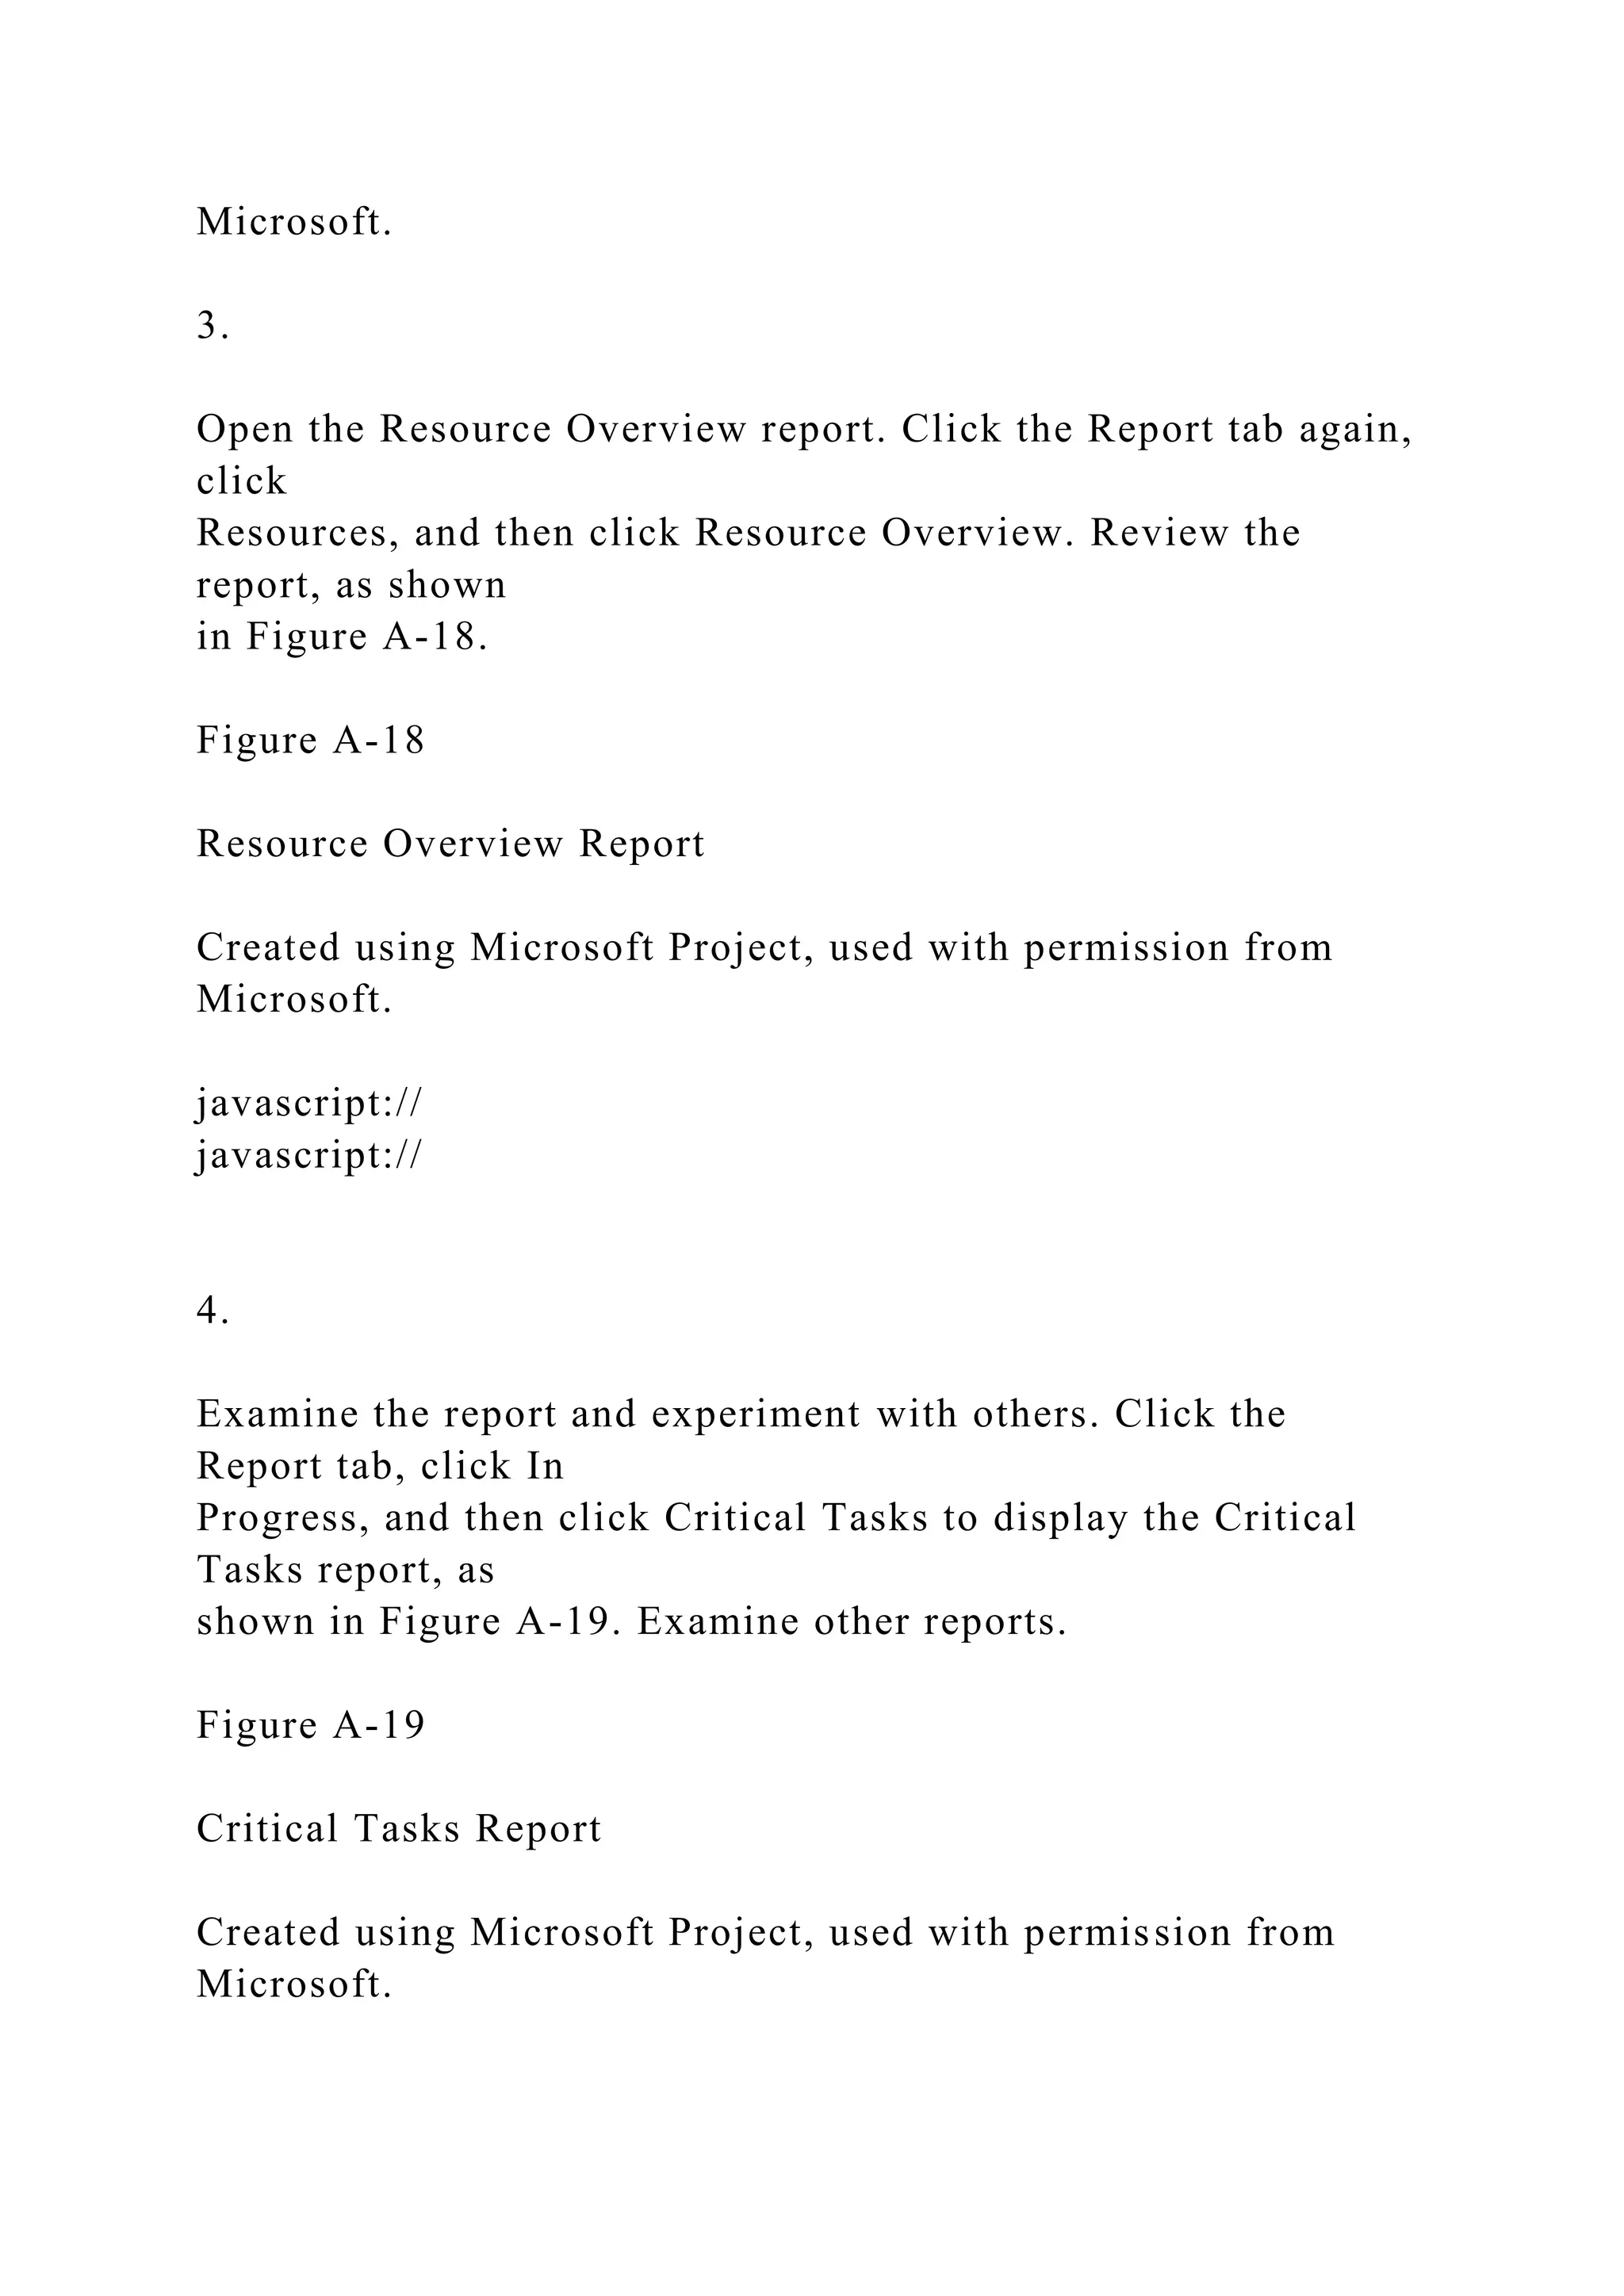
4.
Close the file. When you are finished reviewing the Customer
Service file,
click Close from the File tab or click the Close button. Click No
when asked if
you want to save changes.
5.
Exit Project 2013. Click the Close button for Project 2013.
javascript://
Now that you are familiar with the main screen elements, views,
reports, and filters, you will
learn how to use Project 2013 to create a new file.
Chapter A: Guide to Using Microsoft Project 2013 Exploring
Project 2013 Using an Existing File
Book Title: Information Technology Project Management
Printed By: Joseph English ([email protected])
© 2016 Cengage Learning, Cengage Learning
© 2019 Cengage Learning Inc. All rights reserved. No part of
this work may by reproduced or used in any form or by any
means - graphic, electronic, or mechanical, or in any other
manner - without the written permission of the copyright holder.](https://image.slidesharecdn.com/chapteraguidetousingmicrosoftproject2013exploringpro-221025174332-358401bd/75/Chapter-A-Guide-to-Using-Microsoft-Project-2013-Exploring-Pro-docx-11-2048.jpg)
![Chapter A: Guide to Using Microsoft Project 2013 Using
Project 2013
Book Title: Information Technology Project Management
Printed By: Joseph English ([email protected])
© 2016 Cengage Learning, Cengage Learning
Using Project 2013
Before you can use Project 2013 or any project management
software effectively, you must
understand the fundamental concepts of project management,
such as creating work
breakdown structures (WBS), linking tasks, entering duration
estimates, assigning
resources, and so on. The purpose of this text is to provide
specific instructions for using
Project 2013 Professional. Consult Microsoft’s website for
detailed information on other
products and other resources to help you understand project
management concepts.
Before You Begin
This appendix assumes you are using Project 2013 with
Windows 7 (or later) and are
familiar with other Windows-based applications. Check your
work by reviewing the many
screen shots included in the steps, or by using the solution files
that are available for
download from the companion website or from your instructor.
Note
You need to be running Windows 7 or later to use Project 2013,
a 1 Ghz or greater
x86/x64 processor with SSE2 instruction set, 1 GB RAM (32
Bit) / 2 GB RAM (64](https://image.slidesharecdn.com/chapteraguidetousingmicrosoftproject2013exploringpro-221025174332-358401bd/75/Chapter-A-Guide-to-Using-Microsoft-Project-2013-Exploring-Pro-docx-12-2048.jpg)
![Many features in Project 2013 are similar to ones in other
Windows programs. For example,
to collapse or expand tasks, click the appropriate symbols to the
left of the task name. To
access shortcut items, right-click in either the Entry table area
or the Gantt chart. Many of
the Entry table operations in Project 2013 are very similar to
operations in Excel. For
example, to adjust a column width, click and drag between the
column heading titles.
Next, you will get some hands-on experience by opening an
existing file to explore various
screen elements. Project 2013 comes with several template files,
and you can also access
templates from Microsoft Office Online or other websites.
Chapter A: Guide to Using Microsoft Project 2013 Using
Project 2013
Book Title: Information Technology Project Management
Printed By: Joseph English ([email protected])
© 2016 Cengage Learning, Cengage Learning
© 2019 Cengage Learning Inc. All rights reserved. No part of
this work may by reproduced or used in any form or by any
means - graphic, electronic, or mechanical, or in any other
manner - without the written permission of the copyright holder.
Chapter A: Guide to Using Microsoft Project 2013 Project
Management Software Reviews
Book Title: Information Technology Project Management
Printed By: Joseph English ([email protected])](https://image.slidesharecdn.com/chapteraguidetousingmicrosoftproject2013exploringpro-221025174332-358401bd/75/Chapter-A-Guide-to-Using-Microsoft-Project-2013-Exploring-Pro-docx-22-2048.jpg)
![2. Genius Project
3. Daptiv
4. Tenrox
5. Celoxis
6. Project Insight
7. AtTask
8. EPM Live
9. Liquid Planner
10. Easy Projects.net
TopTenREVIEWS™ only listed online project management
tools in 2013, and their review
was done before Microsoft’s Project Online was released. Tools
in this list provide the ability
to create Gantt charts, numerous reports and views, project
dashboards, and integrate with
Microsoft Project files. See End Note 2 or visit the websites for
any of these products and
use a free trial version. Also note that there are many other
tools available.
Chapter A: Guide to Using Microsoft Project 2013 Project
Management Software Reviews
Book Title: Information Technology Project Management
Printed By: Joseph English ([email protected])
© 2016 Cengage Learning, Cengage Learning](https://image.slidesharecdn.com/chapteraguidetousingmicrosoftproject2013exploringpro-221025174332-358401bd/75/Chapter-A-Guide-to-Using-Microsoft-Project-2013-Exploring-Pro-docx-26-2048.jpg)
![© 2019 Cengage Learning Inc. All rights reserved. No part of
this work may by reproduced or used in any form or by any
means - graphic, electronic, or mechanical, or in any other
manner - without the written permission of the copyright holder.
Chapter A: Guide to Using Microsoft Project 2013 Basic
Features of Project Management Software
Book Title: Information Technology Project Management
Printed By: Joseph English ([email protected])
© 2016 Cengage Learning, Cengage Learning
Basic Features of Project Management Software
What makes project management software different from other
software tools? Why not just
use a spreadsheet or database to help manage projects?
You can do a lot of project management planning and tracking
using non-project
management software. You could use a simple word processor
to list tasks, resources,
dates, and so on. If you put that information into a spreadsheet,
you can easily sort it, graph
it, and perform other functions. A relational database tool could
provide even more
manipulation of data. You can use e-mail and other tools to
collaborate with others.
However, project management software is designed specifically
for managing projects, so it
normally includes several distinct and important features not
found in other software
products:](https://image.slidesharecdn.com/chapteraguidetousingmicrosoftproject2013exploringpro-221025174332-358401bd/75/Chapter-A-Guide-to-Using-Microsoft-Project-2013-Exploring-Pro-docx-27-2048.jpg)
![reports show progress in other areas.
Providing other advanced project management features: Project
management
software often provides other advanced features, such as setting
up different types of
scheduling dependencies, determining the critical path and slack
for tasks, working
with multiple projects, and leveling resources. For example, you
can easily set up a
task to start when its predecessor is halfway finished. After
entering task
dependencies, the software should easily show you the critical
path and slack for
each task. You can also set up multiple projects in a program
and perform portfolio
management analysis with some products. Many project
management software
products also allow you to easily adjust resources within their
slack allowances to
create a smoother resource distribution. These advanced
features unique to project
management are rarely found in other software tools.
As you can see, there are several important features that are
unique to project management
software that make them worth using. Next you’ll learn what’s
new in Project 2013 and how
to use its basic features.
Chapter A: Guide to Using Microsoft Project 2013 Basic
Features of Project Management Software
Book Title: Information Technology Project Management
Printed By: Joseph English ([email protected])](https://image.slidesharecdn.com/chapteraguidetousingmicrosoftproject2013exploringpro-221025174332-358401bd/75/Chapter-A-Guide-to-Using-Microsoft-Project-2013-Exploring-Pro-docx-29-2048.jpg)
![© 2016 Cengage Learning, Cengage Learning
© 2019 Cengage Learning Inc. All rights reserved. No part of
this work may by reproduced or used in any form or by any
means - graphic, electronic, or mechanical, or in any other
manner - without the written permission of the copyright holder.
Chapter A: Guide to Using Microsoft Project 2013 What’s New
in Project 2013
Book Title: Information Technology Project Management
Printed By: Joseph English ([email protected])
© 2016 Cengage Learning, Cengage Learning
What’s New in Project 2013
If you are familiar with Project 2010 or an earlier version, it
may be helpful to review some of
the new features in Project 2013.
Improved reports: With Project 2013, you can create
professional reports and add
pictures, charts, animation, and links to clearly share project
status information. An
entirely new set of pre-installed reports are available, including
burn down reports, a
popular chart used for agile projects. The earned value chart is
also much easier to
create.
New collaboration features: You can stay in touch with team
members by getting
progress updates, asking questions, or having strategy
discussions, all without leaving
Project 2013. You can hover over a name and start an IM](https://image.slidesharecdn.com/chapteraguidetousingmicrosoftproject2013exploringpro-221025174332-358401bd/75/Chapter-A-Guide-to-Using-Microsoft-Project-2013-Exploring-Pro-docx-30-2048.jpg)
![Next, you will learn some basic information about Project 2013
and explore the main screen
elements and Help facility.
Chapter A: Guide to Using Microsoft Project 2013 What’s New
in Project 2013
Book Title: Information Technology Project Management
Printed By: Joseph English ([email protected])
© 2016 Cengage Learning, Cengage Learning
© 2019 Cengage Learning Inc. All rights reserved. No part of
this work may by reproduced or used in any form or by any
means - graphic, electronic, or mechanical, or in any other
manner - without the written permission of the copyright holder.](https://image.slidesharecdn.com/chapteraguidetousingmicrosoftproject2013exploringpro-221025174332-358401bd/75/Chapter-A-Guide-to-Using-Microsoft-Project-2013-Exploring-Pro-docx-32-2048.jpg)