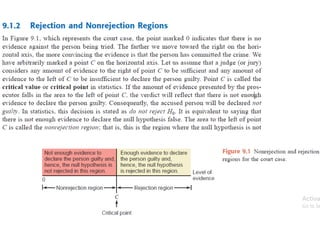
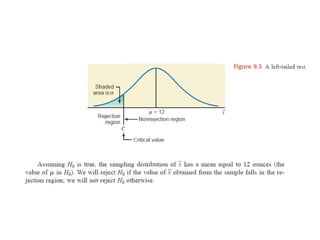
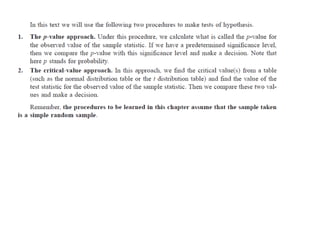
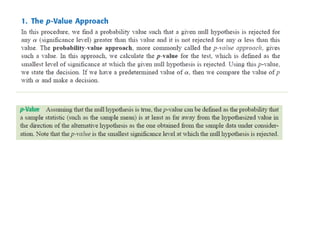
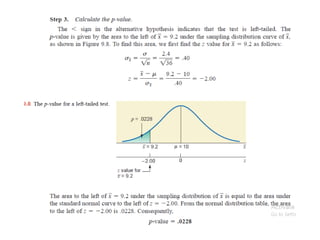
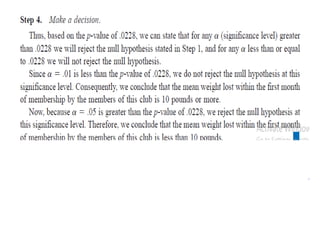
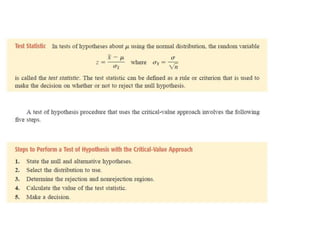
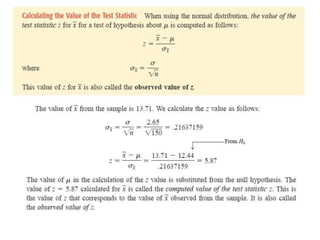
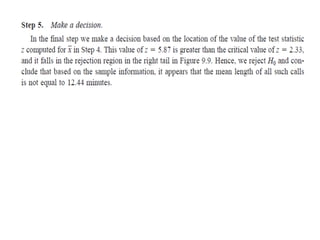
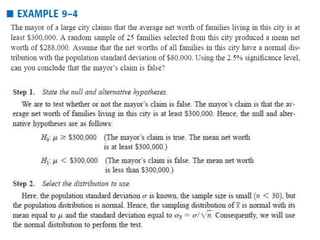
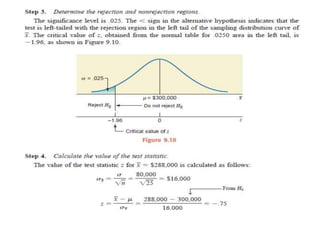
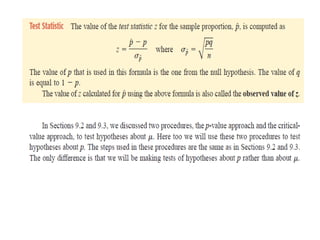
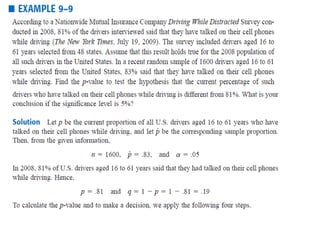
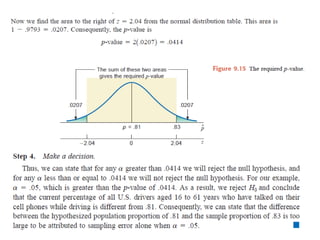
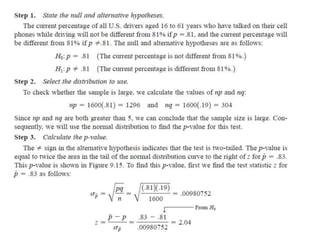
The null hypothesis states that a given claim (or statement) about a population
parameter is true.
Reconsider the example of the soft-drink company’s claim that, on average, its cans contain 12
ounces of soda.
• In reality, this claim may or may not be true.
• However, we will initially assume that the company’s claim is true (that is, the
company is not guilty of cheating and lying).
• To test the claim of the soft-drink company, the null hypothesis will be that the
company’s claim is true.
Home Work
Critical Value Approach
• In this procedure, we have a predetermined value of the significance level ∝.
•
i. The value of ∝ gives the total area of rejection regions.
ii. First we find the critical value(s) of z from the normal distribution table for the
given significance level.
iii. Then we find the value of the test statistic z for the observed value of the sample
statistic 𝑥.
iv. Finally we compare these two values and make a decision.
• Remember, if the test is one-tailed, there is only one critical value of z, and it
is obtained by using the value of ∝ which gives the area in the left or right
tail of the normal distribution curve depending on whether the test is left-
tailed or right-tailed, respectively.
• However, if the test is two-tailed, there are two critical values of z and they
are obtained by using
∝
2
area in each tail of the normal distribution curve.
Any Question??

chapter 9 Testing of Hypthesis.pptx

  • 3.
    The null hypothesisstates that a given claim (or statement) about a population parameter is true.
  • 4.
    Reconsider the exampleof the soft-drink company’s claim that, on average, its cans contain 12 ounces of soda. • In reality, this claim may or may not be true. • However, we will initially assume that the company’s claim is true (that is, the company is not guilty of cheating and lying). • To test the claim of the soft-drink company, the null hypothesis will be that the company’s claim is true.
  • 18.
  • 32.
    Critical Value Approach •In this procedure, we have a predetermined value of the significance level ∝. • i. The value of ∝ gives the total area of rejection regions. ii. First we find the critical value(s) of z from the normal distribution table for the given significance level. iii. Then we find the value of the test statistic z for the observed value of the sample statistic 𝑥. iv. Finally we compare these two values and make a decision. • Remember, if the test is one-tailed, there is only one critical value of z, and it is obtained by using the value of ∝ which gives the area in the left or right tail of the normal distribution curve depending on whether the test is left- tailed or right-tailed, respectively. • However, if the test is two-tailed, there are two critical values of z and they are obtained by using ∝ 2 area in each tail of the normal distribution curve.
  • 58.