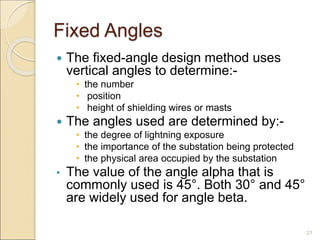
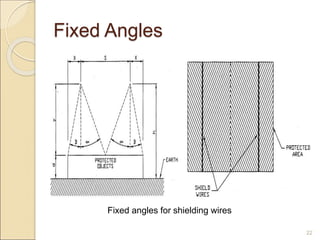
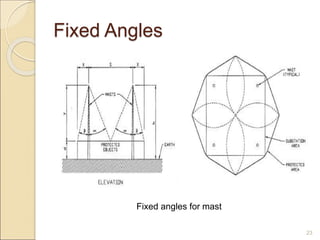
The document discusses lightning phenomena, stroke formation, lightning parameters, empirical design methods, the electrogeometric model (EGM), and insulation coordination. Some key points:
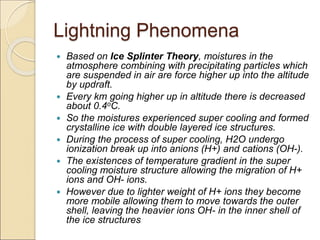
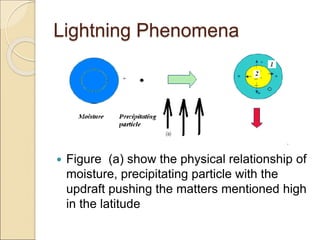
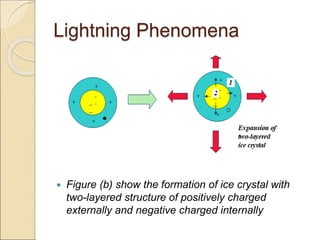
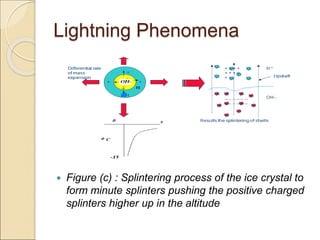
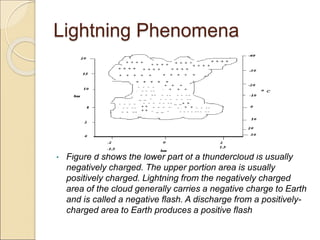
- Lightning forms due to the separation of charges within ice crystals in thunderclouds.
- A lightning stroke occurs through a stepped leader and return stroke process.
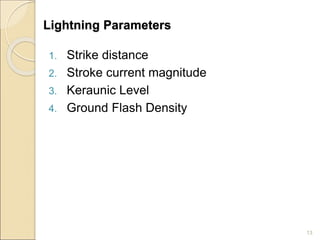
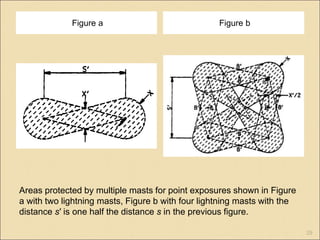
- Parameters like strike distance and current magnitude help determine protection needs.
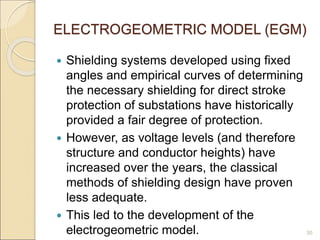
- Traditional methods use fixed angles or empirical curves to determine shielding requirements.
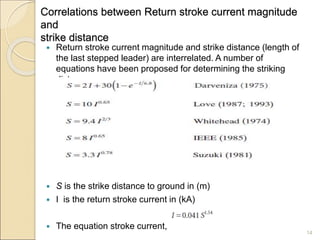
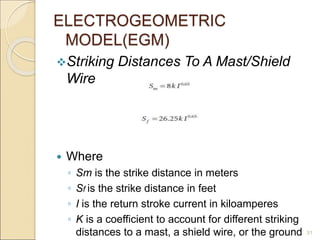
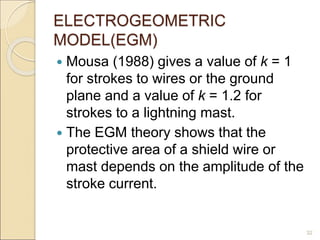
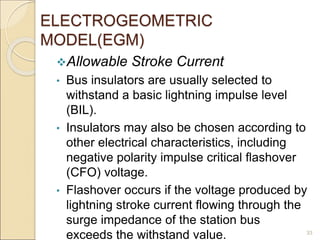
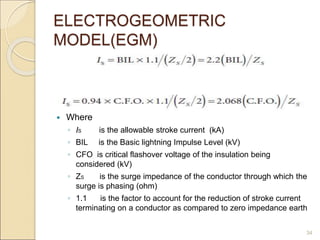
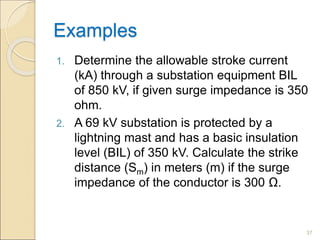
- The EGM model calculates allowable stroke currents and striking distances using insulation levels.
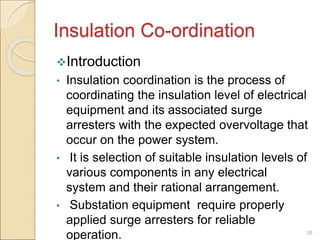
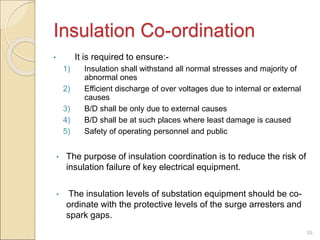
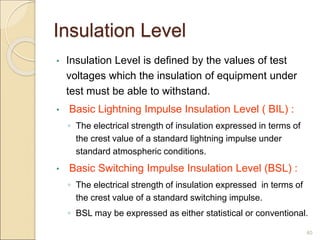
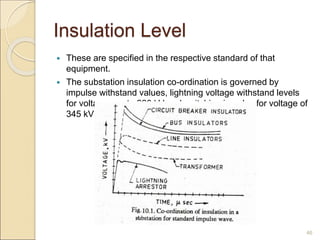
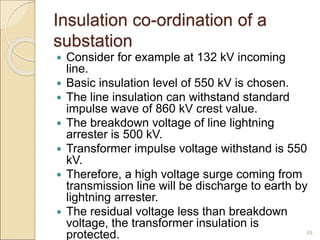
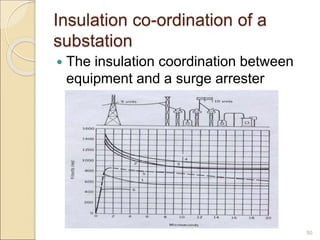
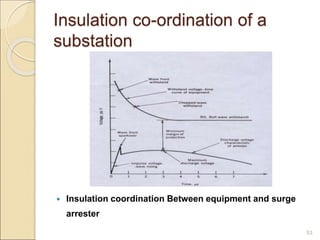
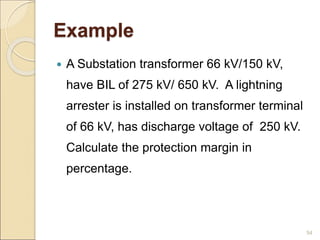
- Insulation coordination aims to select insulation levels and surge arresters to withstand overvoltages.


![EE3701 High Voltage Engineering HVE Unit 1 [Autosaved] [Autosaved].pptx](https://cdn.slidesharecdn.com/ss_thumbnails/ee3701highvoltageengineeringhveunit1autosavedautosaved-250916170537-c9a22cd4-thumbnail.jpg?width=640&height=640&fit=bounds)
![EE3701 High Voltage Engineering HVE Unit 1 [Autosaved] [Autosaved].pptx](https://cdn.slidesharecdn.com/ss_thumbnails/ee3701highvoltageengineeringhveunit1autosavedautosaved-250916165956-ab52e806-thumbnail.jpg?width=640&height=640&fit=bounds)


![[IJET V2I2P26] Authors: Pruthak C. Chauhan., Rinkesh S. Kansara, Mukesh P. Pa...](https://cdn.slidesharecdn.com/ss_thumbnails/ijet-v2i2p26-160609044757-thumbnail.jpg?width=640&height=640&fit=bounds)


