
Recommended
More Related Content
What's hot
What's hot (19)
Similar to Voltage Distribution in Suspension Insulators
Similar to Voltage Distribution in Suspension Insulators (20)
Recently uploaded
Recently uploaded (20)
Voltage Distribution in Suspension Insulators
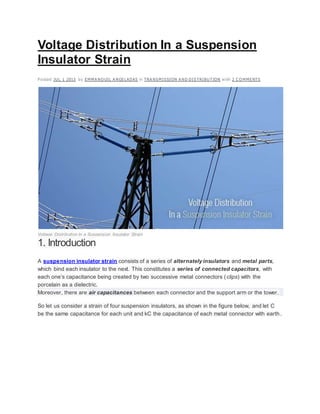
- 1. Voltage Distribution In a Suspension Insulator Strain P o sted JUL 1 2013 by EMMA NO UI L A NGELADAS in TRA NSMIS SION A ND DIS TRIBUTION with 2 C OMMENTS Voltage Distribution In a Suspension Insulator Strain 1. Introduction A suspension insulator strain consists of a series of alternately insulators and metal parts, which bind each insulator to the next. This constitutes a series of connected capacitors, with each one’s capacitance being created by two successive metal connectors ( clips) with the porcelain as a dielectric. Moreover, there are air capacitances between each connector and the support arm or the tower. So let us consider a strain of four suspension insulators, as shown in the figure below, and let C be the same capacitance for each unit and kC the capacitance of each metal connector with earth .
- 2. Four insulators strain Then, if V1 is the potential difference between the two metal connectors ( clips) of the first insulator, we have:
- 3. Even V1 + V2 + V3 + V4 = E (phase voltage of the line) → E = V1 (4 + 10k + 6k2 + k3) So, if k = 0,1, we have: From the results it appears that the first insulator has only one fifth of the total voltage, while the latter has almost one third. 2. Corona rings The distribution of the potential along the insulators strain can be improved by using a smoothing ring (Corona ring) or a protective ring, which consists of a large metal ring surrounding the last insulator that is electricallyconnected to the line.
- 4. The corona ring inserts capacitances between the metal connectors ( clips) of the insulators and the line. For these capacitances, special care can be taken in order to compensate the capacitances to earth. 3. Cases of insulators strains with or without Corona rings Case 1 Determine the potential distribution in a strain of three insulators, if the capacitances of the links to earth and to the line are respectively 20% and 10% of the capacitance of the insulators. Also, determine the performance of the strain.
- 5. Case 2 An overhead 3-phase transmission line, which has phase voltage 30 kV, is hanging from athree insulators suspension strain. The capacitance between the links and the earth is 0,2 C, where C is the capacitance of an insulator. 1. Determine the potential distribution along the insulators strain.
- 6. 2. If a protective (corona) ring inserts capacitances from the line, with the link of the middle and the lower insulator set at 0,4 C and the link of the medium and the higher insulator set at 0,1 C, find the new distribution. 2.1 DETERMINE THE POTENTIAL DISTRIBUTION ALONG THE INSULATORS STRAIN Insulators strain without Corona ring
- 7. 2.2 PROTECTIVE (CORONA) RING INSERTS CAPACITANCES FROM THE LINE
- 8. Insulators strain with Corona ring
- 9. 4. Generalized formula of voltage distribution in a suspension insulators strain The above mathematical formula is the generalized formula we can use to find the voltage Vn of the (n-1) insulator. E = phase voltage of the line. The value of ‘a’ is given by the above formula: 4.1 Determine the voltage distribution in a six insulators strain (z=6) with k=0,1
- 10. 4.2 Determine the voltage distribution of the first, the sixth and the twelfth insulator with z = 12 (12 – insulators strain) and k = 0,1 We have:
- 11. REFERENCES: Vasilios N. Xanthos – Generation, Transmission, Distribution, Measurement and saving of Electrical Energy The Electric Power Engineering Handbook – Wilford Caulkins and Kristine Buchholz http://electrical-engineering-portal.com/guidelines-for-the-construction-and-maintenance-of-transmission- lines Overhead Transmission Lines – Static Mechanical Support P o sted JUN 17 2013 by EMMA NO UI L A NGELADAS in TRA NSMIS SION A ND DIS TRIBUTION with 3 C OMMENTS
- 12. Overhead Transmission Lines - Principles of Engineering // Static Mechanical Support Introduction to the designing principles When designing an overhead transmission line, we should pay attention to ensure that thetension force does not exceed, in any case, the limit of the mechanical strength of the conductor. The maximum stress occurs at the lower temperature,when the line is subjected to contraction, and a possible ice coating. Moreover, it should be considered that can simultaneously be and wind pressure on the line. To address these conditions, a requirement, is knowledge of thearrow of the conductor. Besides, the arrow determines the height and strength of the supporting towers, as well as the span length (distance between two towers). 1. Static vision of the transmission line Even:
- 13. l = span length in m (distance between two support points). L = conductor length in m, corresponding to the opening l. w = conductor weight in Kpper meter. T = tensile strength of the transmission line, in Kp. D = maximum arrow, in m. 2. Transmission line coated with ice & under the effect of wind Even: d = conductor diameter in cm. i = radial ice thickness in cm. wi= ice weight per meter. P = wind pressure at speed of 80 km/hr. W = resultant force (weight and wind pressure). The vertical component of the arrow: 3. Calculation of the arrow (transmission line construction) We accept as unfavorable conditions the following: Ambient temperature -10°C Radial ice coating 1 cm Wind speed 80 km/hr
- 14. With these conditions, we choose 2nd degree safety factor, so that the tension force should not exceed half the breaking load of the conductor. During the construction of the transmission line, with the conditions prevailing at the time (higher temperature and without ice), the tension must be done in such a way that, at the most unfavorable conditions, the transmission line to have a 2nddegree safety factor. According to Rapson: when: T = tensile strength during the construction, in Kp (is considered constant along the transmission line). A = conductor cross section, in cm2 E = yield strength factor, in Kp/cm2 α = expansion factor per °C. t = ambient temperature above -10°C. Tc = tensile strength in adverse conditions, in Kp (Tc obtained half of the breaking load). By solving the above formula, we obtain the value of T. Then, the arrow, during the construction, is: 4. Transmission line based on different levels Consider “O” the imaginary lowest point of the transmission line. x1 = is the horizontal distance between the lowest support point and the “O”. x2 = is the horizontal distance between the highest support point and the “O”. D1 = is the imaginary arrow from the lowest support point. D2 = is the imaginary arrow from the highest support point. With these data, we have: We observe that:
- 15. From the above, we have: With the values of x1, x2, the arrows D1, D2 can be calculated, as well as the height of any point on the transmission line from the ground. Example An overhead transmission line crosses a river and it is based on the two banks by two towers at height h1=91.4m and h2=45.7m above the water surface. The horizontal distance between the towers is 335.3 m. The maximum tensile force is T = 1932.3 Kp and the weight of the conductor is w = 0.884Kp/m. Determine the height “h” of the line over the water, midway between the two towers. Consider “O” the imaginary lowest point of the transmission line and D1, D2 the arrows from the lower and the tallest tower respectively.
- 16. Transmission line based on different levels However: Therefore:
- 17. Reference: Vasilios N. Xanthos – Generation, Transmission, Distribution, Measurement and saving of Electrical Energy Total Losses in Power Distribution and Transmission Lines (2) P o sted MA R 3 2014 by JIGUPA RMA R in ENERGY A ND POWER, ENERGY EF FICENCY with 1 C OMMENT
- 18. Total Losses in Power Distribution and Transmission Lines (Photo taken my Michael Kappel) Continued from first part: Total Losses in Power Distribution & Transmission Lines (1) There are two types of transmission and distribution losses: 1. Technical losses (explained in previous part) 2. Non-technical losses (commercial losses) 2. Non-technical (commercial losses) Non-technical losses are at 16.6%, and related to meter reading, defective meter and error in meter reading, billing of customer energy consumption, lack of administration, financial constraints, and estimating unmetered supply of energy as well as energy thefts. Main reasons for non-technical losses How to reduce technical losses? How to reduce non-technical losses? Main reasons for non-technical losses
- 19. 1. Power theft Theft of power is energy delivered to customers that is not measured by the energy meter for the customer. Customer tempers the meter by mechanical jerks, placement of powerful magnets or disturbing the disc rotation with foreign matters, stopping the meters by remote control. 2. Metering inaccuracies Losses due to metering inaccuracies are defined as the difference between the amount of energy actually delivered through the meters and the amount registered by the meters. All energy meters have some level of error which requires that standards be established. Measurement Canada, formerly Industry Canada, is responsible for regulating energy meter accuracy. Statutory requirements are for meters to be within an accuracy range of +2.5% and – 3.5%. Old technology meters normally started life with negligible errors, but as their mechanisms aged they slowed down resulting in under-recording. Modern electronic meters do not under -record with age in this way. Consequently, with the introduction of electronic meters, there should have been a progressive reduction in meter errors. Increasing the rate of replacement of mechanical meters should accelerate this process 3. Unmetered losses for very small load Unmetered losses are situations where the energy usage is estimated instead of measured with an energy meter. This happens when the loads are very small and energy meter installation is economically impractical. Examples of this are street lights and cable television amplifiers. 4. Unmetered supply Unmetered supply to agricultural pumps is one of the major reasons for commercial losses. In most states, the agricultural tariff is based on the unit horsepower (H.P.) of the motors. Such power loads get sanctioned at the low load declarations.
- 20. Once the connections are released, the consumers increasing their connected loads, without obtaining necessary sanction, for increased loading, from the utility. Further estimation of the energy consumed in unmetered supply has a great bearing on the estimation of T&D losses on account of inherent errors in estimation. Most of the utilities deliberately overestimate the unmetered agricultural consumption to get higher subsidy from the State Govt. and also project. reduction in losses. In other words higher the estimates of the unmetered consumption, lesser the T&D loss figure and vice versa. Moreover the correct estimation of unmetered consumption by the agricultural sector greatly depends upon the cropping pattern, ground water level, seasonal variation, hours of operation etc. 5. Error in Meter Reading Proper calibrated meter should be used to measure electrical energy. Defective energy meter should be replaced immediately. The reason for defective meter are burning of meters, burn out terminal box of meter due to heavy load, improper C.T.ratio and reducing the recording, imprope r testing and calibration of meters. 6. Billing problems Faulty and untimely serving bill should be main part of non-technical Losses. Normal complain regarding billing are not receipt of bill, late receipt of bill, receiving wrong bill, wrong meter reading, wrong tariff, wrong calculations. Go to Content ↑ How to reduce technical losses? 1. Converting LV Line to HV Line Many distribution pockets of low voltage (430V) in town are surrounded by higher voltage feeders. At this lower voltage, more conductor current flows for the same power delivered, resulting in higher I2R losses. Converting old LV (430V) feeders to higher voltage the investment cost is high and often not economically justifiable, but if parts of the LV (430V) primary feeders are in relatively good condition, installing multiple step-down power transformers at the periphery of the 430 volt area
- 21. will reduce copper losses by injecting load current at more points ( i.e., reducing overall conductor current and the distance traveled by the current to serve the load). 2. Large Commercial / Industrial Consumer get direct Line from Feeder Design the distribution network system in such a way that if it is possible than large consumer gets direct power line from feeder. 3. Adopting high voltage distribution service (HVDS) for agricultural customer In high voltage direct service (HVDS), 11KV line direct given to cluster of 2 to 3 agricultural customer for agricultural pump set and employed small distribution transformer (15KVA) for given these 2 to 3 customer through smallest (almost negligible) LT distribution lines. In HVDS there is less distribution losses due to minimum length of distribution line, high quality of power supply with no voltage drop, less burn out of motor due to less voltage fluctuation and good quality of power, to avoid overloading of transformer. 4. Adopting arial bundle conductor (ABC) Where LT line are not totally avoidable use Arial Bundle Conductor to minimize faults in lines, to avoid direct theft from line (tampering of line). 5. Reduce number of transformer Reduce the number of transformation steps. Transformers are responsible for almost half of network losses. High efficiency distribution transformers can make a large impact on reduction of distribution losses. 6. Utilize feeder on its average capacity By overloading of distribution feeder distribution losses will be increase. The higher the load on a power line, the higher its variable losses. It has been suggested that the optimal average utilization rate of distribution network cables should be as low as 30% if the cost of losses is taken into account.
- 22. 7. Replacements of old conductor / cables By using the higher the cross-section area of conductor / cables the losses will be lower but the same time cost will be high so by forecasting the future load an optimum balance between investment cost and network losses should be maintained. 8. Feeder renovation / Improvement program Reconductoring of transmission and distribution line according to load. Identification of the weakest areas in the distribution system and strengthening /improving them. Reducing the length of LT lines by relocation of distribution sub stations or installations of additional new distribution transformers. Installation of lower capacity distribution transformers at each consumer premises instead of cluster formation and substitution of distribution transformers with those having lower no load losses such as amorphous core transformers. Installation of shunt capacitors for improvement of power factor. Installation of single-phase transformers to feed domestic and nondomestic load in rural areas. Providing of small 25kVA distribution transformers with a distribution box attached to its body, having provision for installation of meters, MCCB and capacitor. Lying of direct insulated service line to each agriculture consumer from distribution transformers Due to feeder renovation program T&D loss may be reduced from 60-70 % to 15-20 %. 9. Industrial / Urban Focus Program Separations of Rural Feeders from Industrial Feeders. Instantly release of New Industrial or HT connections. Identify and Replacement of slow and sluggish meters by Electronics type meters. In Industrial and agricultural Consumer adopt One Consumer, one Transformer scheme with meter should be Introduced. Change of old Service Line by armored cable. Due to Feeder Renovation Program T&D loss may be reduced from 60-70 % to 15-20 %. 10. Strictly Follow Preventive Maintenance Program
- 23. Required to adopt Preventive Maintenance Program of line to reduce losses due to faulty / leakage line parts. Required to tights of Joints, Wire to reduce leakage current. How to reduce Non-Technical Losses? 1. Making mapping / Data of Distribution Line Mapping of complete primary and secondary distribution system with all parameters such as conductor size, line lengths etc. Compilation of data regarding existing loads, operating conditions, forecast of expected loads etc. Preparation of long-term plans for phased strengthening and improvement of the distribution systems along with transmission system. 2. Implementation of energy audits schemes It should be obligatory for all big industries and utilities to carry out Energy Audits of their system. Further time bound action for initiating studies for realistic assessment of the total T&D Losses into technical and non-technical losses has also to be drawn by utilities for identifying high loss areas to initiate remedial measures to reduce the same. The realistic assessment of T&D Loss of a utility greatly depends on the chosen sample size which in turn has a bearing on the level of confidence desired and the tolerance limit of variation in results. In view of this it is very essential to fix a limit of the sample size for realistic quick estimates of losses. 3. Mitigating power theft by Power theft checking Drives Theft of electric power is a major problem faced by all electric utilities. It is necessary to make strict rule by State Government regarding Power theft. Indian Electricity Act has been amended to make theft of energy and its abatement as a cognizable offense with deterrent punishment of up to 3 years imprisonment.
- 24. The impact of theft is not limited to loss of revenue, it also affects power quality resulting in low voltage and voltage dips. Required to install proper seal management at Meter terminal Box, at CT/PT terminal to prevent power theft. Identify Power theft area and required to expedite power theft checking drives. Installation of medium voltage distribution (MVD) networks in theft -prone areas, with direct connection of each consumer to the low voltage terminal of the supply transformer. All existing unmetered services should be immediately stopped. 4. Replacement of Faulty/Sluggish Energy Meter It is necessary to replacement of Faulty or sluggish Meter by Distribution Agency to reduce un metered Electrical energy. Required to test Meter periodically for testing of accuracy of meter. Replacement of old erroneous electromechanical meters with accurate Electro static Meter (Micro presser base) for accurate measurement of energy consumption. Use of Meter boxes and seals them properly to ensure that the meters are properly sealed and cannot be tampered. 5. Bill Collection facility Increase Bill’s Payment Cells, Increasing drop Box facility in all Area for Payment Collection. E-Payment facility gives more relief to Customer for bill Payment and Supply agency will get Payment regularly and speedily from Customer. Effectively disconnect the connection of defaulter Customer who does not pay the Bill rather than give them chance to pay the bill. 6. Reduce Debit areas of Sub Division Recovery of old debts in selected cases through legal, communication and judicial actions. Ensuring police action when required to disconnect connection of defaulter Consumer. 7. Watchdog effect on users Users must aware that the distribution Agency can monitor consumption at its convenience. This allows the company fast detection of any abnormal consumption due to tampering or by-passing of a meter and enables the company to take corrective action.
- 25. The result is consumer discipline. This has been shown to be extremely effective with all categories of large and medium consumers having a history of stealing electricity. They stop stealing once they become aware that the utility has the means to detect and record it. These measures can significantly increase the revenues of utilities with high non-technical losses. 8. Loss Reduction Programmed The increased hours of supply to Agriculture and Rural domestic consumers have resulted in higher loss levels Handbook of electrical installation practice fourth edition – Eur Ing GEOFFREY STOKES http://electrical-engineering-portal.com/erection-procedures-of-earthing-arrangements-tnc-tn-s-tnc-s-and- tt http://www.slideshare.net/valakamlesh/switchgear-and-protection-by-vala-kamlesh http://www.slideshare.net/moiz89/protection-of-transmission-linesdistance-relay-protection-scheme http://www.slideshare.net/JoeloRoss/abb-transformersprotectioncourse-2001 http://www.slideshare.net/PowerpointEngineering/hv-circuit-breaker-testing http://www.slideshare.net/Rahuldey1991/protection-of-generator http://www.slideshare.net/thorneandderrick1985/nexans-power-accessories-content-pages-2013 http://www.slideshare.net/sontyal/transmission-line-towers-and-details http://www.slideshare.net/zunaibali/dc-transmission http://www.slideshare.net/harirprasath/modern-powersystemsanalysisdpkothariijnagrath http://www.slideshare.net/Aisu/newton-raphson http://www.slideshare.net/surenthar6/power-system-analysis-hadi-saadat http://www.slideshare.net/indraswahyudi/657-emerging-techniques-in-power-system-analysis http://www.slideshare.net/SmritiJain8/hadi-sadat-power-system-analysis-tmh http://www.slideshare.net/Nuumero1/power-plant-engineering-by-r-k-rajput http://www.slideshare.net/BogingBobit/circuit-analysis-demystified
- 26. http://www.slideshare.net/engrsabirshah/chapman-electric-machinery-fundamentals-5th-c2012- solutions-ism http://www.slideshare.net/kownanmursalin/electric-power-system-basics-by-steven-w-blume http://www.slideshare.net/srikanth0204rits/power-system-control-and-stability-vol-1-anderson http://www.slideshare.net/chndkr87/49620072- machowskibialekbumbipowersystemdynamicsstabilityandcontrolwiley http://www.slideshare.net/VijayaKrishna6/91705548-powerplantengineeringblack-veatch http://www.slideshare.net/louizrae/hayt-engineering-circuit-analysis-8th-txtbk http://www.slideshare.net/mayankjoshi1232/power-plant-engineering-p-k-nag http://www.slideshare.net/rssraaz/design-of-tower http://www.slideshare.net/sushrutARSENAL/electric-power-systemplanningissuesalgorithmsandsolutions http://www.nct-tech.edu.lk/Download/Technology%20Zone/Stepping%20Motors.pdf http://www.nct-tech.edu.lk/Download/Technology%20Zone/Power%20Factor%20Improvement..pdf http://www.nct-tech. edu.lk/Download/Technology%20Zone/Performance%20of%20Transmission%20Lines..pdf