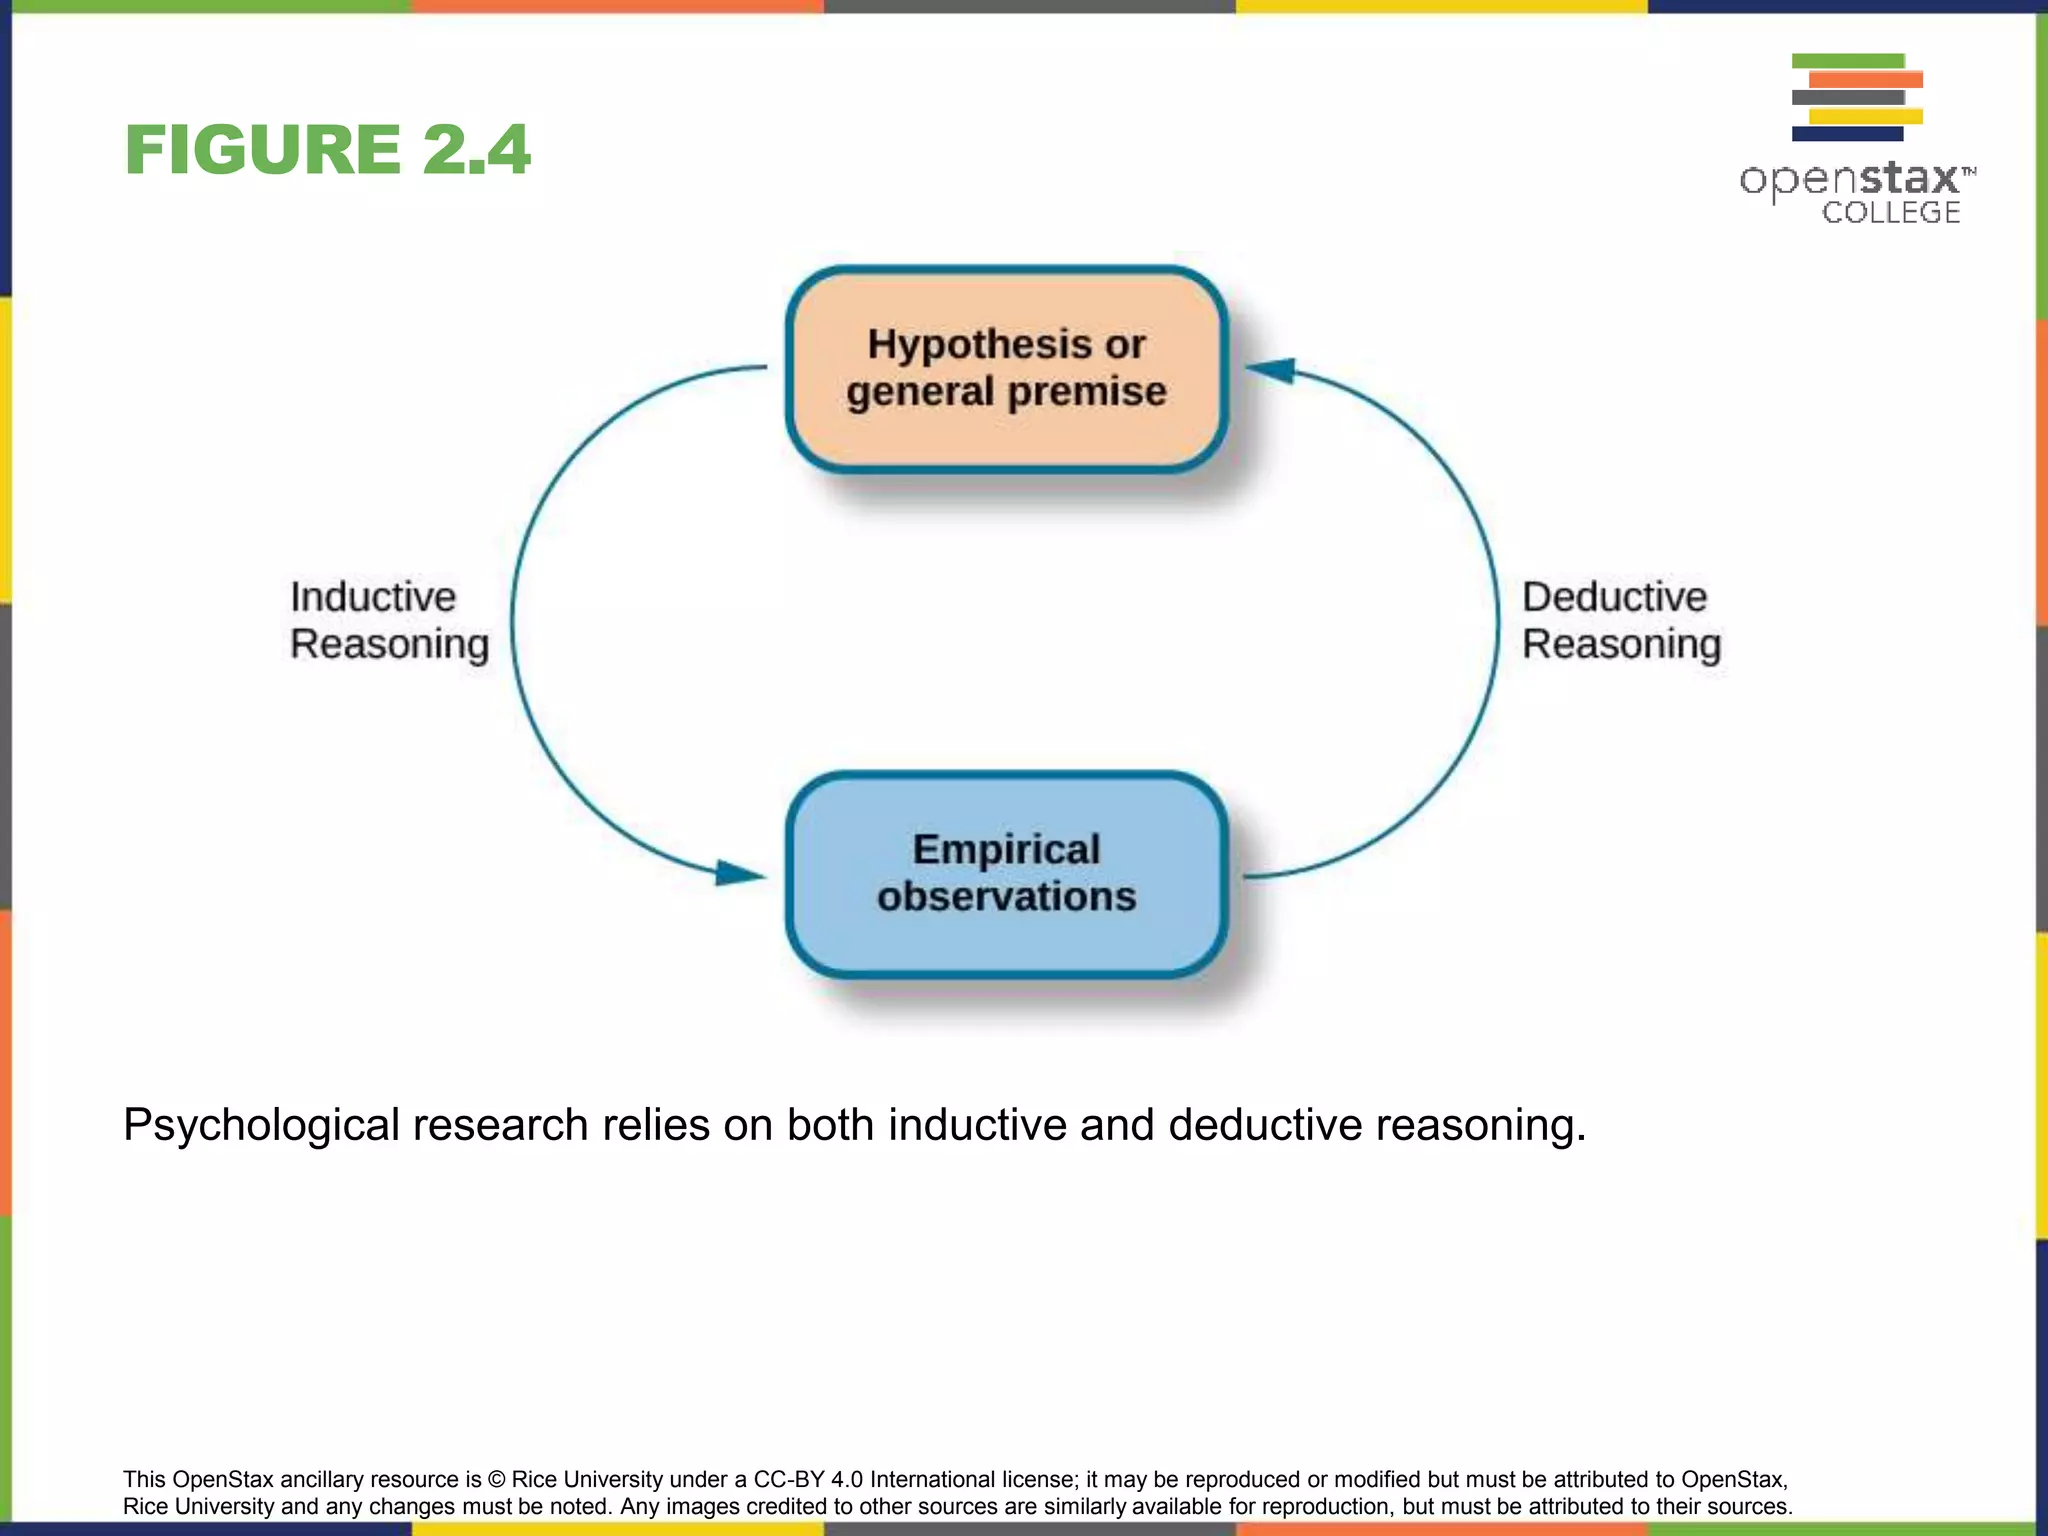
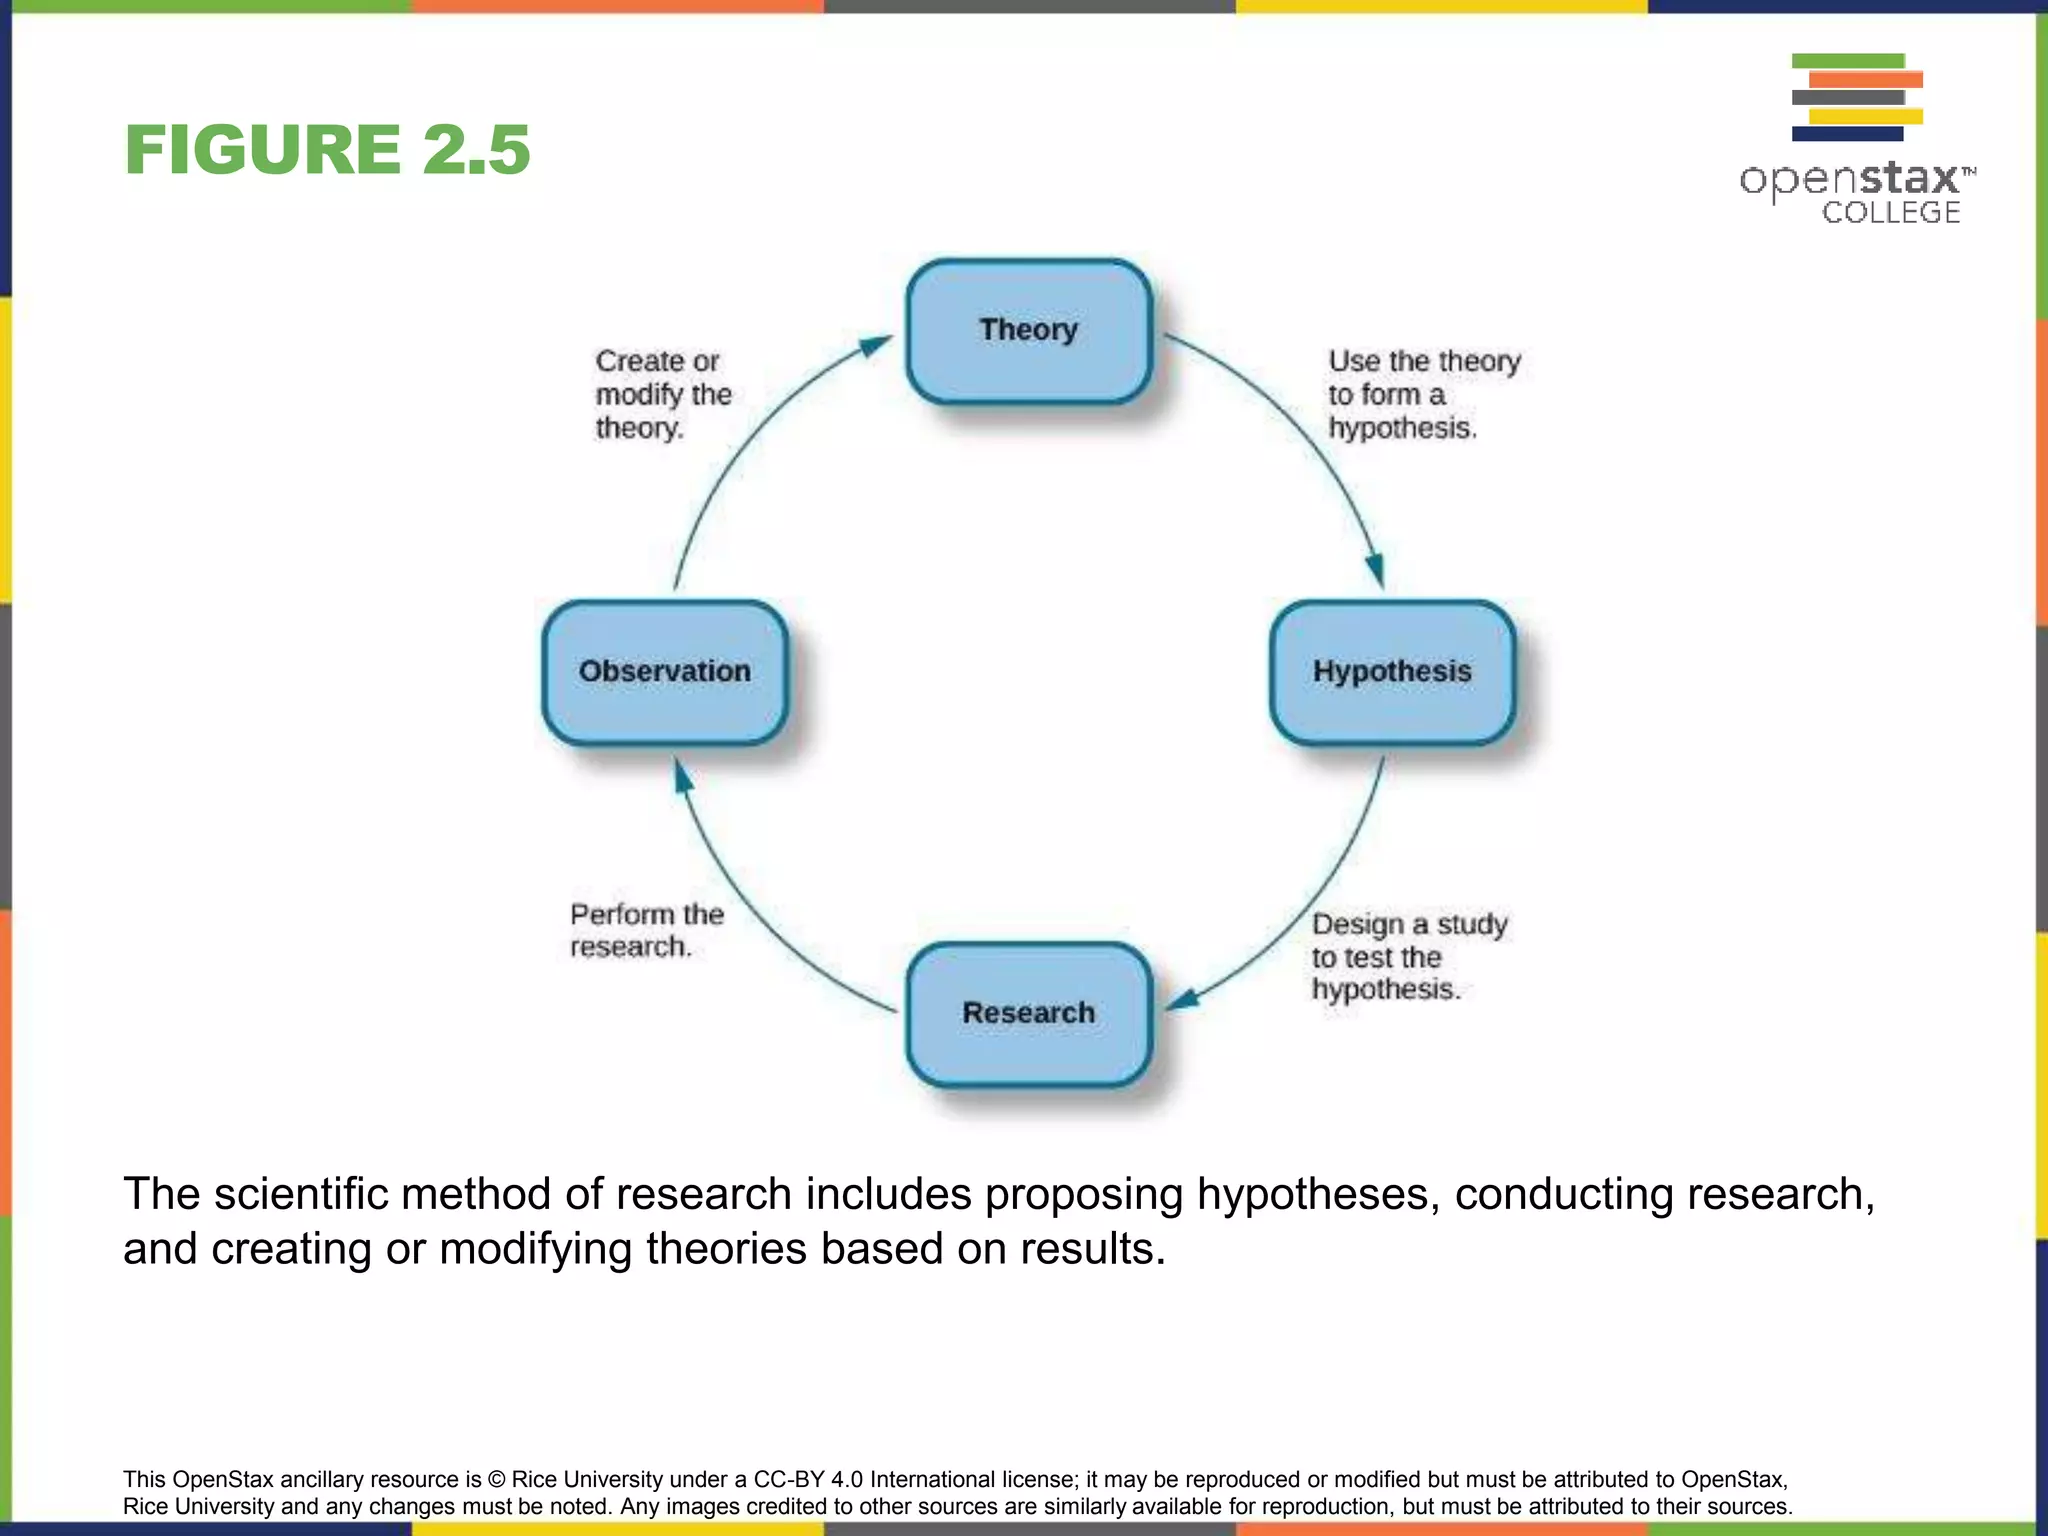
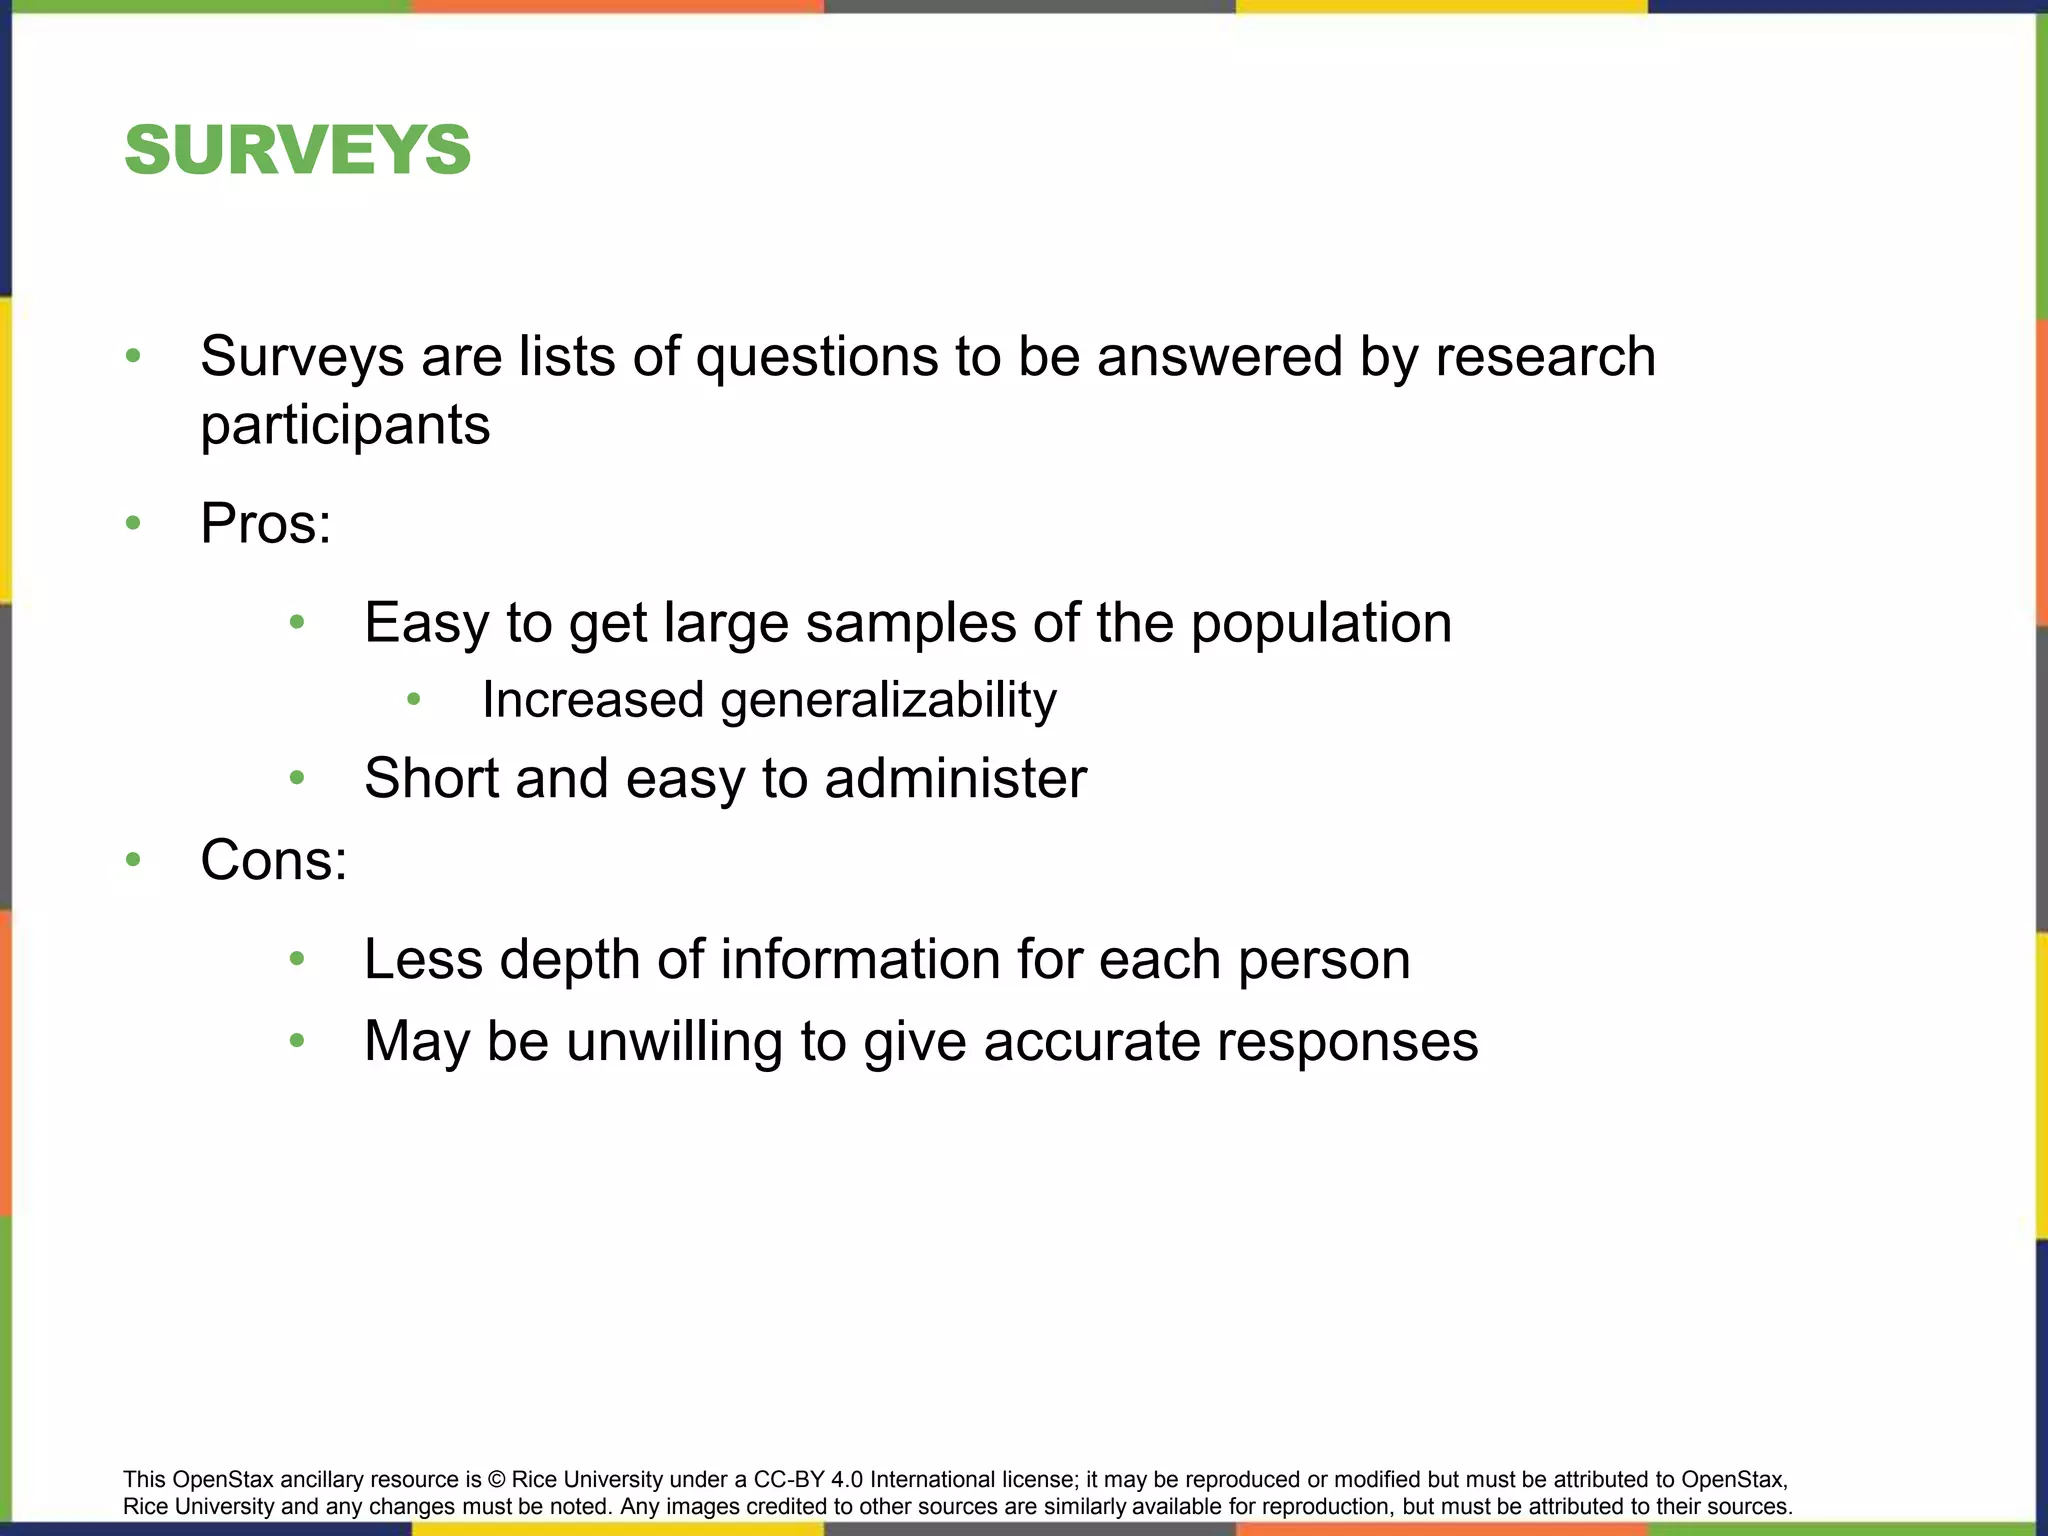
Chapter 2 PSYCHOLOGICAL RESEARCH
PowerPoint Image Slideshow
PSYCHOLOGY
This OpenStax ancillary resource is © Rice University under a CC-BY 4.0 International license; it may be reproduced or modified but must be attributed to OpenStax,
Rice University and any changes must be noted. Any images credited to other sources are similarly available for reproduction, but must be attributed to their sources.
WHY IS RESEARCH IMPORTANT?
Learning outcomes:
• Explain how scientific research address questions about behavior
• Apply the scientific method to questions about behavior by
generating hypotheses and designing a study to test their
hypothesis.
This OpenStax ancillary resource is © Rice University under a CC-BY 4.0 International license; it may be reproduced or modified but must be attributed to OpenStax,
Rice University and any changes must be noted. Any images credited to other sources are similarly available for reproduction, but must be attributed to their sources.
USE OF RESEARCH INFORMATION
How is research information used?
• Public policy (D.A.R.E., educational standards, sanitation, taxes,
etc)
• Personal decisions (medical decisions, parenting practices,
majors/job selection)
Need to differentiate between
• Facts: observable realities; and
• Opinions: personal judgements, conclusions or attitudes that may
or may not be accurate
This OpenStax ancillary resource is © Rice University under a CC-BY 4.0 International license; it may be reproduced or modified but must be attributed to OpenStax,
Rice University and any changes must be noted. Any images credited to other sources are similarly available for reproduction, but must be attributed to their sources.
CRITICAL THINKING
Critical thinking
a) Systematically evaluating information to reach
reasonable conclusions best supported by evidence
Three steps in becoming a skilled critical thinker
1. “What am I being asked to believe or accept?”
2. “What evidence is provided to support the claim?”
3. “What are the most reasonable conclusions?”
This OpenStax ancillary resource is © Rice University under a CC-BY 4.0 International license; it may be reproduced or modified but must be attributed to OpenStax,
Rice University and any changes must be noted. Any images credited to other sources are similarly available for reproduction, but must be attributed to their sources.
How does television content impact children’s behavior? (credit: modification of work by
“antisocialtory”/Flickr)
FIGURE 2.1
This OpenStax ancillary resource is © Rice University under a CC-BY 4.0 International license; it may be reproduced or modified but must be attributed to OpenStax,
Rice University and any changes must be noted. Any images credited to other sources are similarly available for reproduction, but must be attributed to their sources.
THE PROCESS OF SCIENTIFIC RESEARCH
The scientific method uses both
Inductive reasoning: empirical observations lead to new ideas
And
Deductive reasoning: ideas are tested against the empirical world
This OpenStax ancillary resource is © Rice University under a CC-BY 4.0 International license; it may be reproduced or modified but must be attributed to OpenStax,
Rice University and any changes must be noted. Any images credited to other sources are similarly available for reproduction, but must be attributed to their sources.
Psychological research relies on both inductive and deductive reasoning.
FIGURE 2.4
This OpenStax ancillary resource is © Rice University under a CC-BY 4.0 International license; it may be reproduced or modified but must be attributed to OpenStax,
Rice University and any changes must be noted. Any images credited to other sources are similarly available for reproduction, but must be attributed to their sources.
The scientific method of research includes proposing hypotheses, conducting research,
and creating or modifying theories based on results.
FIGURE 2.5
https://courses.vcu.edu/PHY-rhg/astron/html/mod/006/index.html
This OpenStax ancillary resource is © Rice University under a CC-BY 4.0 International license; it may be reproduced or modified but must be attributed to OpenStax,
Rice University and any changes must be noted. Any images credited to other sources are similarly available for reproduction, but must be attributed to their sources.
SCIENTIFIC METHOD
Important criteria when generating hypotheses:
Falsifiable: capable of being shown to be incorrect
- Statements can be disproven with just one example
This Photo by Unknown Author is licensed under CC BY
This OpenStax ancillary resource is © Rice University under a CC-BY 4.0 International license; it may be reproduced or modified but must be attributed to OpenStax,
Rice University and any changes must be noted. Any images credited to other sources are similarly available for reproduction, but must be attributed to their sources.
Many of the specifics of (a) Freud's theories, such as (b) his division of the mind into id,
ego, and superego, have fallen out of favor in recent decades because they are not
falsifiable. In broader strokes, his views set the stage for much of psychological thinking
today, such as the unconscious nature of the majority of psychological processes.
FIGURE 2.6
This OpenStax ancillary resource is © Rice University under a CC-BY 4.0 International license; it may be reproduced or modified but must be attributed to OpenStax, Rice University and any
changes must be noted. Any images credited to other sources are similarly available for reproduction, but must be attributed to their sources.
2.2 APPROACHES TO RESEARCH
Now that we understand the scientific method and how to generate
hypotheses, we need to understand how to test them.
Psychology uses many different types of studies to test hypotheses about
behavior:
How data is collected:
• Clinical or Case studies
• Natural Observation
• Surveys
• Archival research
• Longitudinal
• Cross sectional
This OpenStax ancillary resource is © Rice University under a CC-BY 4.0 International license; it may be reproduced or modified but must be attributed to OpenStax,
Rice University and any changes must be noted. Any images credited to other sources are similarly available for reproduction, but must be attributed to their sources.
CLINICAL/CASE STUDIES
• Observational research
• Focuses on one person or just a few individuals.
• Pros
• can gather lots of information
• Deep understanding of individual
• Cons
• Generalizing to larger population is limited
• Example: Apple, Inc.
• Yoffie, David B., and Eric Baldwin. "Apple Inc. in 2018." Harvard Business
School Case 718-439, May 2018
This Photo by Unknown Author is licensed under CC BY-SA
This OpenStax ancillary resource is © Rice University under a CC-BY 4.0 International license; it may be reproduced or modified but must be attributed to OpenStax,
Rice University and any changes must be noted. Any images credited to other sources are similarly available for reproduction, but must be attributed to their sources.
NATURALISTIC OBSERVATION
• Observing behavior in its naturally occurring context
• Pros:
• lots of information as it takes place
• Helpful in generating new ideas
• High ecological validity
• Cons:
• People may change behavior when they know they are
being observed
• Observer bias
This OpenStax ancillary resource is © Rice University under a CC-BY 4.0 International license; it may be reproduced or modified but must be attributed to OpenStax,
Rice University and any changes must be noted. Any images credited to other sources are similarly available for reproduction, but must be attributed to their sources.
Seeing a police car behind you would probably affect your driving behavior. (credit:
Michael Gil)
FIGURE 2.7
This OpenStax ancillary resource is © Rice University under a CC-BY 4.0 International license; it may be reproduced or modified but must be attributed to OpenStax,
Rice University and any changes must be noted. Any images credited to other sources are similarly available for reproduction, but must be attributed to their sources.
PRESCHOOL STUDY
This Photo by Unknown Author is licensed under CC BY-NC-ND
This OpenStax ancillary resource is © Rice University under a CC-BY 4.0 International license; it may be reproduced or modified but must be attributed to OpenStax,
Rice University and any changes must be noted. Any images credited to other sources are similarly available for reproduction, but must be attributed to their sources.
SURVEYS
• Surveys are lists of questions to be answered by research
participants
• Pros:
• Easy to get large samples of the population
• Increased generalizability
• Short and easy to administer
• Cons:
• Less depth of information for each person
• May be unwilling to give accurate responses
This OpenStax ancillary resource is © Rice University under a CC-BY 4.0 International license; it may be reproduced or modified but must be attributed to OpenStax,
Rice University and any changes must be noted. Any images credited to other sources are similarly available for reproduction, but must be attributed to their sources.
Surveys can be administered in a number of ways, including electronically administered
research, like the survey shown here. (credit: Robert Nyman)
FIGURE 2.9
This OpenStax ancillary resource is © Rice University under a CC-BY 4.0 International license; it may be reproduced or modified but must be attributed to OpenStax,
Rice University and any changes must be noted. Any images credited to other sources are similarly available for reproduction, but must be attributed to their sources.
A researcher doing archival research examines records, whether archived as a (a)
hardcopy or (b) electronically. (credit “paper files”: modification of work by “Newtown
graffiti”/Flickr; “computer”: modification of work by INPIVIC Family/Flickr)
FIGURE 2.10
This OpenStax ancillary resource is © Rice University under a CC-BY 4.0 International license; it may be reproduced or modified but must be attributed to OpenStax,
Rice University and any changes must be noted. Any images credited to other sources are similarly available for reproduction, but must be attributed to their sources.
RESEARCH METHODS CONTINUED
This OpenStax ancillary resource is © Rice University under a CC-BY 4.0 International license; it may be reproduced or modified but must be attributed to OpenStax,
Rice University and any changes must be noted. Any images credited to other sources are similarly available for reproduction, but must be attributed to their sources.
Longitudinal research like the CPS-3 help us to better understand how smoking is
associated with cancer and other diseases. (credit: CDC/Debora Cartagena)
FIGURE 2.11
LONGITUDINAL AND CROSS-SECTIONAL
STUDIES
Longitudinal Studies
• The same people are studied twice or more over a substantial period of
time – see line in red below
Cross-Sectional Studies
• People of different ages are studied at same point in time- see line in blue
2010 2020 2030
Age
50
40
30
20
10
Year
CORRELATIONAL STUDIES
The primary goal of studies that use correlational designs is to
determine how variables are related to one another.
A correlation is the association between two variables.
• The direction and strength of a correlation is measured by a
statistic called the correlation coefficient.
• Direction = positive or negative (-1 to 1)
• Strength = absolute value (closer to 1 = stronger correlation, 0 =
no correlation)
This OpenStax ancillary resource is © Rice University under a CC-BY 4.0 International license; it may be reproduced or modified but must be attributed to OpenStax,
Rice University and any changes must be noted. Any images credited to other sources are similarly available for reproduction, but must be attributed to their sources.
Scatterplots are a graphical view of the strength and direction of correlations. The stronger
the correlation, the closer the data points are to a straight line. In these examples, we see
that there is (a) a positive correlation between weight and height, (b) a negative correlation
between tiredness and hours of sleep, and (c) no correlation between shoe size and hours of
sleep.
FIGURE 2.12
This OpenStax ancillary resource is © Rice University under a CC-BY 4.0 International license; it may be reproduced or modified but must be attributed to OpenStax,
Rice University and any changes must be noted. Any images credited to other sources are similarly available for reproduction, but must be attributed to their sources.
CORRELATIONS
CORRELATION DOES NOT INDICATE CAUSATION
This OpenStax ancillary resource is © Rice University under a CC-BY 4.0 International license; it may be reproduced or modified but must be attributed to OpenStax,
Rice University and any changes must be noted. Any images credited to other sources are similarly available for reproduction, but must be attributed to their sources.
Does eating cereal really cause someone to be a healthy weight? (credit: Tim Skillern)
FIGURE 2.13
This OpenStax ancillary resource is © Rice University under a CC-BY 4.0 International license; it may be reproduced or modified but must be attributed to OpenStax,
Rice University and any changes must be noted. Any images credited to other sources are similarly available for reproduction, but must be attributed to their sources.
Many people believe that a full moon makes people behave oddly. (credit: Cory Zanker)
Example of Illusory correlation: false correlations
These occur when people believe there are relationships between two
things when there is no relationship!
FIGURE 2.14
This OpenStax ancillary resource is © Rice University under a CC-BY 4.0 International license; it may be reproduced or modified but must be attributed to OpenStax,
Rice University and any changes must be noted. Any images credited to other sources are similarly available for reproduction, but must be attributed to their sources.
Seeing behavior like this right after a
child watches violent television
programming might lead you to
hypothesize that viewing violent
television programming leads to an
increase in the display of violent
behaviors. (credit: Emran Kassim)
FIGURE 2.15
This OpenStax ancillary resource is © Rice University under a CC-BY 4.0 International license; it may be reproduced or modified but must be attributed to OpenStax,
Rice University and any changes must be noted. Any images credited to other sources are similarly available for reproduction, but must be attributed to their sources.
CAUSALITY: CONDUCTING EXPERIMENTS AND
USING THE DATA
Experiments has a precise design and implementation in the scientific
context and can allow for determination of causality.
• 1. Create a specific hypothesis to test
• Example: watching violent TV leads to violent behavior in
kids
• 2. Must design a controlled experimental study
• Experimental group gets the manipulation
• Control group does not
This OpenStax ancillary resource is © Rice University under a CC-BY 4.0 International license; it may be reproduced or modified but must be attributed to OpenStax,
Rice University and any changes must be noted. Any images credited to other sources are similarly available for reproduction, but must be attributed to their sources.
Providing the control group with a placebo treatment protects against bias caused by
expectancy. (credit: Elaine and Arthur Shapiro)
FIGURE 2.16
This OpenStax ancillary resource is © Rice University under a CC-BY 4.0 International license; it may be reproduced or modified but must be attributed to OpenStax,
Rice University and any changes must be noted. Any images credited to other sources are similarly available for reproduction, but must be attributed to their sources.
In an experiment, manipulations of the independent variable are expected to result in
changes in the dependent variable. (credit “automatic weapon”: modification of work by
Daniel Oines; credit “toy gun”: modification of work by Emran Kassim)
FIGURE 2.17
EXPERIMENTAL DESIGN
Relies on random assignment, a procedure in which each participant
has an equal chance of being assigned to any group within an
experiment
31
This OpenStax ancillary resource is © Rice University under a CC-BY 4.0 International license; it may be reproduced or modified but must be attributed to OpenStax,
Rice University and any changes must be noted. Any images credited to other sources are similarly available for reproduction, but must be attributed to their sources.
Researchers may work with (a) a large population or (b) a sample group that is a
subset of the larger population. (credit “crowd”: modification of work by James Cridland;
credit “students”: modification of work by Laurie Sullivan)
FIGURE 2.18
This OpenStax ancillary resource is © Rice University under a CC-BY 4.0 International license; it may be reproduced or modified but must be attributed to OpenStax,
Rice University and any changes must be noted. Any images credited to other sources are similarly available for reproduction, but must be attributed to their sources.
RELIABILITY AND VALIDITY
Reliability refer to the ability to consistently produce a given result
Validity refers to the extent to which a given instrument or tool
accurately measure what it’s supposed to measure
2.4 ETHICS
• Ethical Guidelines for Researchers
• Researchers must protect participants from physical and
psychological harm.
• Researchers must obtain informed consent from participants
before their involvement in a study.
• The use of deception in research must be justified and cause
no harm.
• Participants’ privacy (anonymity) must be maintained.
This OpenStax ancillary resource is © Rice University under a CC-BY 4.0 International license; it may be reproduced or modified but must be attributed to OpenStax,
Rice University and any changes must be noted. Any images credited to other sources are similarly available for reproduction, but must be attributed to their sources.
An institution’s IRB meets regularly to review experimental proposals that involve
human participants. (credit: modification of work by Lowndes Area Knowledge
Exchange (LAKE)/Flickr)
FIGURE 2.20

Chapter 2 Psychological Research

  • 1.
    Chapter 2 PSYCHOLOGICALRESEARCH PowerPoint Image Slideshow PSYCHOLOGY
  • 2.
    This OpenStax ancillaryresource is © Rice University under a CC-BY 4.0 International license; it may be reproduced or modified but must be attributed to OpenStax, Rice University and any changes must be noted. Any images credited to other sources are similarly available for reproduction, but must be attributed to their sources. WHY IS RESEARCH IMPORTANT? Learning outcomes: • Explain how scientific research address questions about behavior • Apply the scientific method to questions about behavior by generating hypotheses and designing a study to test their hypothesis.
  • 3.
    This OpenStax ancillaryresource is © Rice University under a CC-BY 4.0 International license; it may be reproduced or modified but must be attributed to OpenStax, Rice University and any changes must be noted. Any images credited to other sources are similarly available for reproduction, but must be attributed to their sources. USE OF RESEARCH INFORMATION How is research information used? • Public policy (D.A.R.E., educational standards, sanitation, taxes, etc) • Personal decisions (medical decisions, parenting practices, majors/job selection) Need to differentiate between • Facts: observable realities; and • Opinions: personal judgements, conclusions or attitudes that may or may not be accurate
  • 4.
    This OpenStax ancillaryresource is © Rice University under a CC-BY 4.0 International license; it may be reproduced or modified but must be attributed to OpenStax, Rice University and any changes must be noted. Any images credited to other sources are similarly available for reproduction, but must be attributed to their sources. CRITICAL THINKING Critical thinking a) Systematically evaluating information to reach reasonable conclusions best supported by evidence Three steps in becoming a skilled critical thinker 1. “What am I being asked to believe or accept?” 2. “What evidence is provided to support the claim?” 3. “What are the most reasonable conclusions?”
  • 5.
    This OpenStax ancillaryresource is © Rice University under a CC-BY 4.0 International license; it may be reproduced or modified but must be attributed to OpenStax, Rice University and any changes must be noted. Any images credited to other sources are similarly available for reproduction, but must be attributed to their sources. How does television content impact children’s behavior? (credit: modification of work by “antisocialtory”/Flickr) FIGURE 2.1
  • 6.
    This OpenStax ancillaryresource is © Rice University under a CC-BY 4.0 International license; it may be reproduced or modified but must be attributed to OpenStax, Rice University and any changes must be noted. Any images credited to other sources are similarly available for reproduction, but must be attributed to their sources. THE PROCESS OF SCIENTIFIC RESEARCH The scientific method uses both Inductive reasoning: empirical observations lead to new ideas And Deductive reasoning: ideas are tested against the empirical world
  • 7.
    This OpenStax ancillaryresource is © Rice University under a CC-BY 4.0 International license; it may be reproduced or modified but must be attributed to OpenStax, Rice University and any changes must be noted. Any images credited to other sources are similarly available for reproduction, but must be attributed to their sources. Psychological research relies on both inductive and deductive reasoning. FIGURE 2.4
  • 8.
    This OpenStax ancillaryresource is © Rice University under a CC-BY 4.0 International license; it may be reproduced or modified but must be attributed to OpenStax, Rice University and any changes must be noted. Any images credited to other sources are similarly available for reproduction, but must be attributed to their sources. The scientific method of research includes proposing hypotheses, conducting research, and creating or modifying theories based on results. FIGURE 2.5
  • 9.
    https://courses.vcu.edu/PHY-rhg/astron/html/mod/006/index.html This OpenStax ancillaryresource is © Rice University under a CC-BY 4.0 International license; it may be reproduced or modified but must be attributed to OpenStax, Rice University and any changes must be noted. Any images credited to other sources are similarly available for reproduction, but must be attributed to their sources. SCIENTIFIC METHOD Important criteria when generating hypotheses: Falsifiable: capable of being shown to be incorrect - Statements can be disproven with just one example This Photo by Unknown Author is licensed under CC BY
  • 10.
    This OpenStax ancillaryresource is © Rice University under a CC-BY 4.0 International license; it may be reproduced or modified but must be attributed to OpenStax, Rice University and any changes must be noted. Any images credited to other sources are similarly available for reproduction, but must be attributed to their sources. Many of the specifics of (a) Freud's theories, such as (b) his division of the mind into id, ego, and superego, have fallen out of favor in recent decades because they are not falsifiable. In broader strokes, his views set the stage for much of psychological thinking today, such as the unconscious nature of the majority of psychological processes. FIGURE 2.6
  • 11.
    This OpenStax ancillaryresource is © Rice University under a CC-BY 4.0 International license; it may be reproduced or modified but must be attributed to OpenStax, Rice University and any changes must be noted. Any images credited to other sources are similarly available for reproduction, but must be attributed to their sources. 2.2 APPROACHES TO RESEARCH Now that we understand the scientific method and how to generate hypotheses, we need to understand how to test them. Psychology uses many different types of studies to test hypotheses about behavior: How data is collected: • Clinical or Case studies • Natural Observation • Surveys • Archival research • Longitudinal • Cross sectional
  • 12.
    This OpenStax ancillaryresource is © Rice University under a CC-BY 4.0 International license; it may be reproduced or modified but must be attributed to OpenStax, Rice University and any changes must be noted. Any images credited to other sources are similarly available for reproduction, but must be attributed to their sources. CLINICAL/CASE STUDIES • Observational research • Focuses on one person or just a few individuals. • Pros • can gather lots of information • Deep understanding of individual • Cons • Generalizing to larger population is limited • Example: Apple, Inc. • Yoffie, David B., and Eric Baldwin. "Apple Inc. in 2018." Harvard Business School Case 718-439, May 2018 This Photo by Unknown Author is licensed under CC BY-SA
  • 13.
    This OpenStax ancillaryresource is © Rice University under a CC-BY 4.0 International license; it may be reproduced or modified but must be attributed to OpenStax, Rice University and any changes must be noted. Any images credited to other sources are similarly available for reproduction, but must be attributed to their sources. NATURALISTIC OBSERVATION • Observing behavior in its naturally occurring context • Pros: • lots of information as it takes place • Helpful in generating new ideas • High ecological validity • Cons: • People may change behavior when they know they are being observed • Observer bias
  • 14.
    This OpenStax ancillaryresource is © Rice University under a CC-BY 4.0 International license; it may be reproduced or modified but must be attributed to OpenStax, Rice University and any changes must be noted. Any images credited to other sources are similarly available for reproduction, but must be attributed to their sources. Seeing a police car behind you would probably affect your driving behavior. (credit: Michael Gil) FIGURE 2.7
  • 15.
    This OpenStax ancillaryresource is © Rice University under a CC-BY 4.0 International license; it may be reproduced or modified but must be attributed to OpenStax, Rice University and any changes must be noted. Any images credited to other sources are similarly available for reproduction, but must be attributed to their sources. PRESCHOOL STUDY This Photo by Unknown Author is licensed under CC BY-NC-ND
  • 16.
    This OpenStax ancillaryresource is © Rice University under a CC-BY 4.0 International license; it may be reproduced or modified but must be attributed to OpenStax, Rice University and any changes must be noted. Any images credited to other sources are similarly available for reproduction, but must be attributed to their sources. SURVEYS • Surveys are lists of questions to be answered by research participants • Pros: • Easy to get large samples of the population • Increased generalizability • Short and easy to administer • Cons: • Less depth of information for each person • May be unwilling to give accurate responses
  • 17.
    This OpenStax ancillaryresource is © Rice University under a CC-BY 4.0 International license; it may be reproduced or modified but must be attributed to OpenStax, Rice University and any changes must be noted. Any images credited to other sources are similarly available for reproduction, but must be attributed to their sources. Surveys can be administered in a number of ways, including electronically administered research, like the survey shown here. (credit: Robert Nyman) FIGURE 2.9
  • 18.
    This OpenStax ancillaryresource is © Rice University under a CC-BY 4.0 International license; it may be reproduced or modified but must be attributed to OpenStax, Rice University and any changes must be noted. Any images credited to other sources are similarly available for reproduction, but must be attributed to their sources. A researcher doing archival research examines records, whether archived as a (a) hardcopy or (b) electronically. (credit “paper files”: modification of work by “Newtown graffiti”/Flickr; “computer”: modification of work by INPIVIC Family/Flickr) FIGURE 2.10
  • 19.
    This OpenStax ancillaryresource is © Rice University under a CC-BY 4.0 International license; it may be reproduced or modified but must be attributed to OpenStax, Rice University and any changes must be noted. Any images credited to other sources are similarly available for reproduction, but must be attributed to their sources. RESEARCH METHODS CONTINUED
  • 20.
    This OpenStax ancillaryresource is © Rice University under a CC-BY 4.0 International license; it may be reproduced or modified but must be attributed to OpenStax, Rice University and any changes must be noted. Any images credited to other sources are similarly available for reproduction, but must be attributed to their sources. Longitudinal research like the CPS-3 help us to better understand how smoking is associated with cancer and other diseases. (credit: CDC/Debora Cartagena) FIGURE 2.11
  • 21.
    LONGITUDINAL AND CROSS-SECTIONAL STUDIES LongitudinalStudies • The same people are studied twice or more over a substantial period of time – see line in red below Cross-Sectional Studies • People of different ages are studied at same point in time- see line in blue 2010 2020 2030 Age 50 40 30 20 10 Year
  • 22.
    CORRELATIONAL STUDIES The primarygoal of studies that use correlational designs is to determine how variables are related to one another. A correlation is the association between two variables. • The direction and strength of a correlation is measured by a statistic called the correlation coefficient. • Direction = positive or negative (-1 to 1) • Strength = absolute value (closer to 1 = stronger correlation, 0 = no correlation)
  • 23.
    This OpenStax ancillaryresource is © Rice University under a CC-BY 4.0 International license; it may be reproduced or modified but must be attributed to OpenStax, Rice University and any changes must be noted. Any images credited to other sources are similarly available for reproduction, but must be attributed to their sources. Scatterplots are a graphical view of the strength and direction of correlations. The stronger the correlation, the closer the data points are to a straight line. In these examples, we see that there is (a) a positive correlation between weight and height, (b) a negative correlation between tiredness and hours of sleep, and (c) no correlation between shoe size and hours of sleep. FIGURE 2.12
  • 24.
    This OpenStax ancillaryresource is © Rice University under a CC-BY 4.0 International license; it may be reproduced or modified but must be attributed to OpenStax, Rice University and any changes must be noted. Any images credited to other sources are similarly available for reproduction, but must be attributed to their sources. CORRELATIONS CORRELATION DOES NOT INDICATE CAUSATION
  • 25.
    This OpenStax ancillaryresource is © Rice University under a CC-BY 4.0 International license; it may be reproduced or modified but must be attributed to OpenStax, Rice University and any changes must be noted. Any images credited to other sources are similarly available for reproduction, but must be attributed to their sources. Does eating cereal really cause someone to be a healthy weight? (credit: Tim Skillern) FIGURE 2.13
  • 26.
    This OpenStax ancillaryresource is © Rice University under a CC-BY 4.0 International license; it may be reproduced or modified but must be attributed to OpenStax, Rice University and any changes must be noted. Any images credited to other sources are similarly available for reproduction, but must be attributed to their sources. Many people believe that a full moon makes people behave oddly. (credit: Cory Zanker) Example of Illusory correlation: false correlations These occur when people believe there are relationships between two things when there is no relationship! FIGURE 2.14
  • 27.
    This OpenStax ancillaryresource is © Rice University under a CC-BY 4.0 International license; it may be reproduced or modified but must be attributed to OpenStax, Rice University and any changes must be noted. Any images credited to other sources are similarly available for reproduction, but must be attributed to their sources. Seeing behavior like this right after a child watches violent television programming might lead you to hypothesize that viewing violent television programming leads to an increase in the display of violent behaviors. (credit: Emran Kassim) FIGURE 2.15
  • 28.
    This OpenStax ancillaryresource is © Rice University under a CC-BY 4.0 International license; it may be reproduced or modified but must be attributed to OpenStax, Rice University and any changes must be noted. Any images credited to other sources are similarly available for reproduction, but must be attributed to their sources. CAUSALITY: CONDUCTING EXPERIMENTS AND USING THE DATA Experiments has a precise design and implementation in the scientific context and can allow for determination of causality. • 1. Create a specific hypothesis to test • Example: watching violent TV leads to violent behavior in kids • 2. Must design a controlled experimental study • Experimental group gets the manipulation • Control group does not
  • 29.
    This OpenStax ancillaryresource is © Rice University under a CC-BY 4.0 International license; it may be reproduced or modified but must be attributed to OpenStax, Rice University and any changes must be noted. Any images credited to other sources are similarly available for reproduction, but must be attributed to their sources. Providing the control group with a placebo treatment protects against bias caused by expectancy. (credit: Elaine and Arthur Shapiro) FIGURE 2.16
  • 30.
    This OpenStax ancillaryresource is © Rice University under a CC-BY 4.0 International license; it may be reproduced or modified but must be attributed to OpenStax, Rice University and any changes must be noted. Any images credited to other sources are similarly available for reproduction, but must be attributed to their sources. In an experiment, manipulations of the independent variable are expected to result in changes in the dependent variable. (credit “automatic weapon”: modification of work by Daniel Oines; credit “toy gun”: modification of work by Emran Kassim) FIGURE 2.17
  • 31.
    EXPERIMENTAL DESIGN Relies onrandom assignment, a procedure in which each participant has an equal chance of being assigned to any group within an experiment 31
  • 32.
    This OpenStax ancillaryresource is © Rice University under a CC-BY 4.0 International license; it may be reproduced or modified but must be attributed to OpenStax, Rice University and any changes must be noted. Any images credited to other sources are similarly available for reproduction, but must be attributed to their sources. Researchers may work with (a) a large population or (b) a sample group that is a subset of the larger population. (credit “crowd”: modification of work by James Cridland; credit “students”: modification of work by Laurie Sullivan) FIGURE 2.18
  • 33.
    This OpenStax ancillaryresource is © Rice University under a CC-BY 4.0 International license; it may be reproduced or modified but must be attributed to OpenStax, Rice University and any changes must be noted. Any images credited to other sources are similarly available for reproduction, but must be attributed to their sources. RELIABILITY AND VALIDITY Reliability refer to the ability to consistently produce a given result Validity refers to the extent to which a given instrument or tool accurately measure what it’s supposed to measure
  • 34.
    2.4 ETHICS • EthicalGuidelines for Researchers • Researchers must protect participants from physical and psychological harm. • Researchers must obtain informed consent from participants before their involvement in a study. • The use of deception in research must be justified and cause no harm. • Participants’ privacy (anonymity) must be maintained.
  • 35.
    This OpenStax ancillaryresource is © Rice University under a CC-BY 4.0 International license; it may be reproduced or modified but must be attributed to OpenStax, Rice University and any changes must be noted. Any images credited to other sources are similarly available for reproduction, but must be attributed to their sources. An institution’s IRB meets regularly to review experimental proposals that involve human participants. (credit: modification of work by Lowndes Area Knowledge Exchange (LAKE)/Flickr) FIGURE 2.20