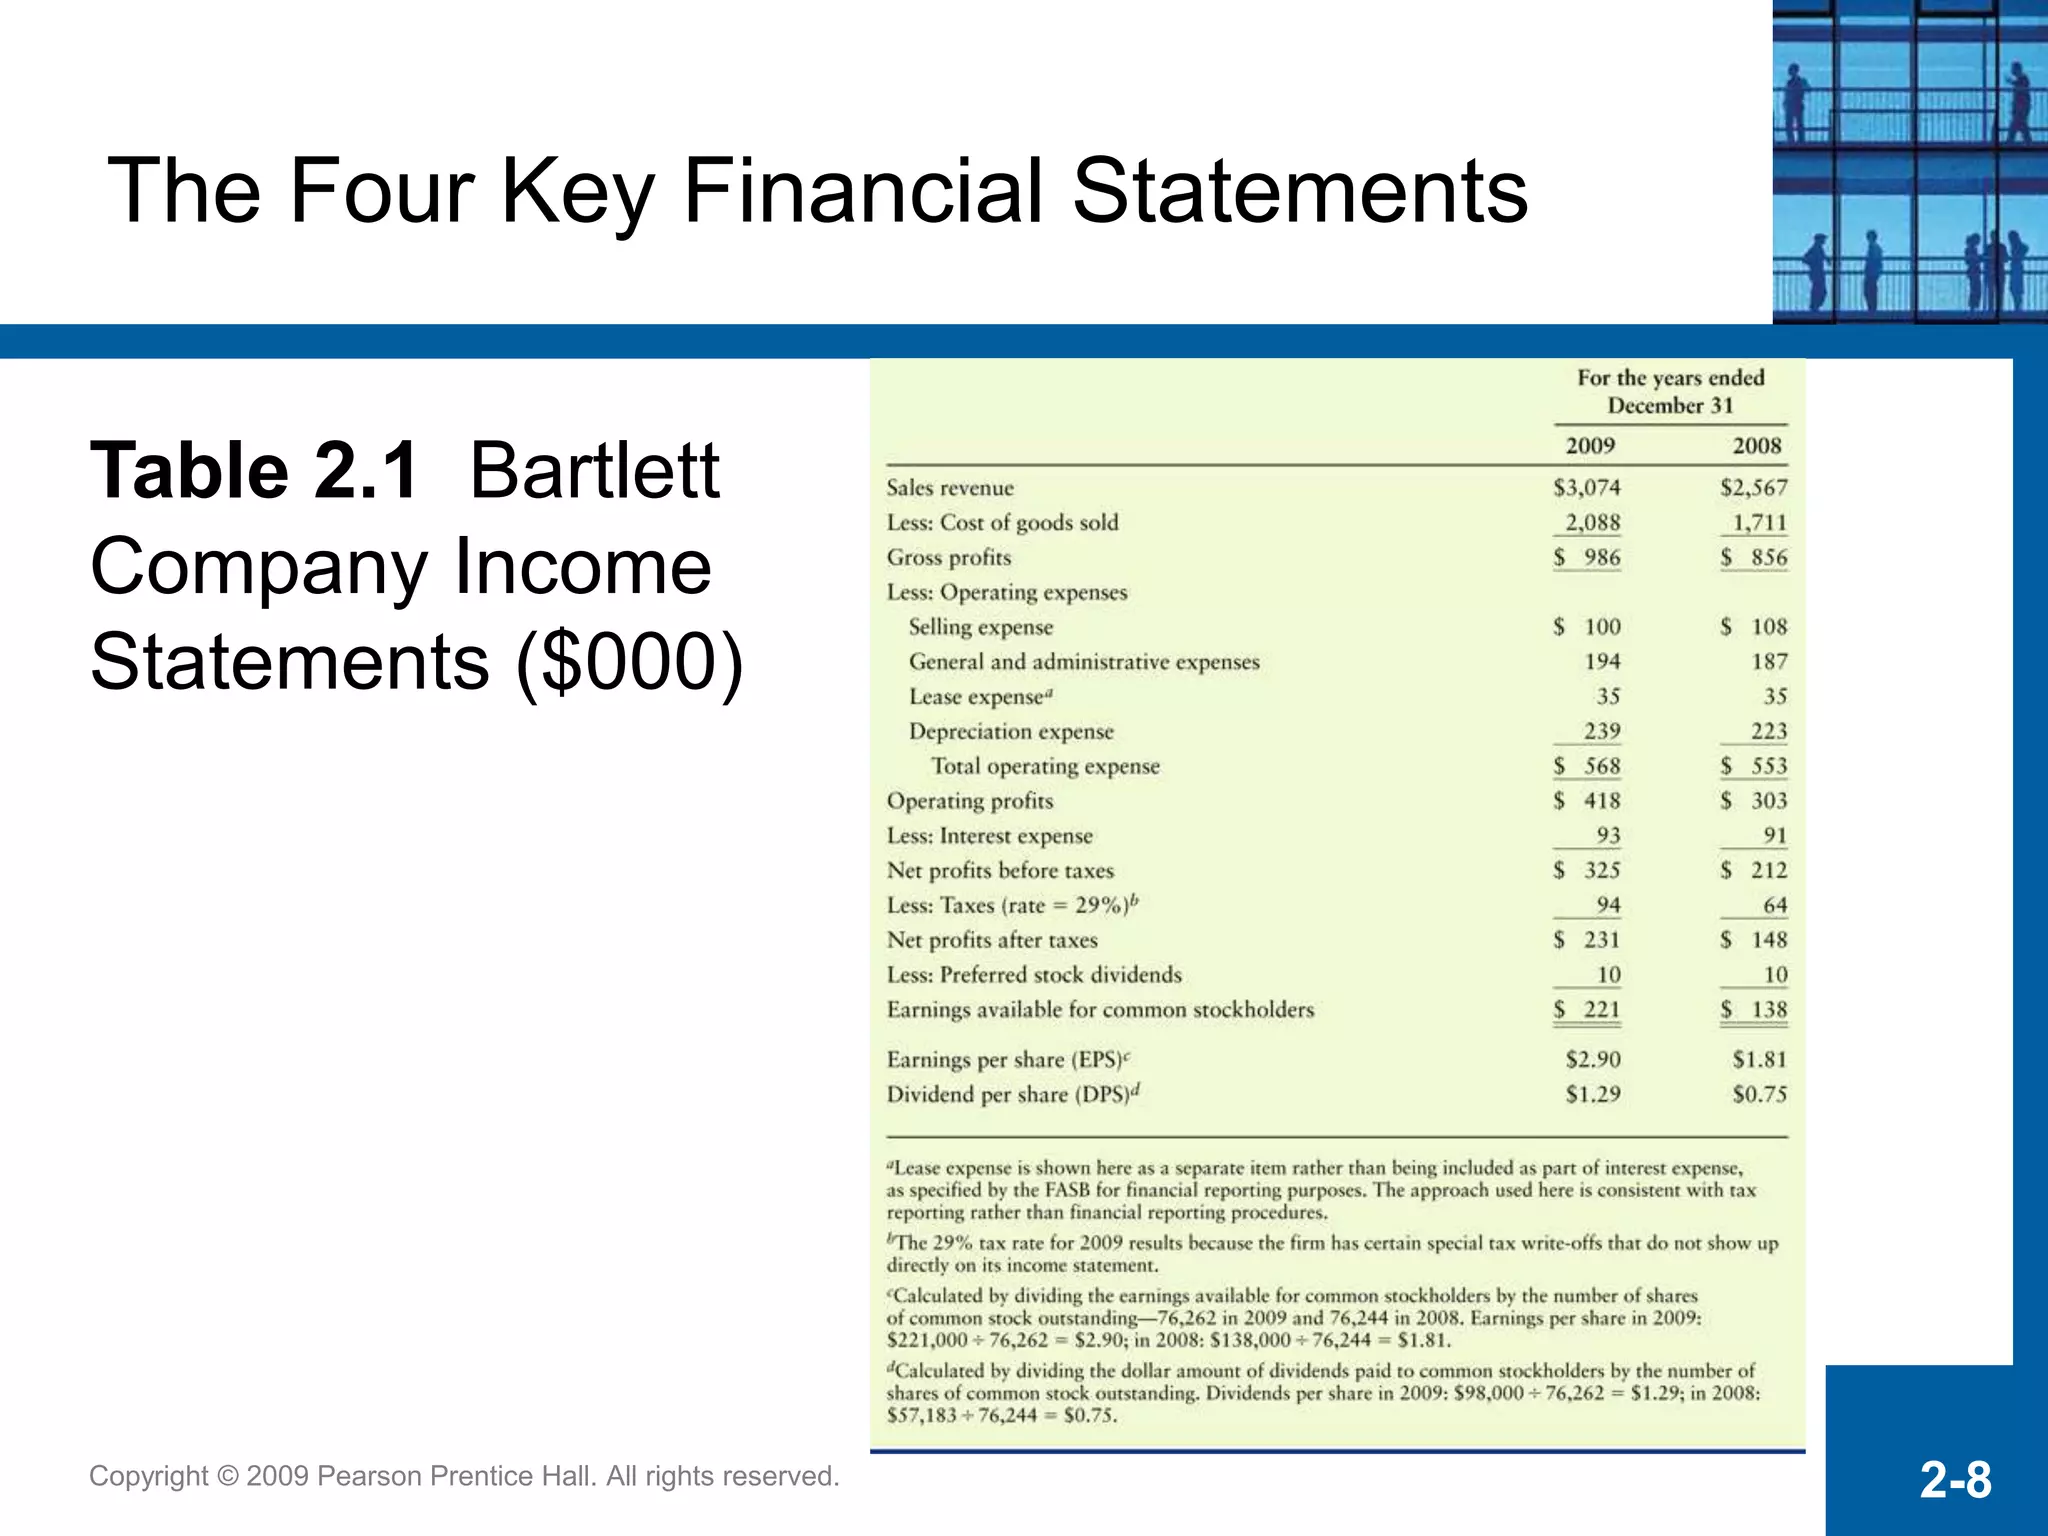
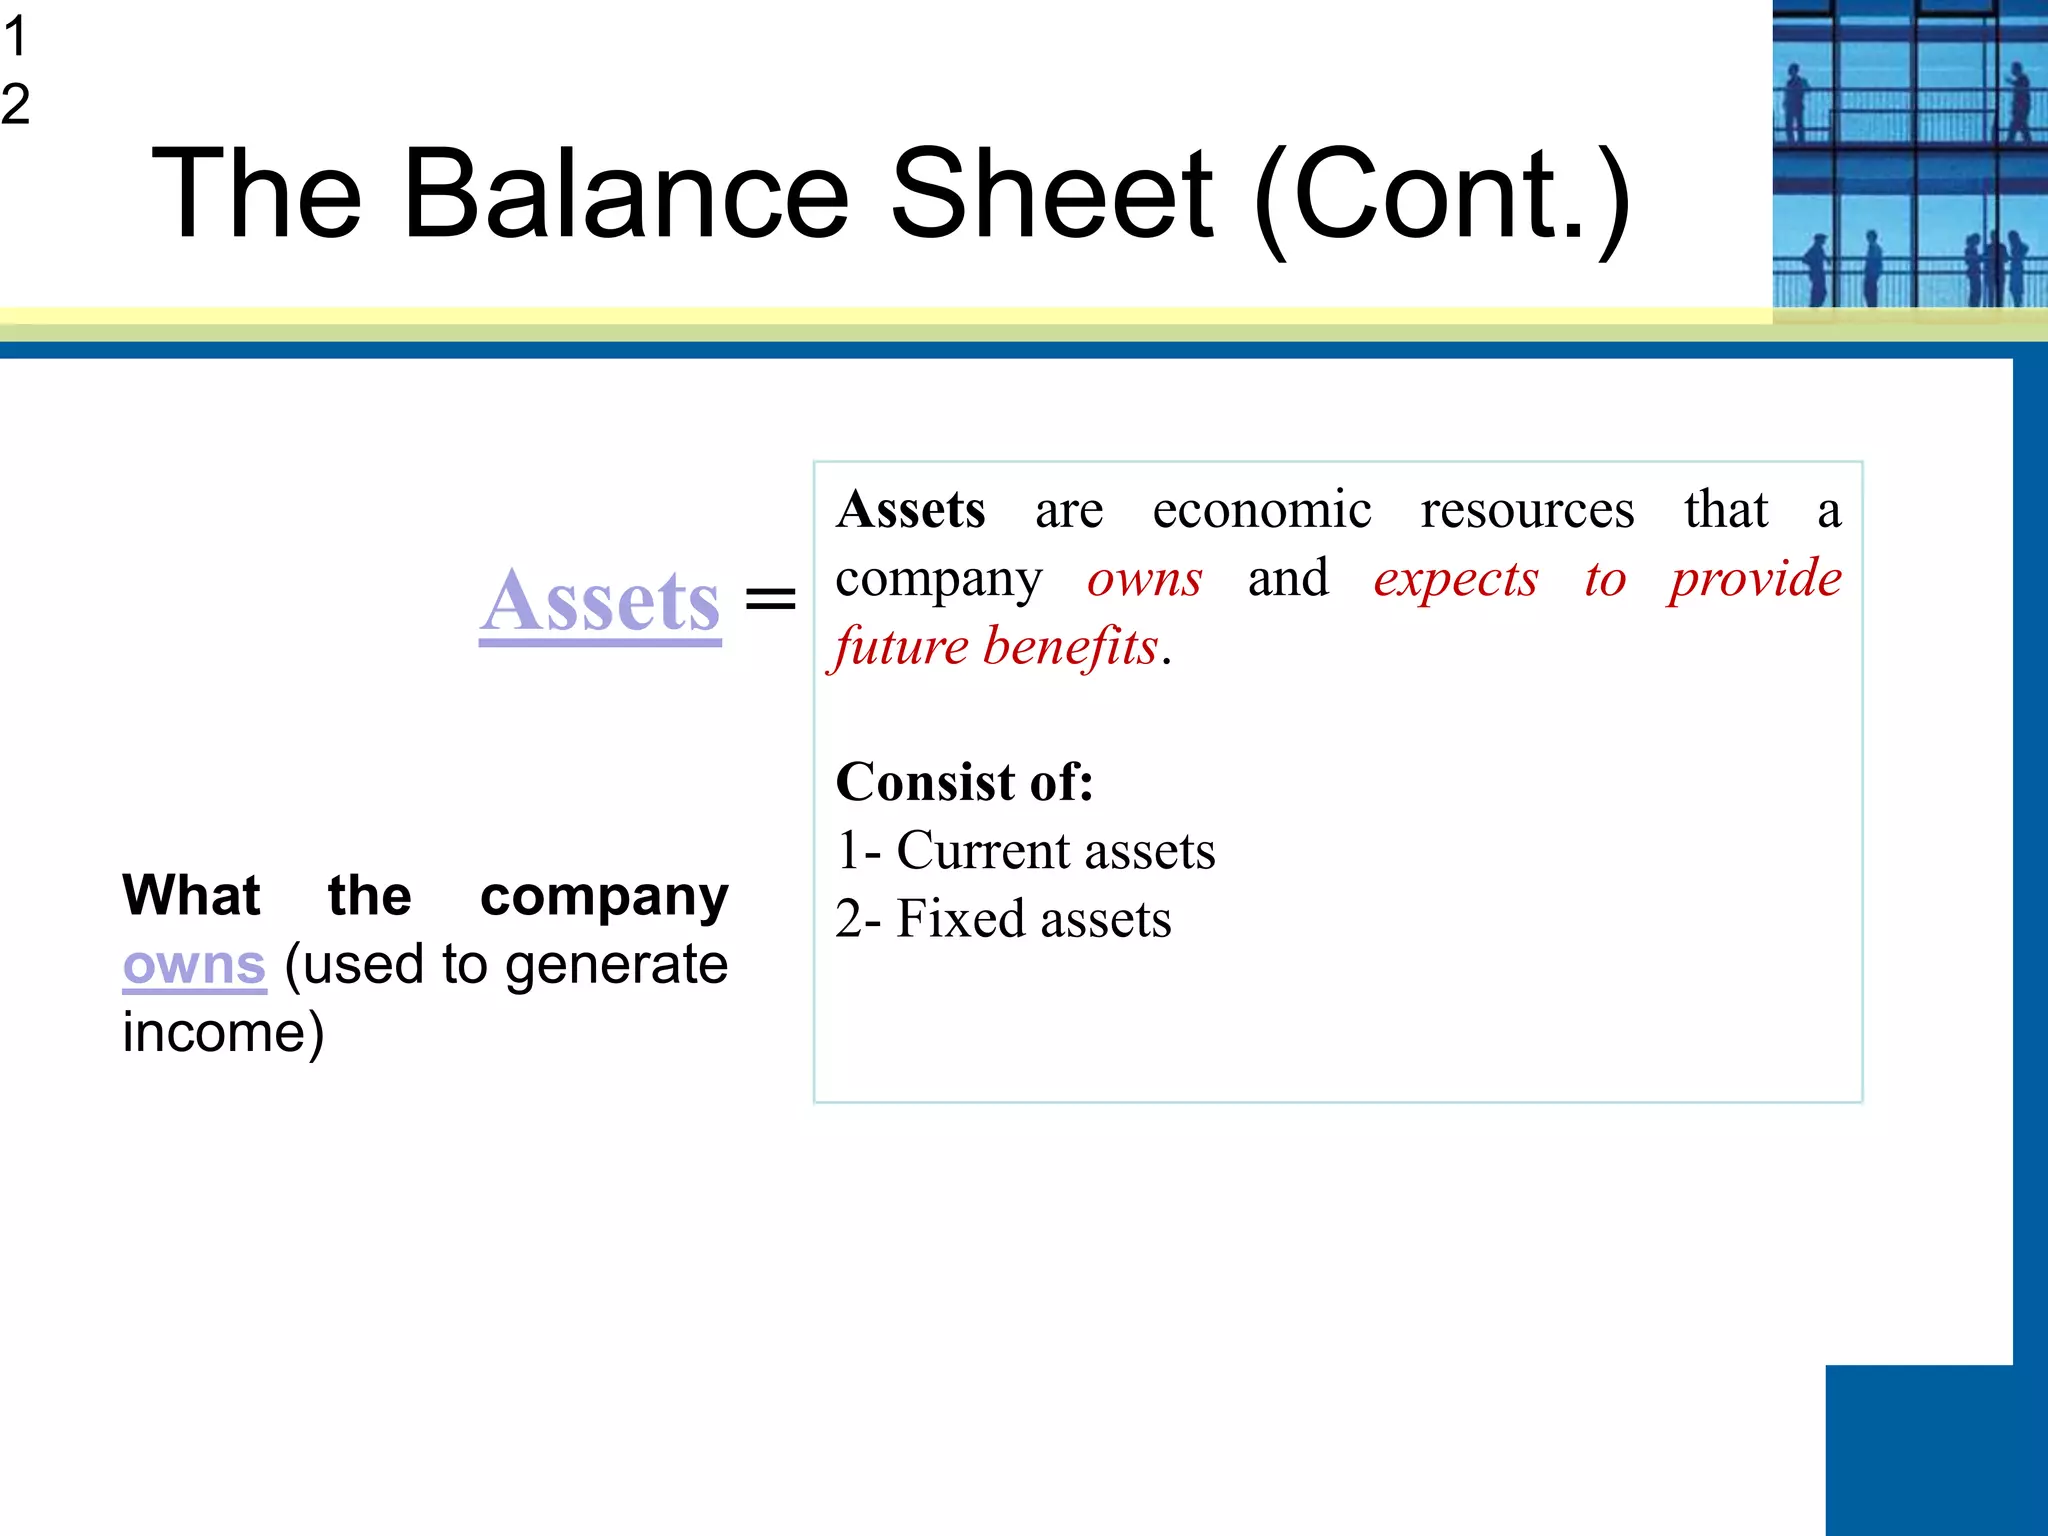
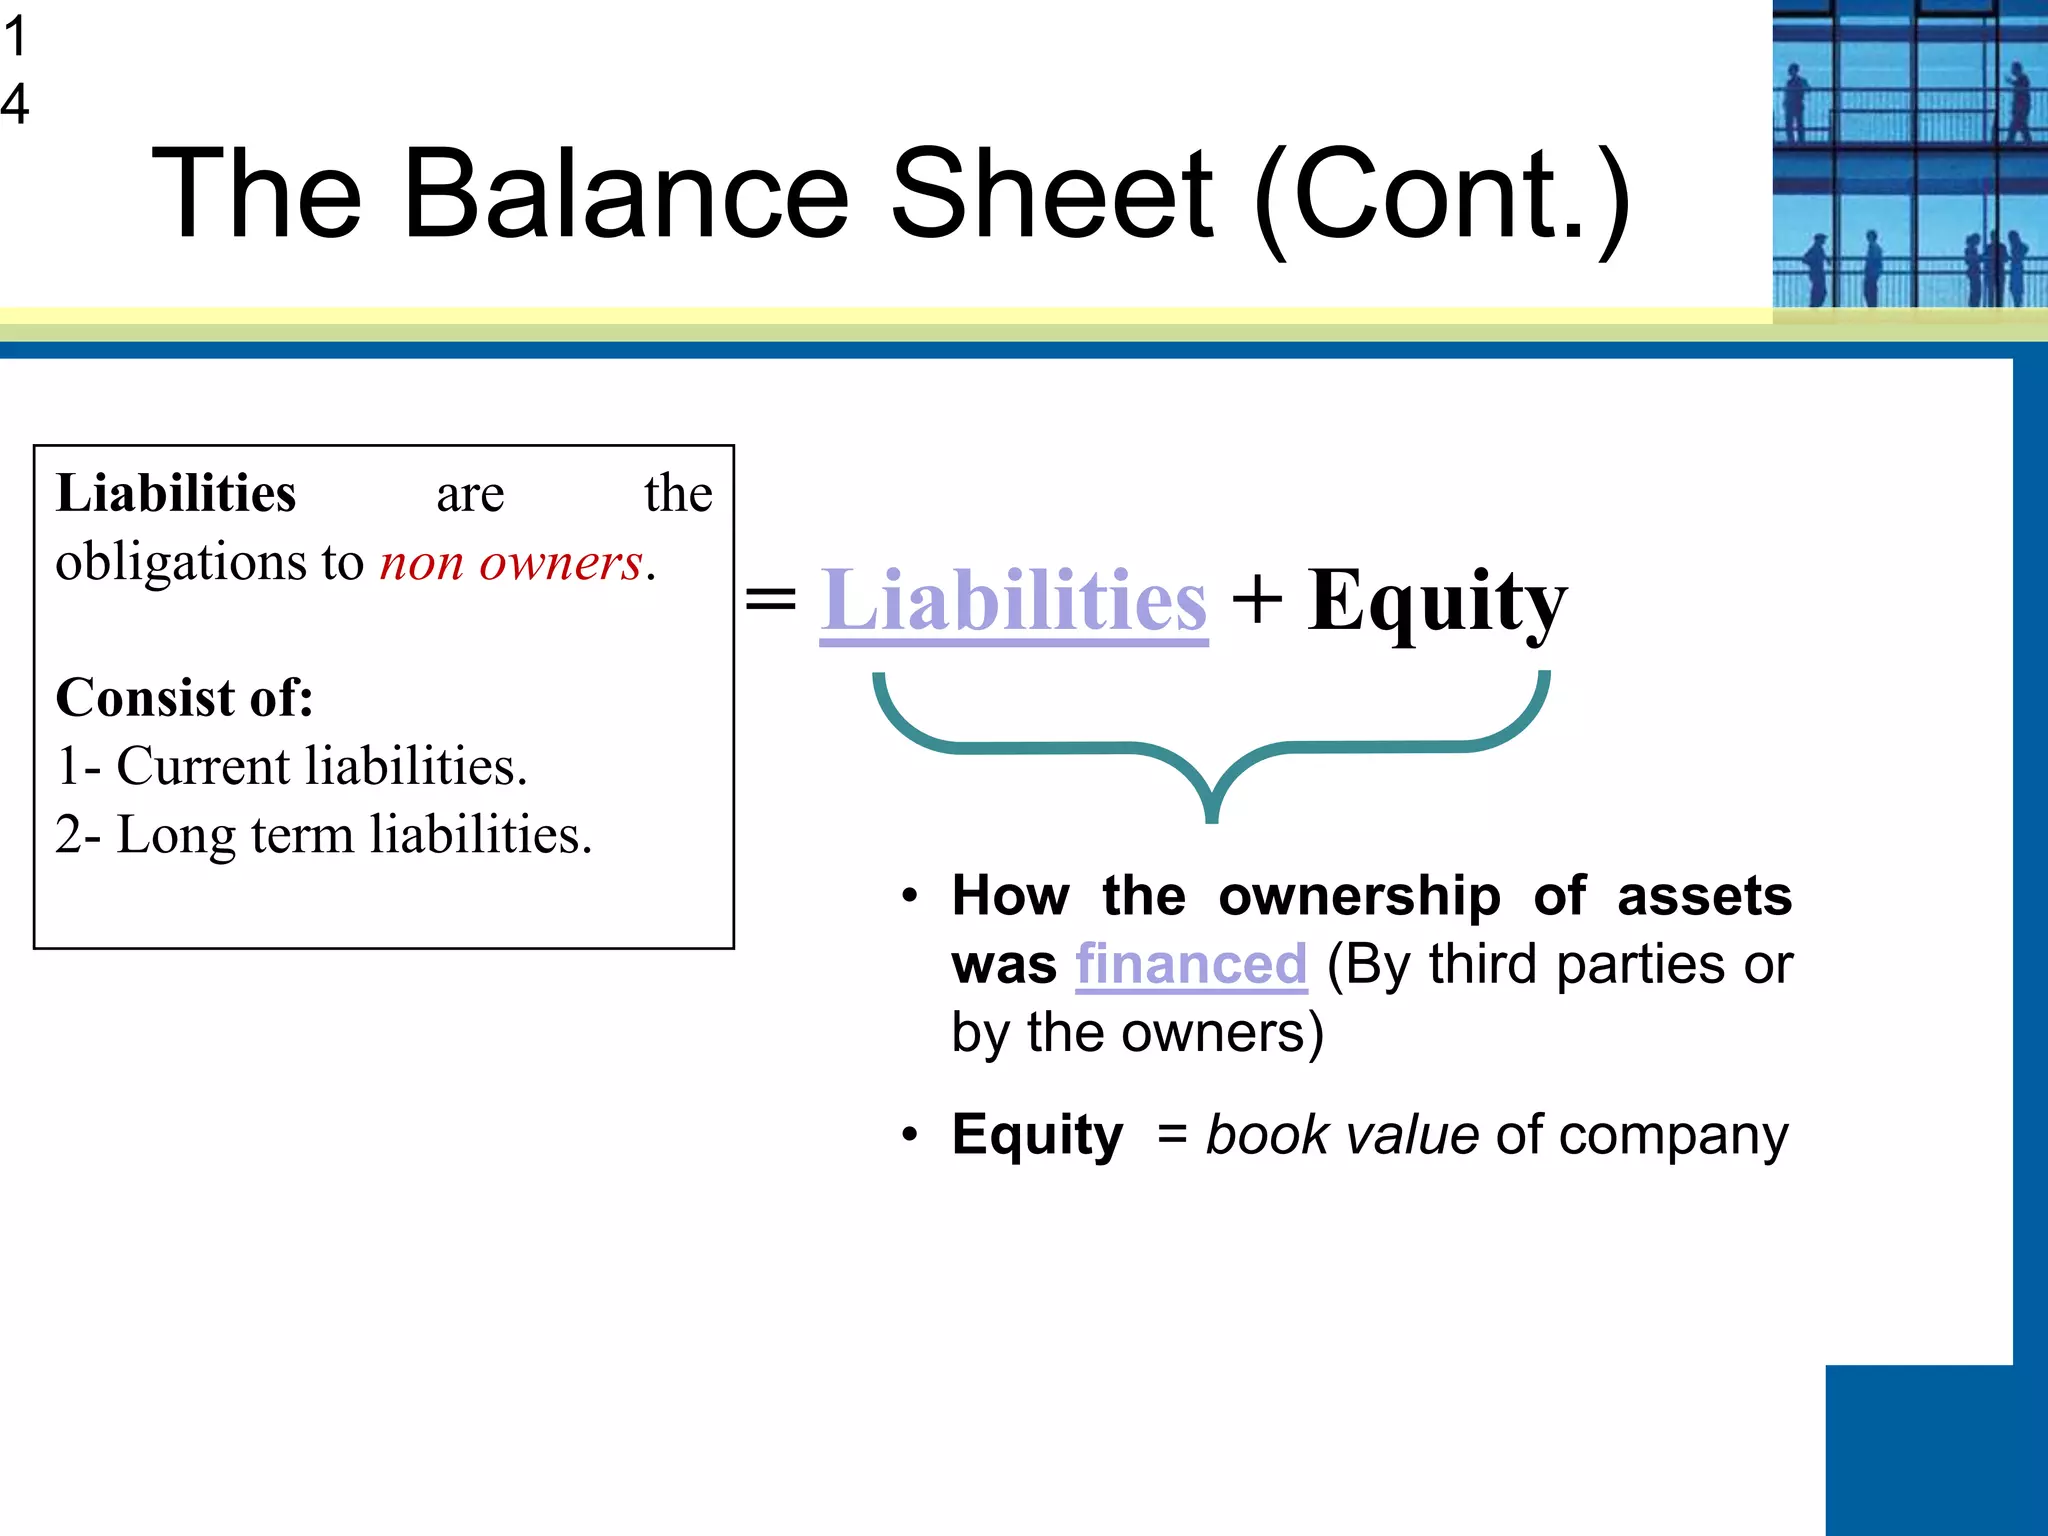
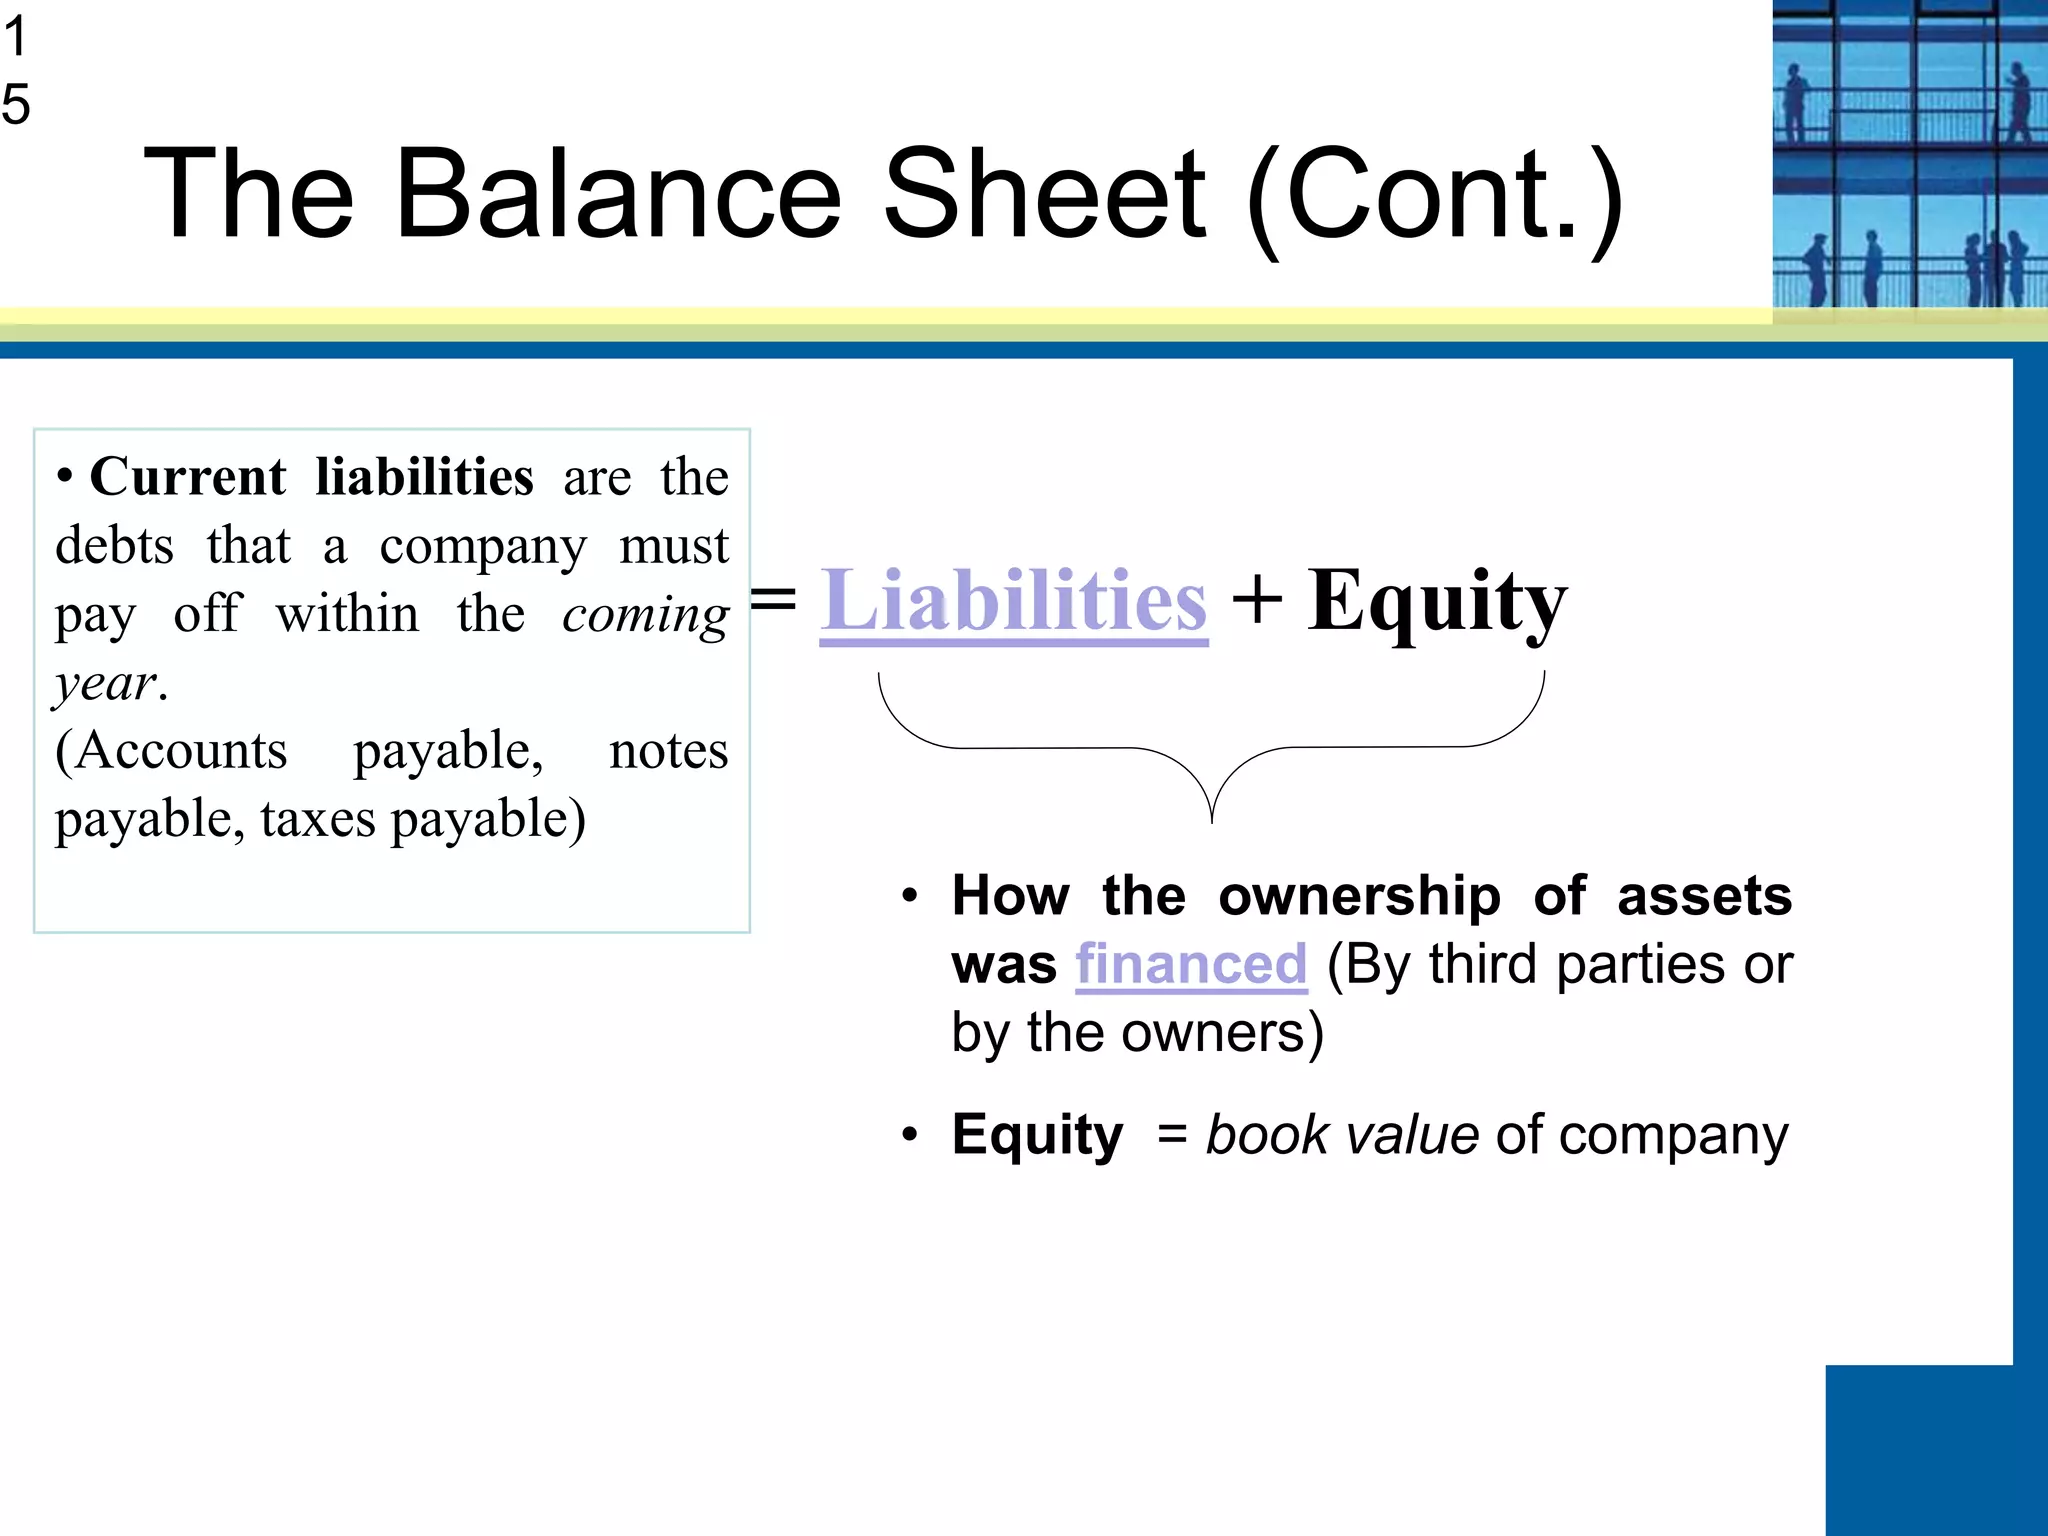
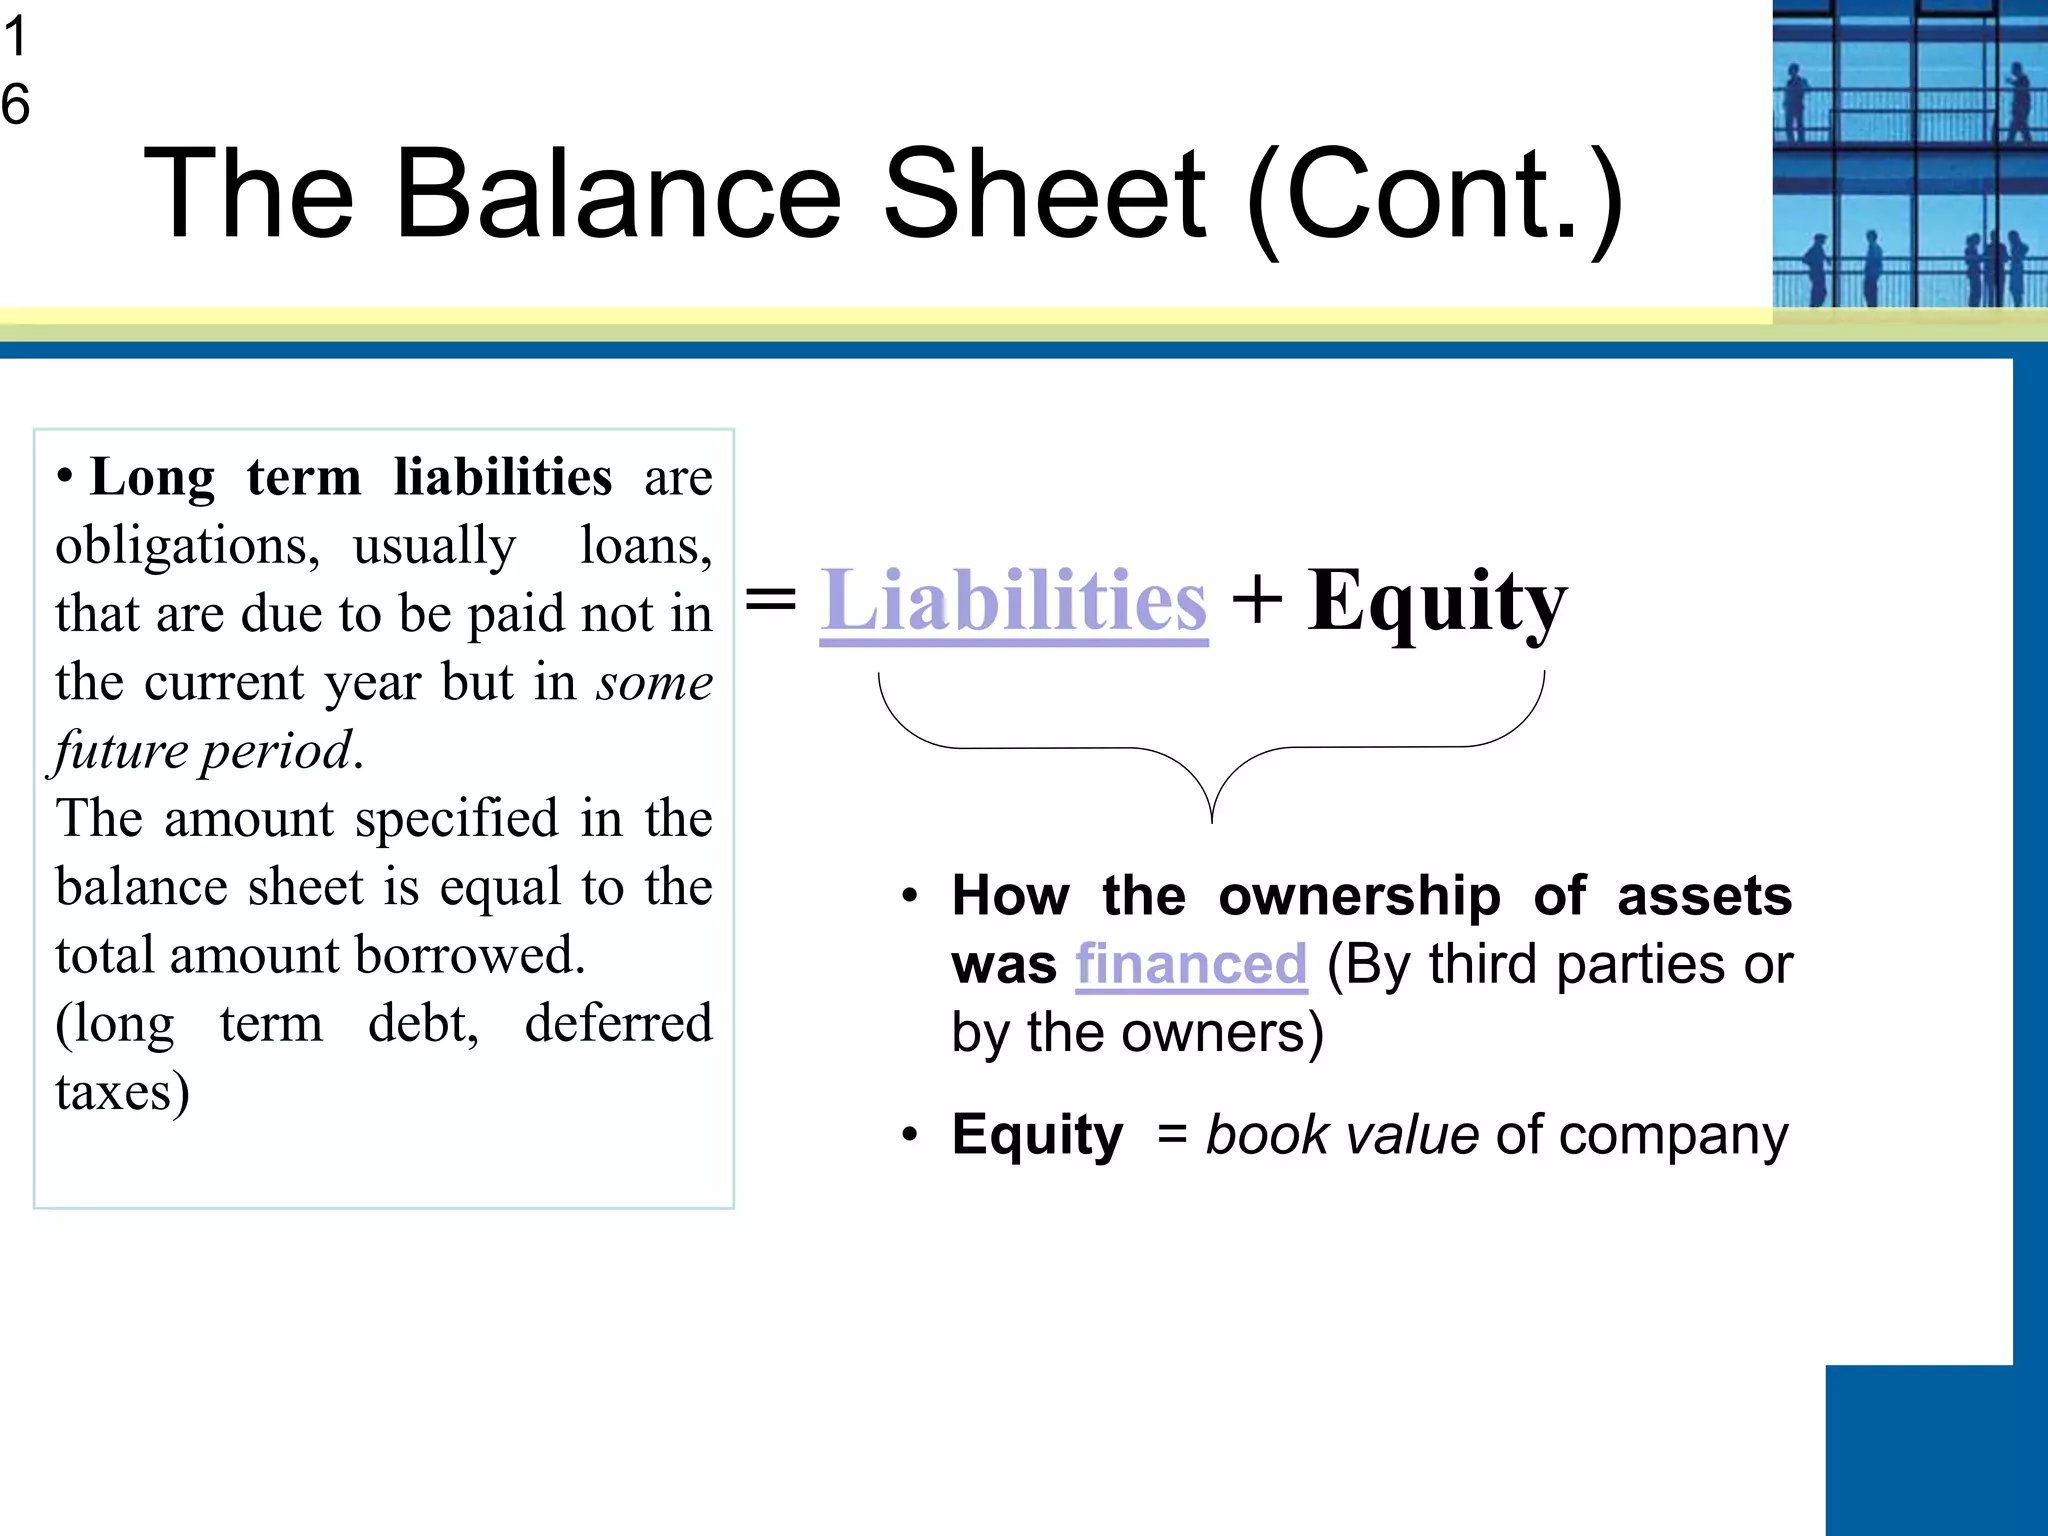
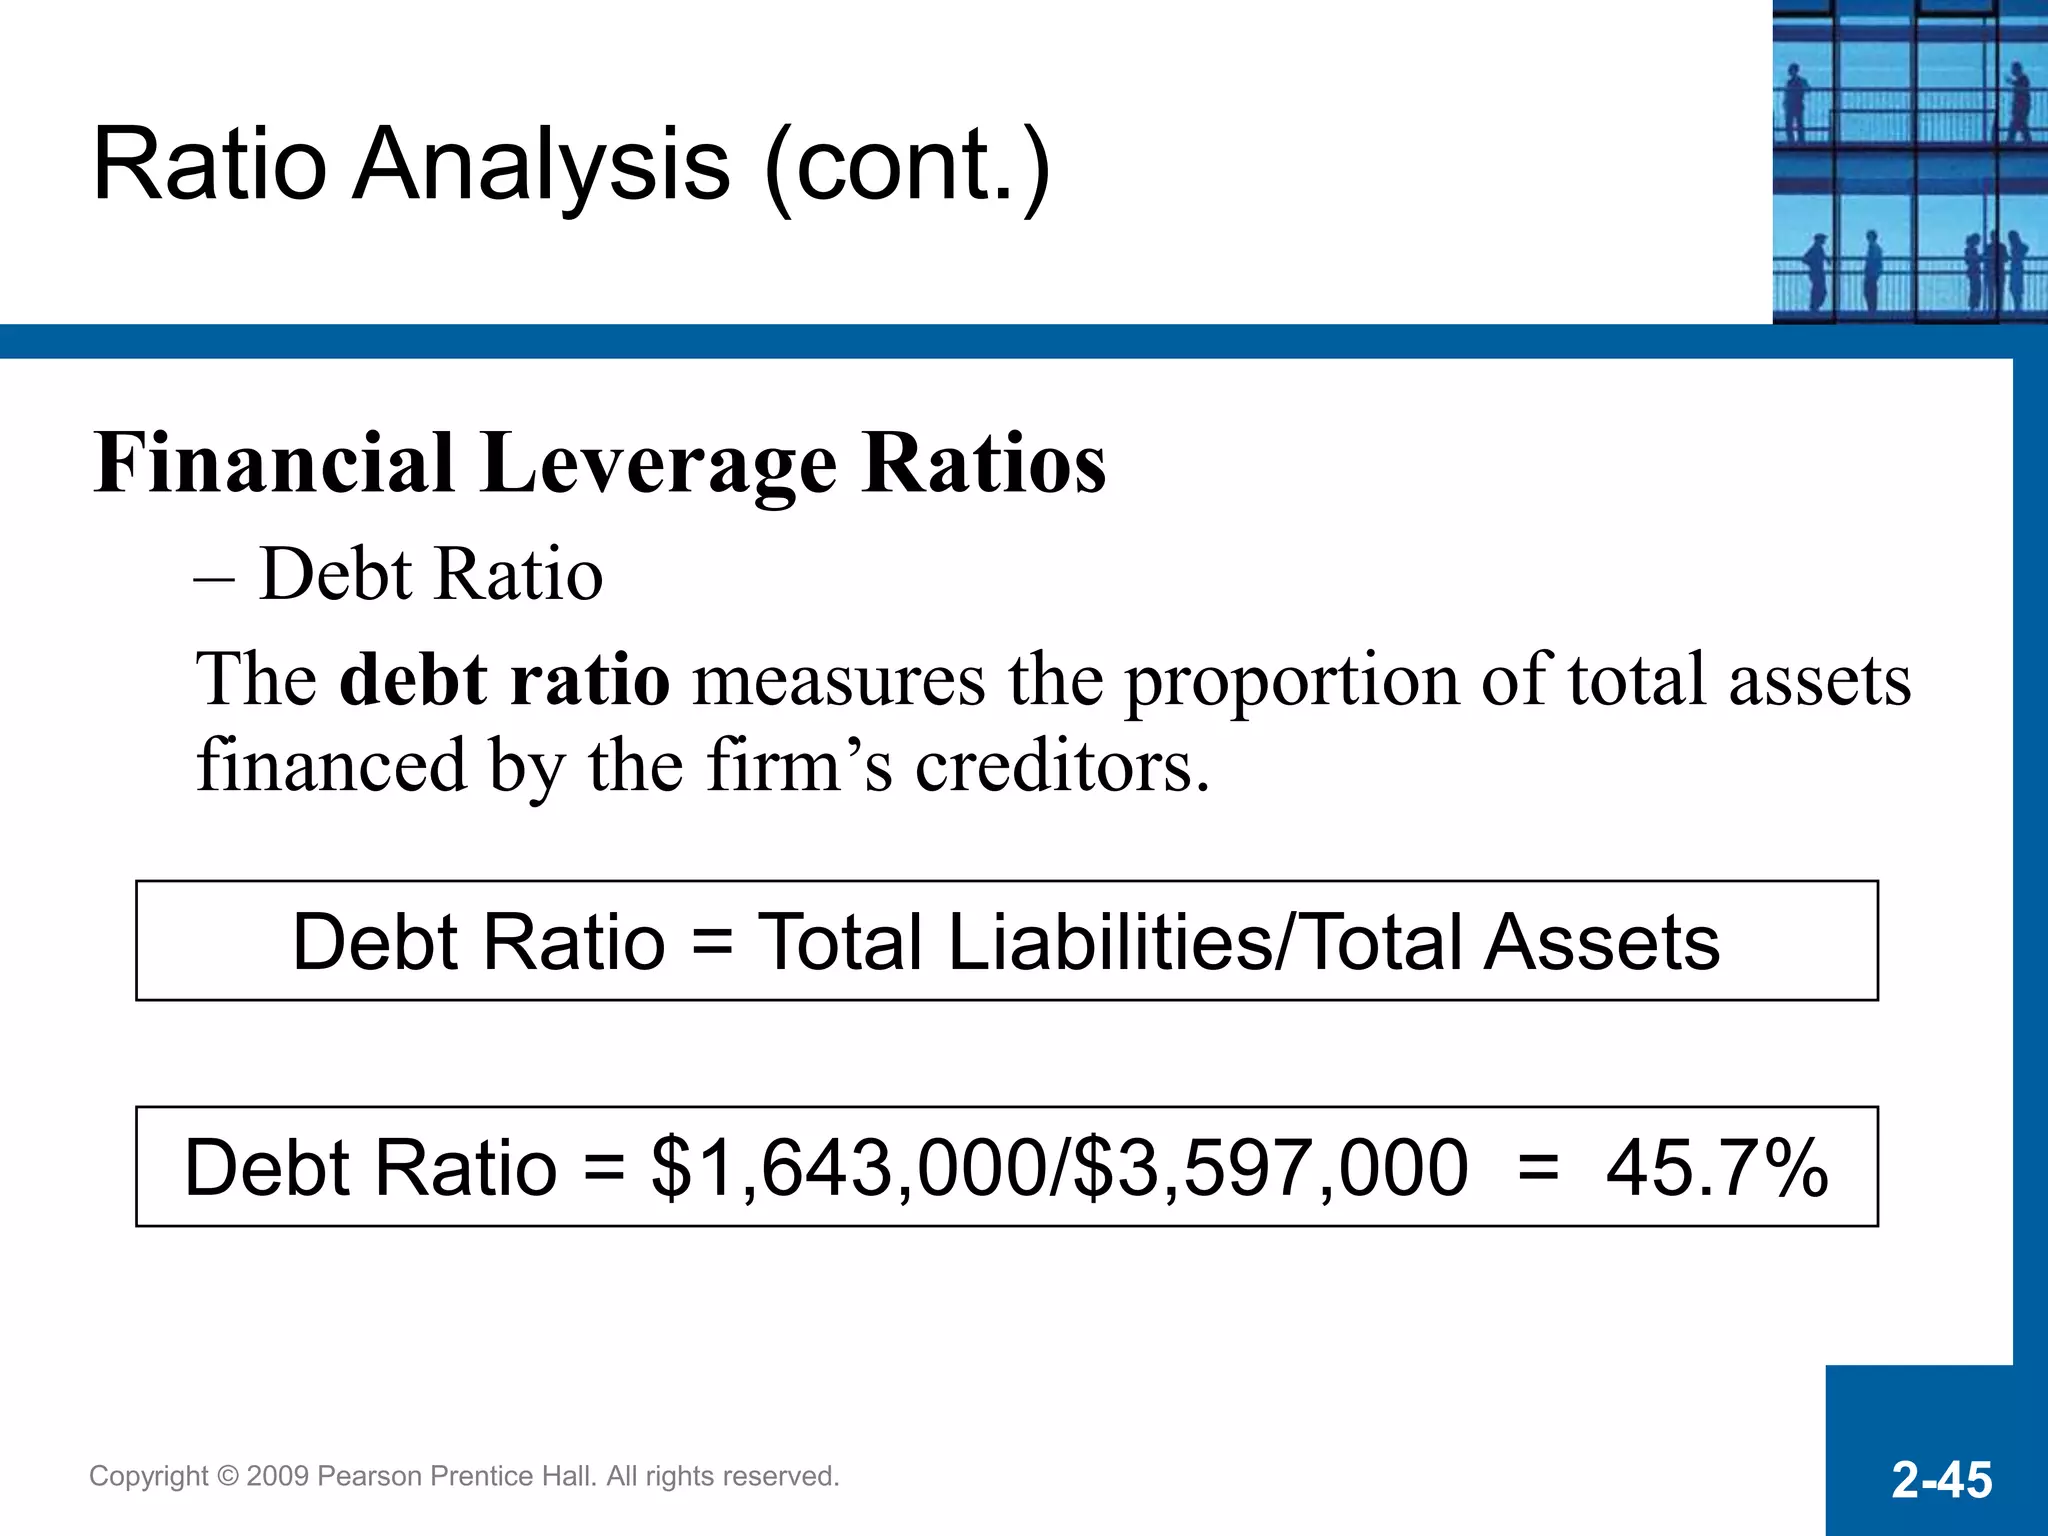
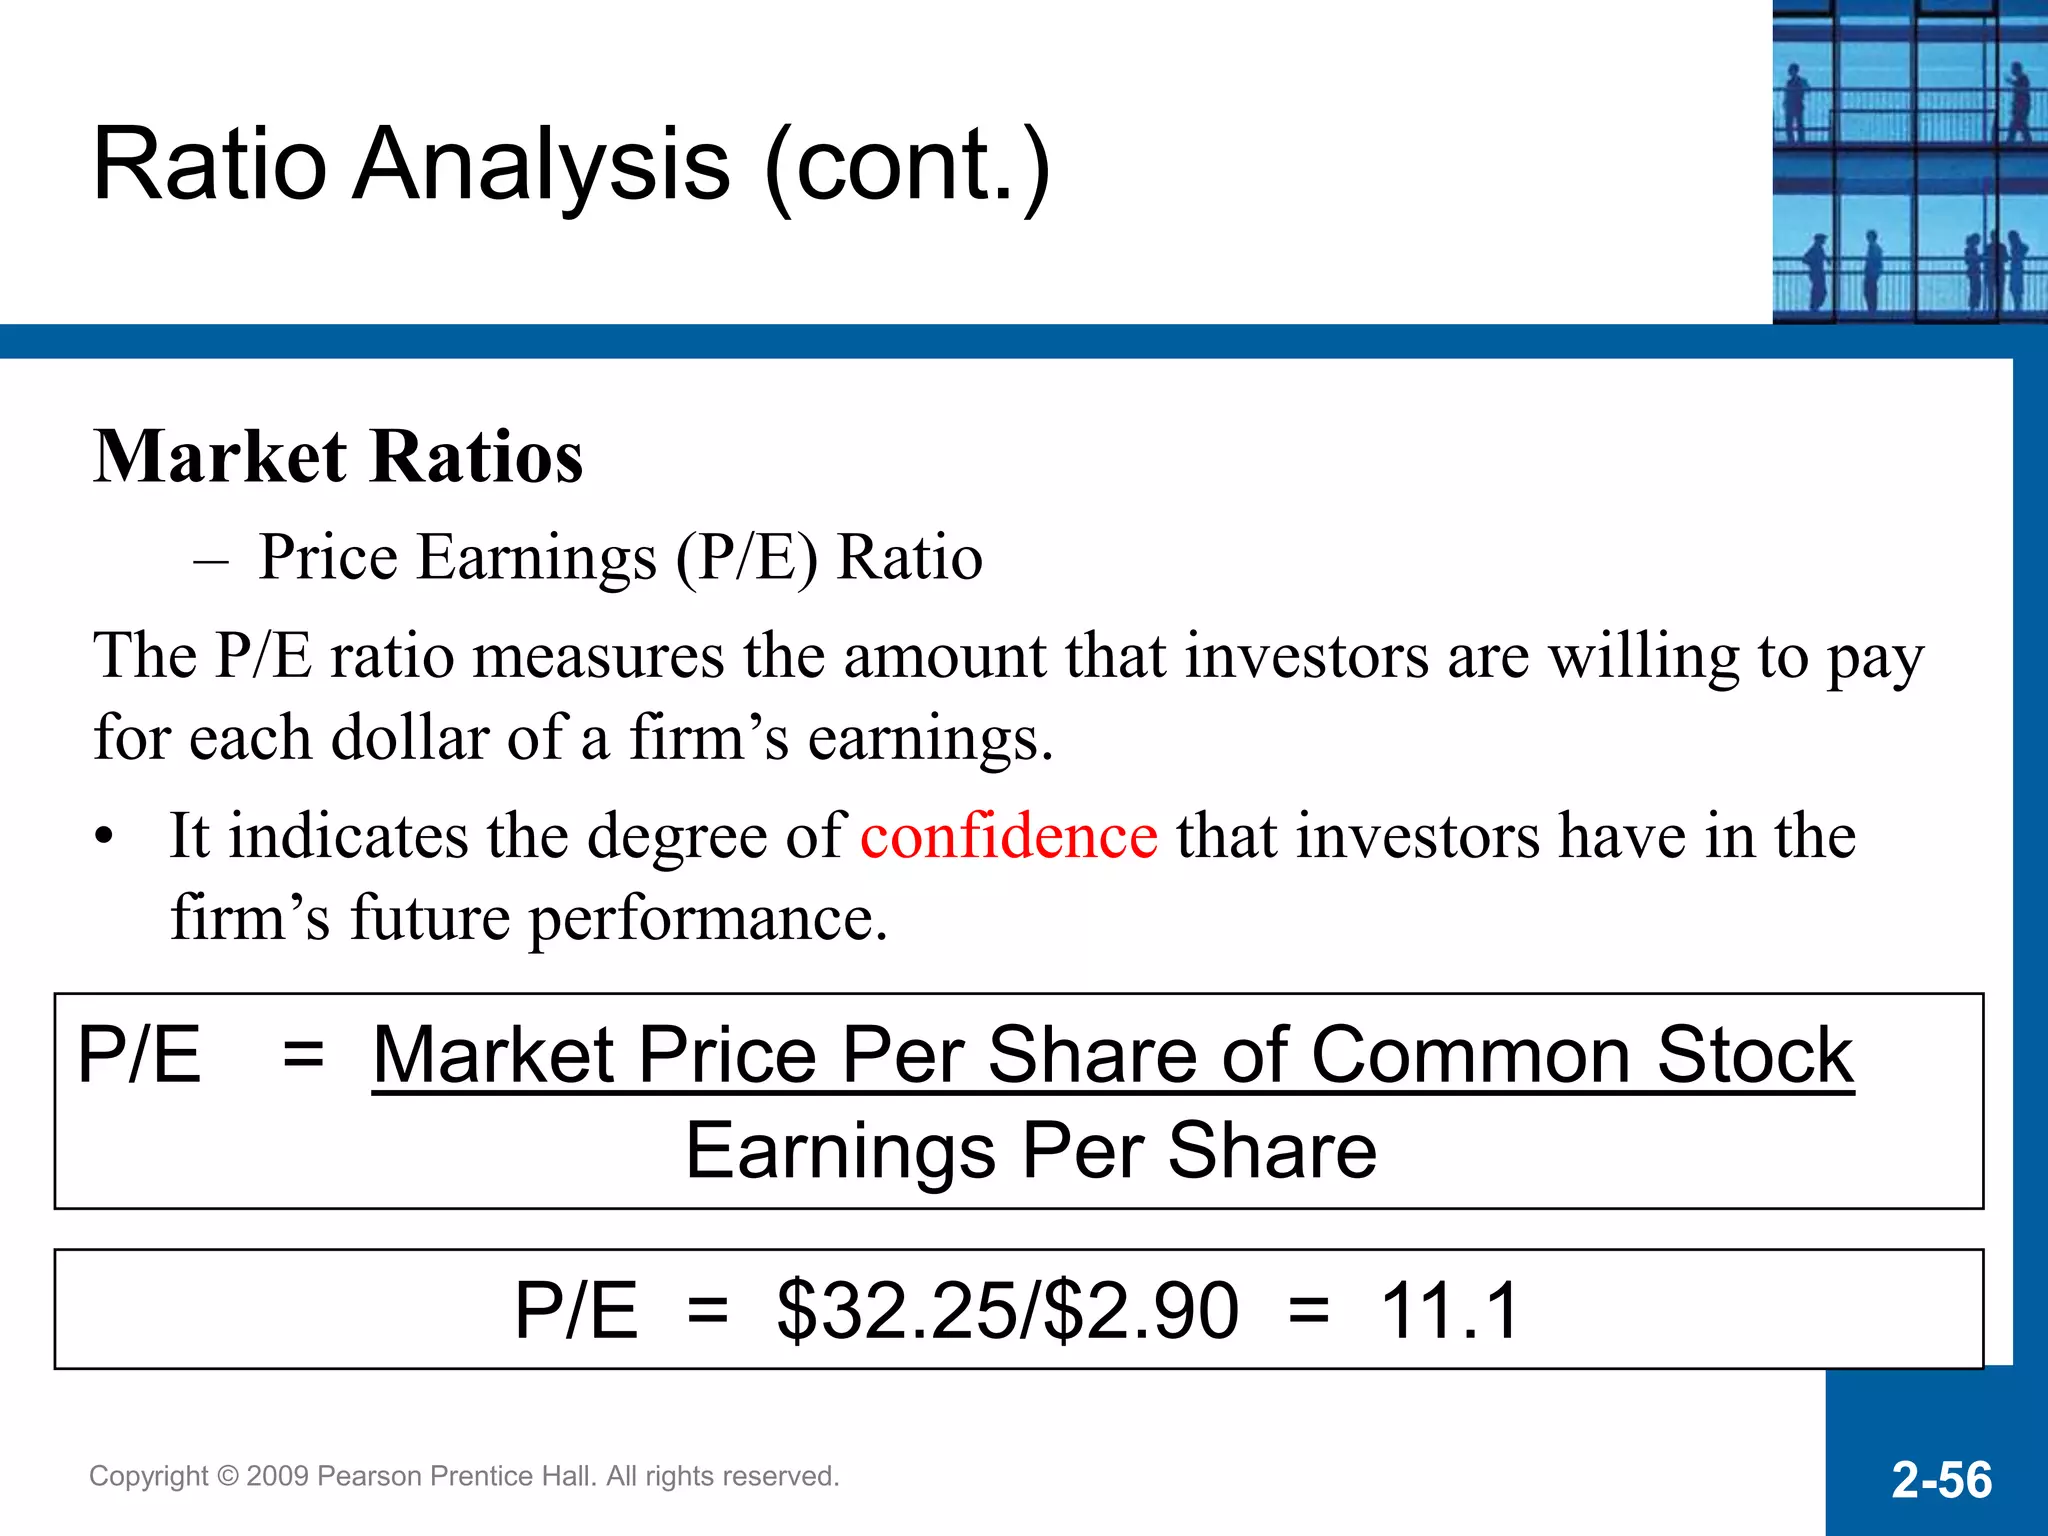
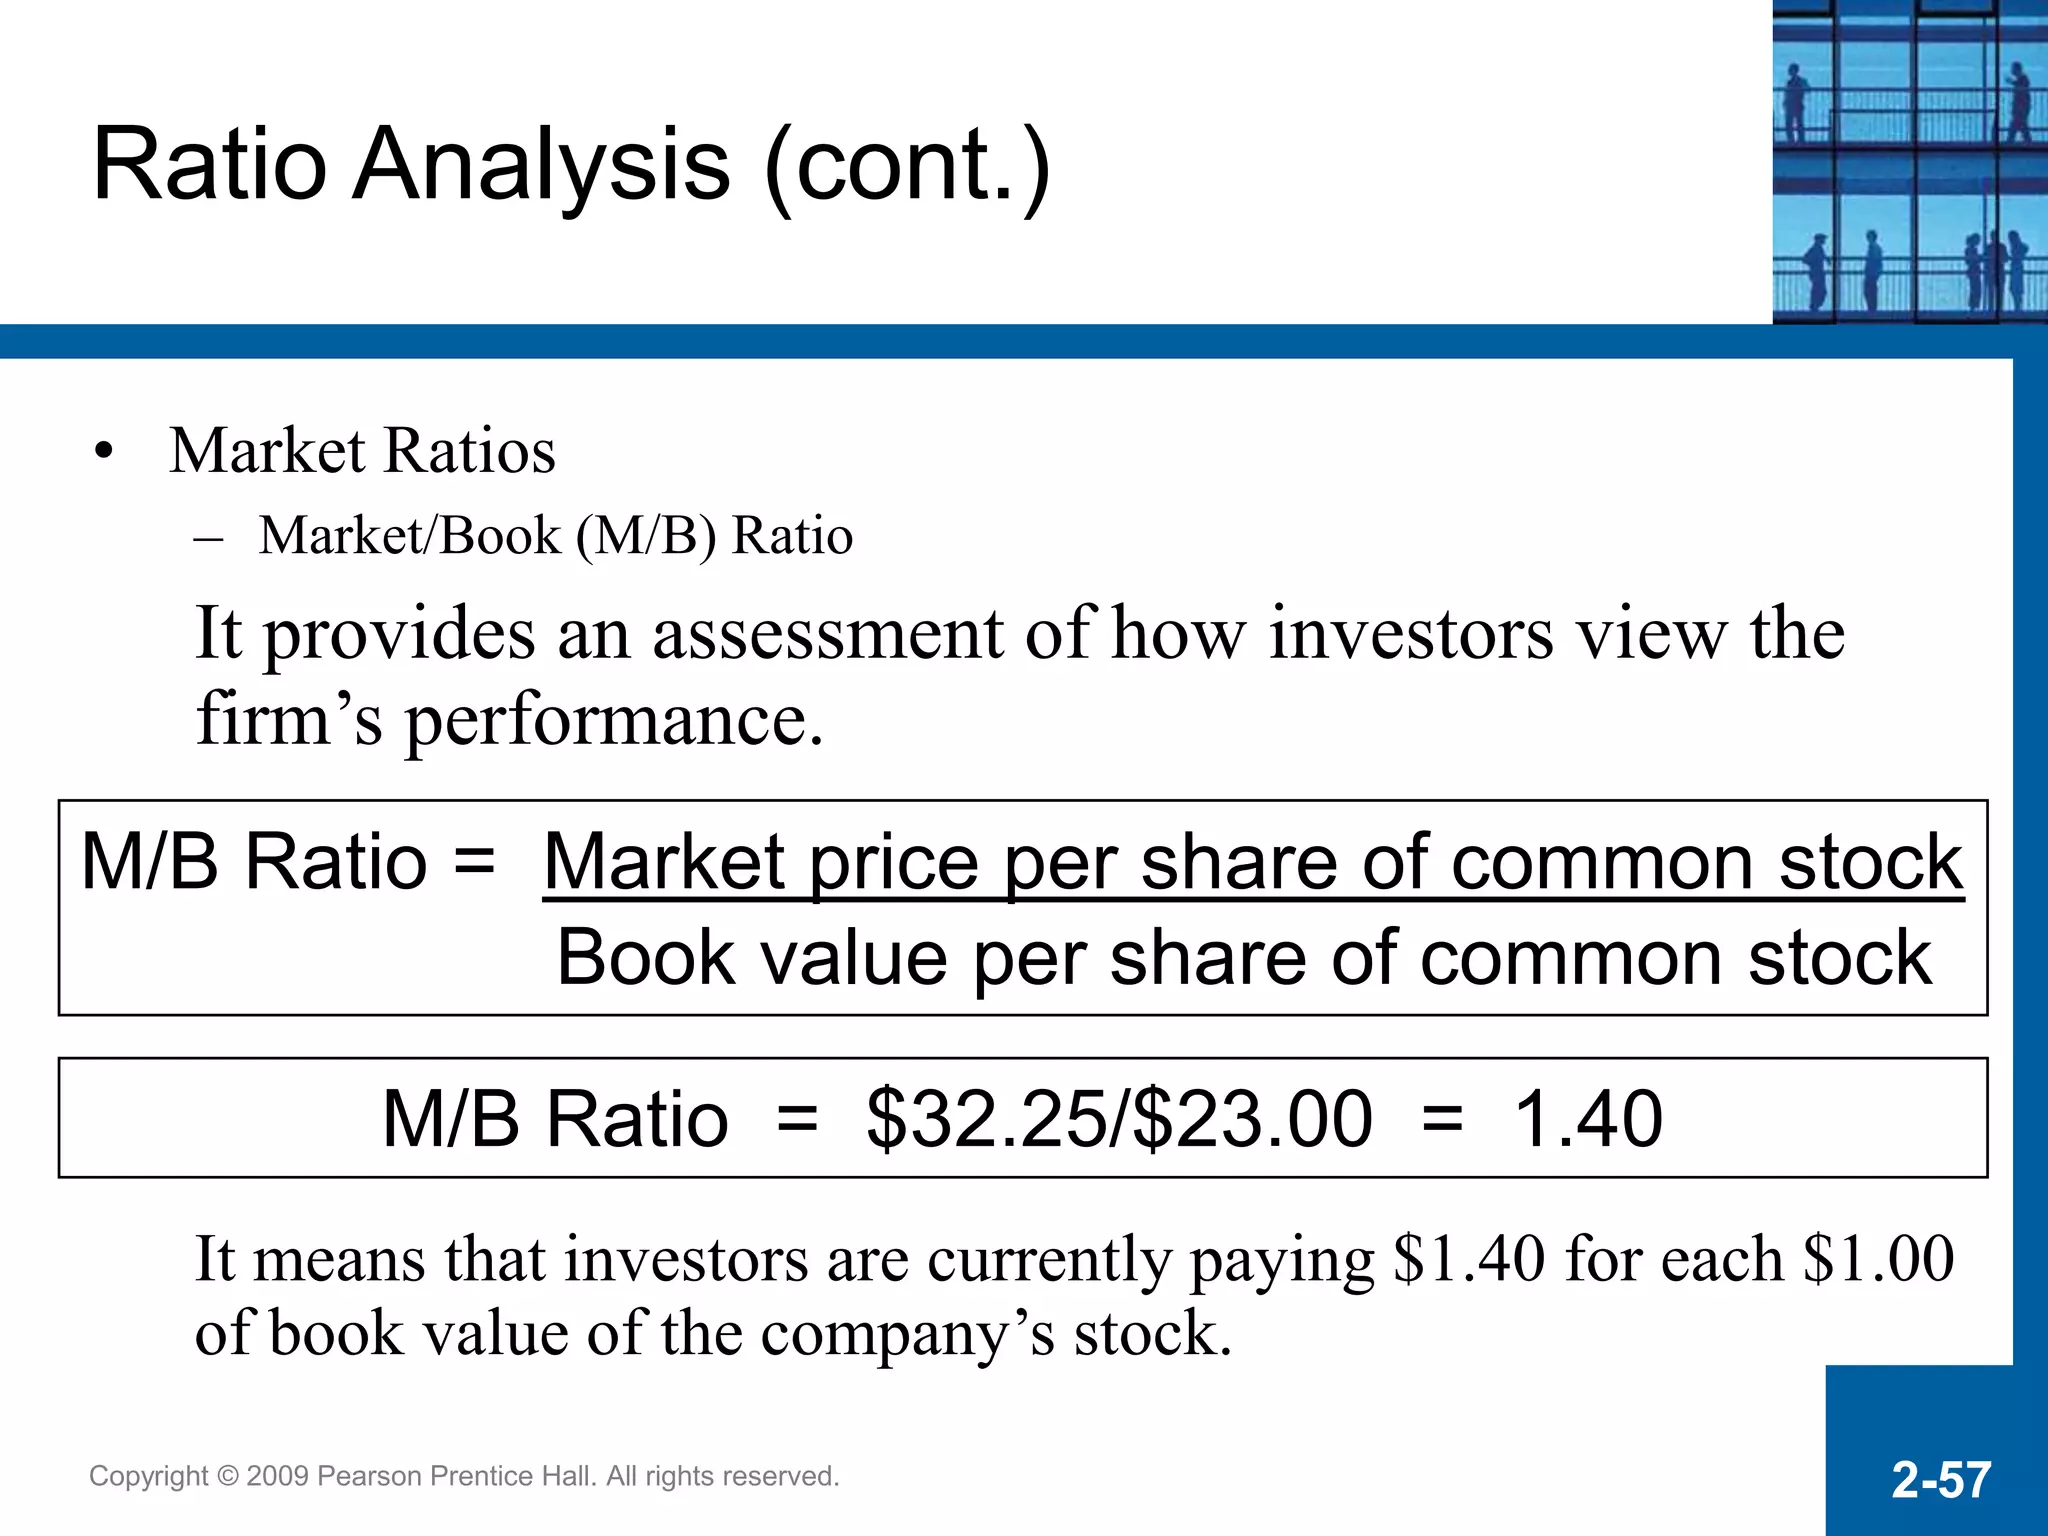
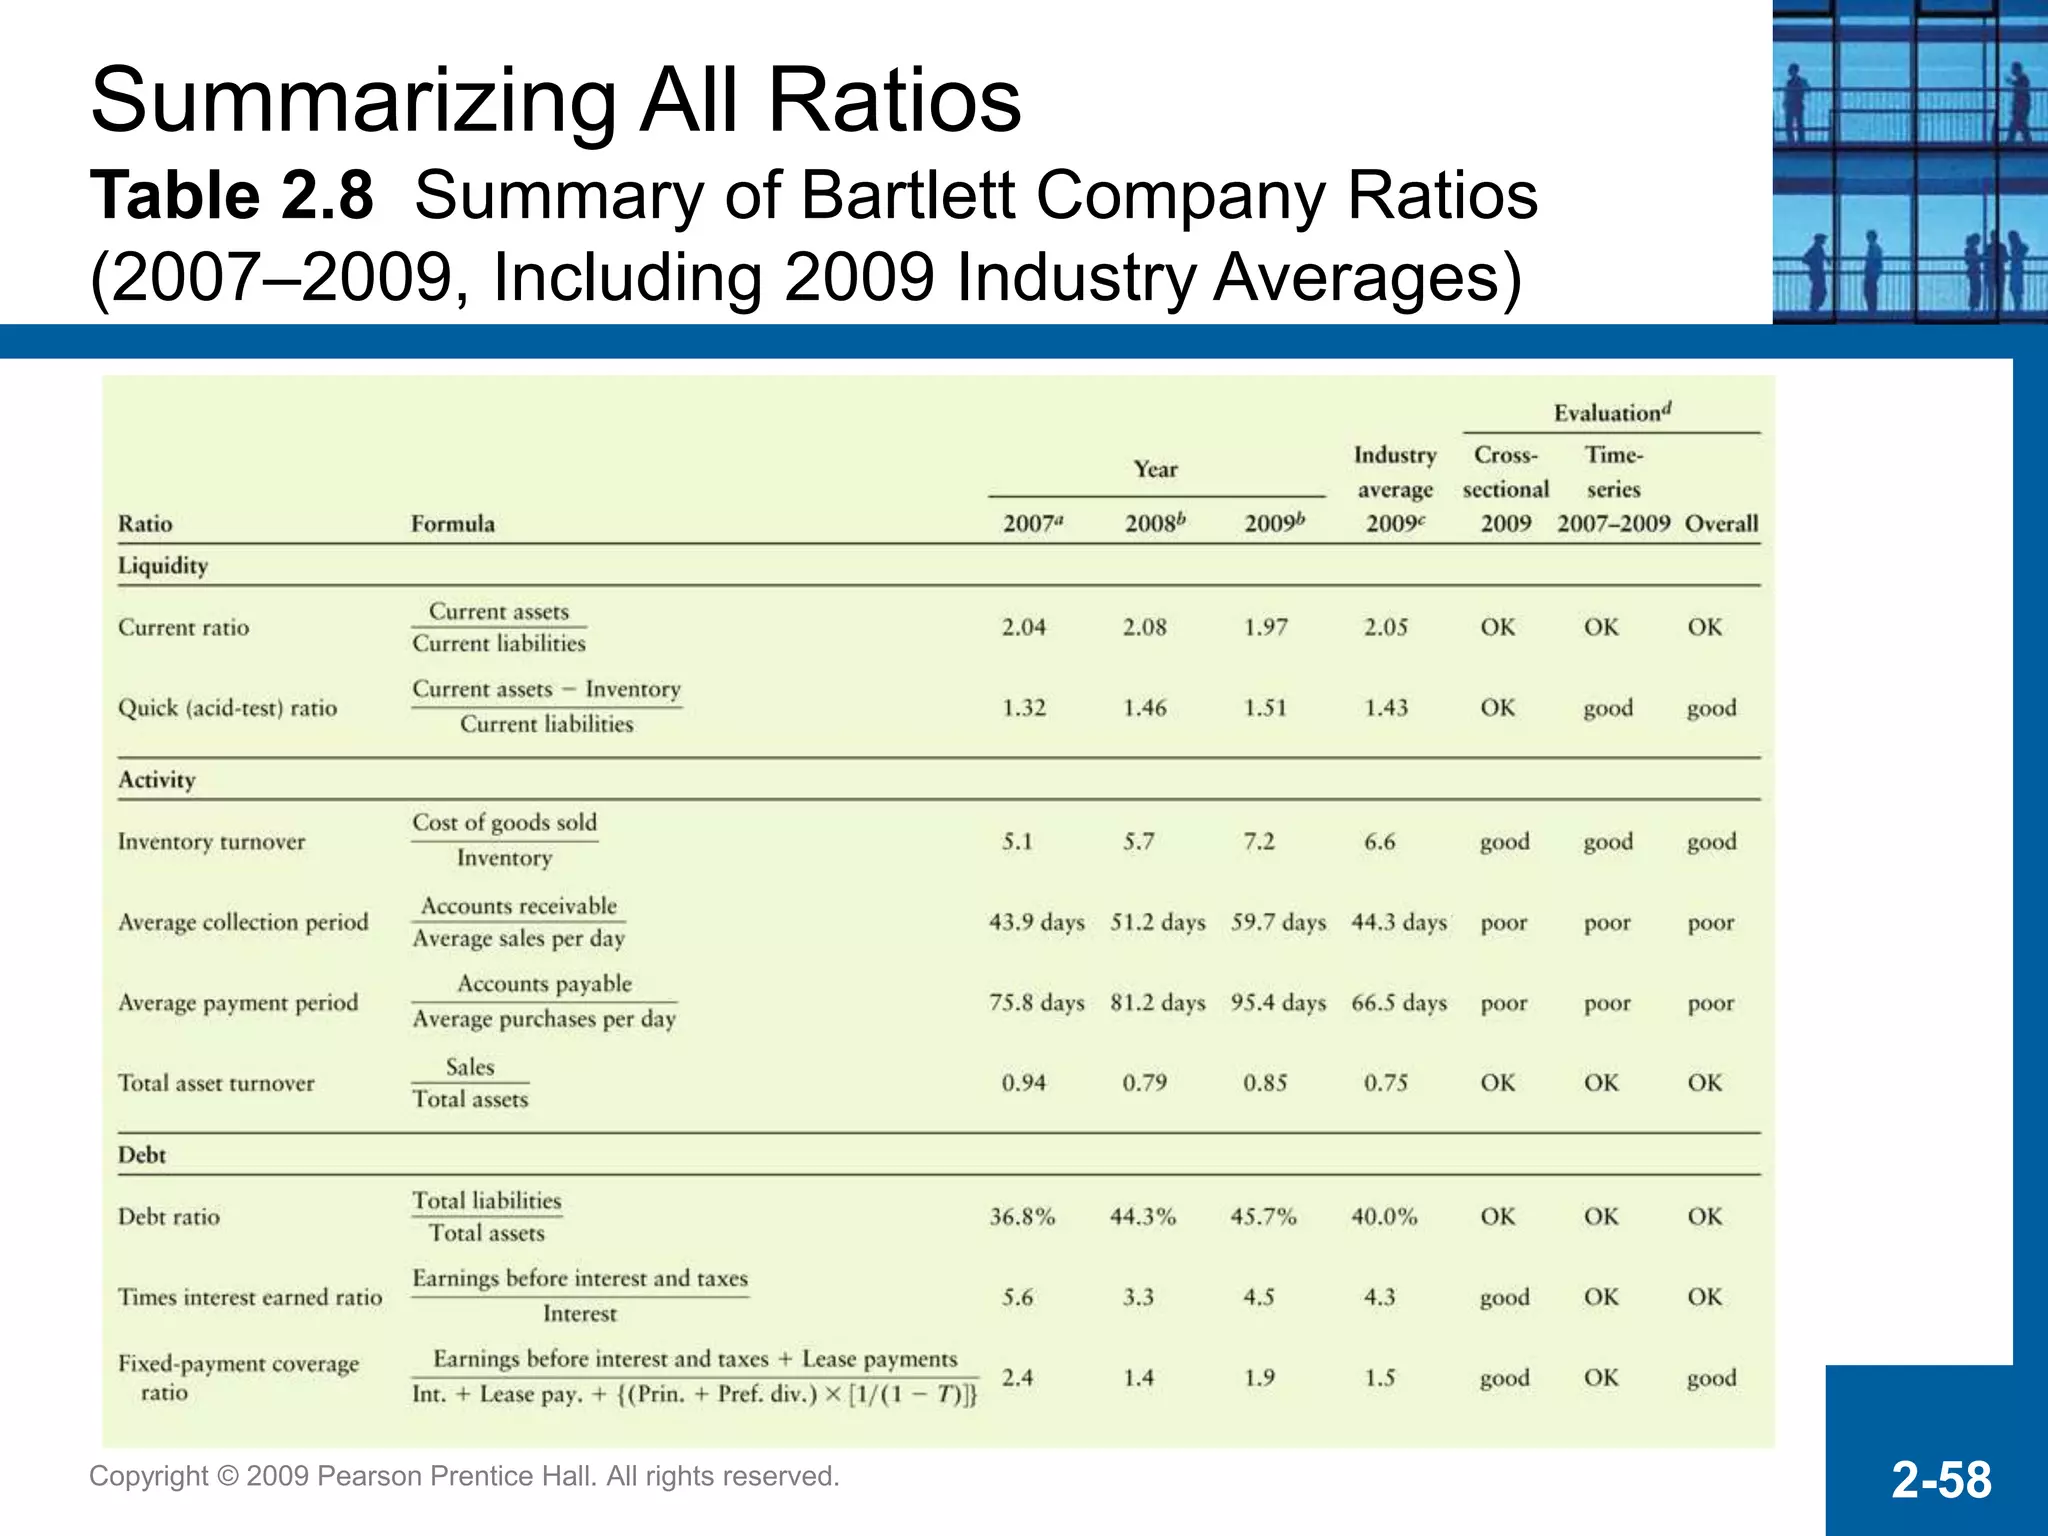
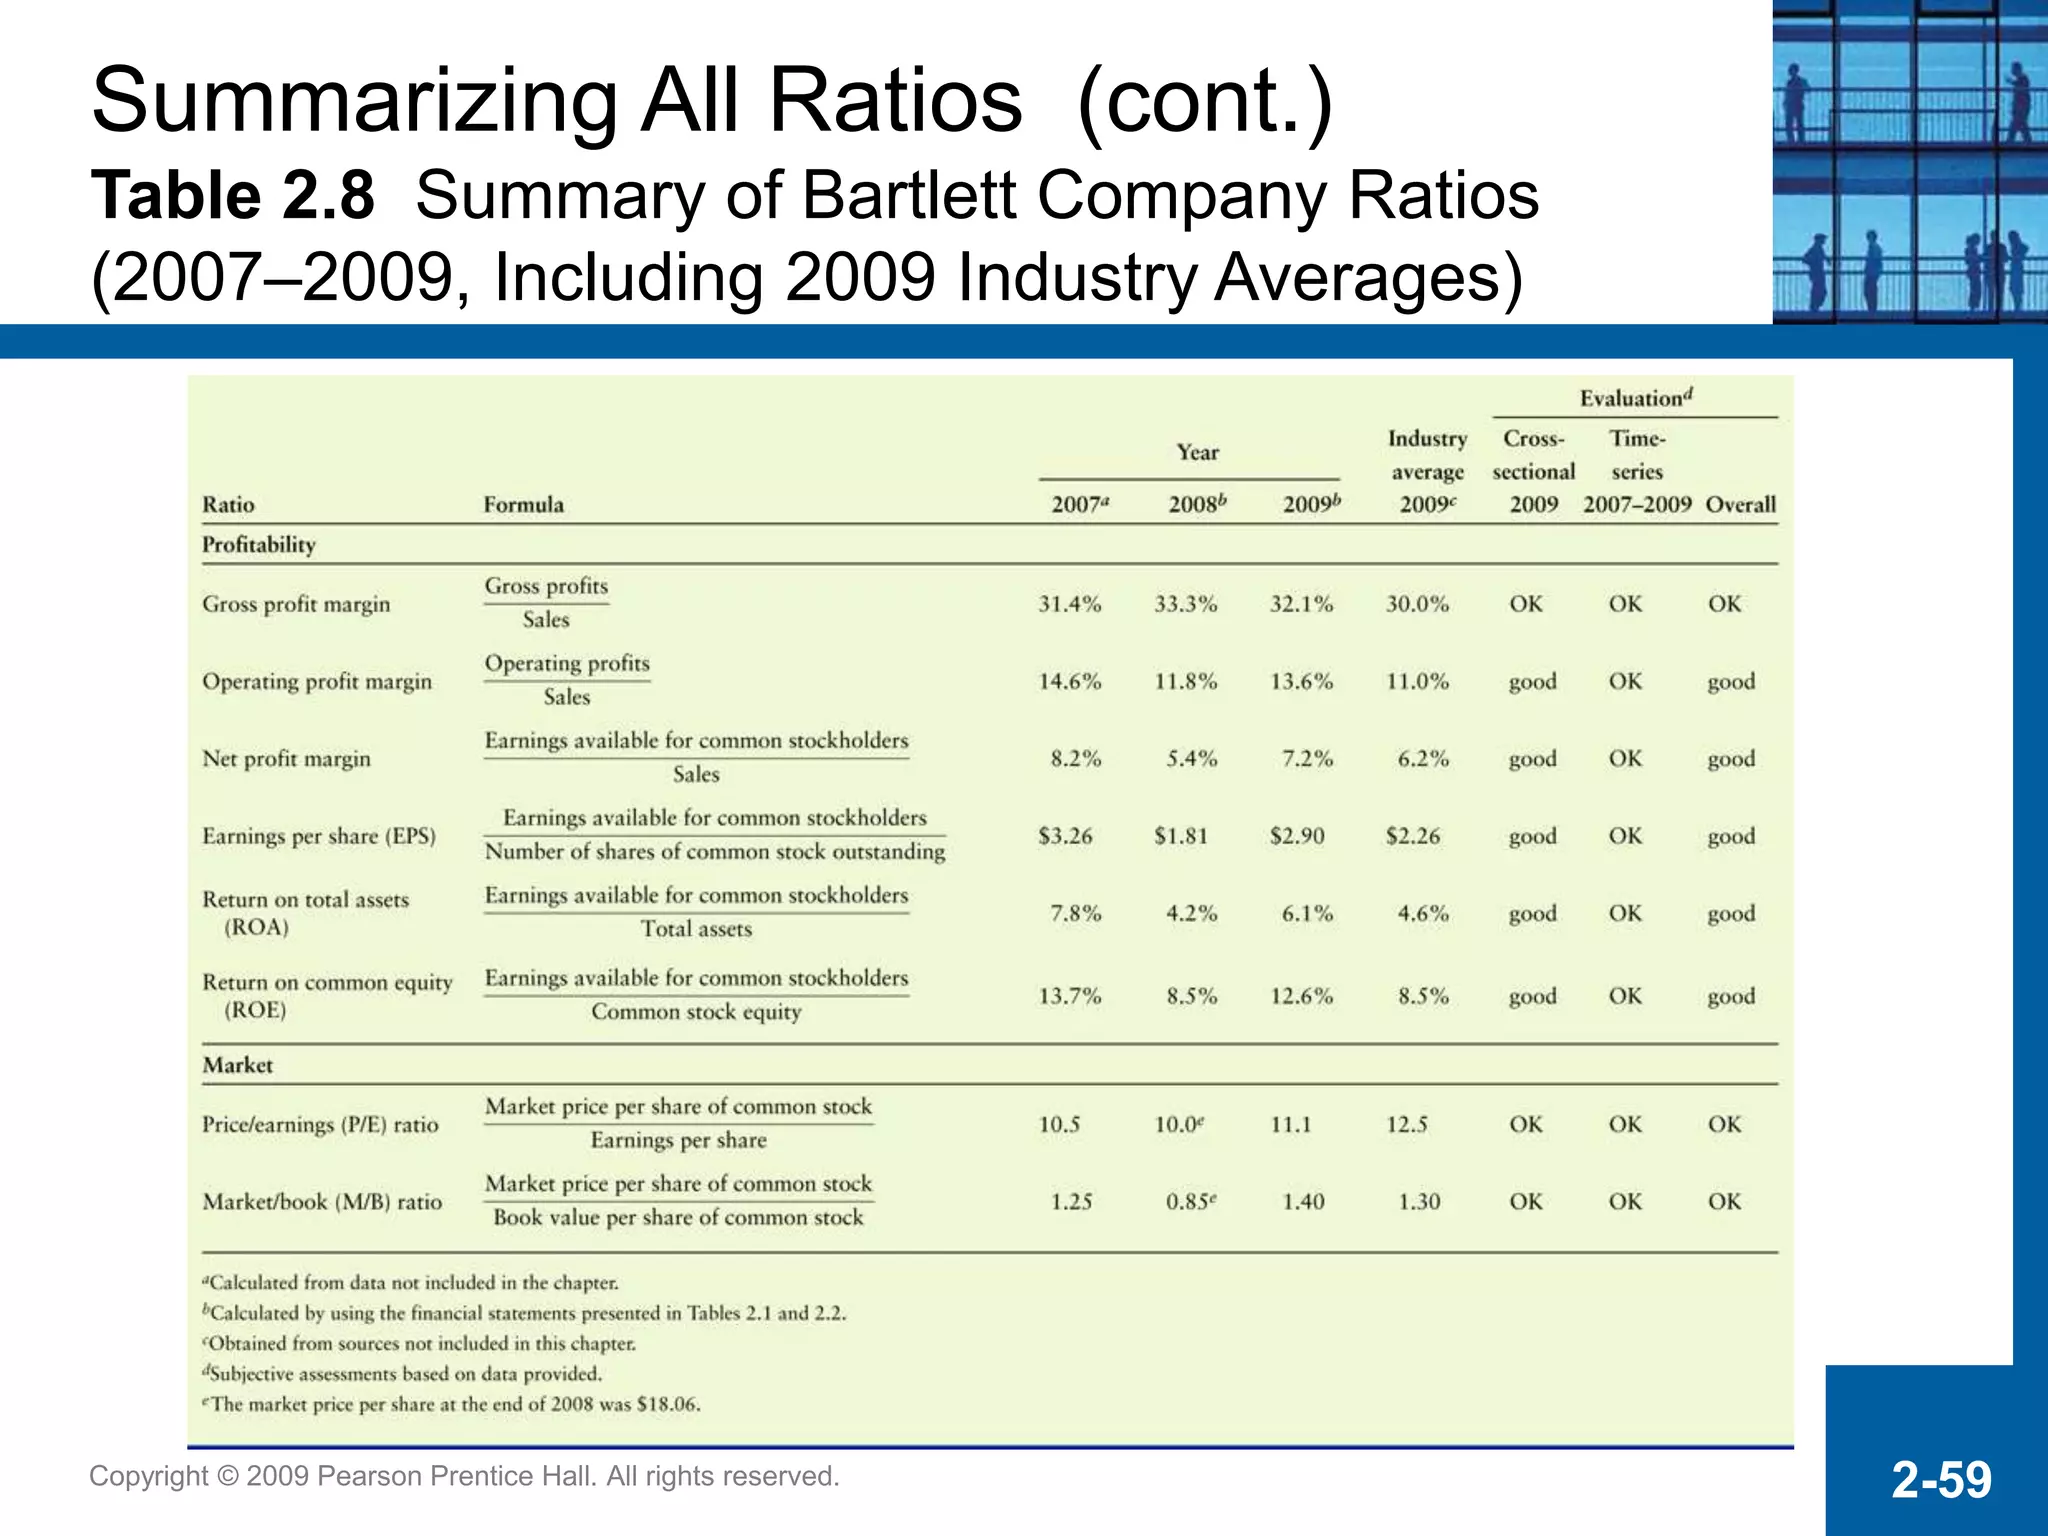
Copyright © 2009 Pearson Prentice Hall. All rights reserved.
Chapter 2
Financial
Statements
and Analysis
Copyright © 2009 Pearson Prentice Hall. All rights reserved. 2-2
Learning Goals
1. Review the contents of the stockholders’ report and
the procedures for consolidating international
financial statements.
2. Understand who uses financial ratios, and how.
3. Use ratios to analyze a firm’s liquidity and activity.
4. Discuss the relationship between debt and financial
leverage and the ratios used to analyze a firm’s debt.
Copyright © 2009 Pearson Prentice Hall. All rights reserved. 2-3
Learning Goals (cont.)
5. Use ratios to analyze a firm’s profitability and
market value.
6. Use a summary of financial ratios and the
DuPont system of analysis to perform a
complete ratio analysis.
Financial (Accounting) Statements
• Financial or Accounting statements are used
for reporting corporate activity.
4
Users of Financial Statements
External Users
•Lenders
•Shareholders
•Governments
•Consumer Groups
•External Auditors
•Customers
Internal Users
•Managers
•Officers
•Internal Auditors
•Sales Staff
•Budget Officers
•Controllers
5
Copyright © 2009 Pearson Prentice Hall. All rights reserved. 2-6
The Four Key Financial Statements:
The Income Statement
• The income statement provides a financial
summary of a company’s operating results
during a specified period.
• Although they are prepared annually for
reporting purposes, they are generally computed
monthly by management and quarterly for tax
purposes.
The Income Statement
 The income statement measures
performance over a specific period of time,
say, a year.
 The accounting definition of income is:
Revenues – Expenses = Income
Are increases in ownership
claims arising from the
delivery of goods or
services.
Are decreases in ownership
claims arising from
delivering goods or services
or using up asset.
7
Copyright © 2009 Pearson Prentice Hall. All rights reserved. 2-8
The Four Key Financial Statements
Table 2.1 Bartlett
Company Income
Statements ($000)
The Balance Sheet
• The balance sheet (also called statement of
financial position or statement of financial
condition) is a snapshot of the financial status of
an organization at a point in time.
• The balance sheet shows the assets owned by a
company, and how those assets are financed
(debt and equity).
9
Copyright © 2009 Pearson Prentice Hall. All rights reserved. 2-10
The Balance Sheet
• The balance sheet presents a summary of a
firm’s financial position at a given point in time.
• Assets indicate what the firm owns, equity
represents the owners’ investment, and liabilities
indicate what the firm has borrowed.
The Balance Sheet (Cont.)
Assets = Liabilities + Equity
What the company
owns (used to generate
income)
• How the ownership of assets
was financed (By third parties or
by the owners)
• Equity = book value of company
1
1
The Balance Sheet (Cont.)
Assets = Liabilities + Equity
What the company
owns (used to generate
income)
Assets are economic resources that a
company owns and expects to provide
future benefits.
Consist of:
1- Current assets
2- Fixed assets
1
2
The Balance Sheet (Cont.)
Assets = Liabilities + Equity
Fixed assets are reported at
the cost to purchase or
acquire the asset minus the
depreciation accumulated
on the assets since the time
of purchase.
• How the ownership of assets
was financed (By third parties or
by the owners)
• Equity = book value of company
• Current assets are those the business
expects to turn into cash during the next
year.
(Cash, account receivable, inventory,
prepaid expenses)
• Fixed assets are things of value that will
provide benefits to the company for one or
more years.
(Machines, lands, equipment, plants)
1
3
The Balance Sheet (Cont.)
Assets = Liabilities + Equity
• How the ownership of assets
was financed (By third parties or
by the owners)
• Equity = book value of company
Liabilities are the
obligations to non owners.
Consist of:
1- Current liabilities.
2- Long term liabilities.
1
4
The Balance Sheet (Cont.)
Assets = Liabilities + Equity
• How the ownership of assets
was financed (By third parties or
by the owners)
• Equity = book value of company
• Current liabilities are the
debts that a company must
pay off within the coming
year.
(Accounts payable, notes
payable, taxes payable)
1
5
The Balance Sheet (Cont.)
Assets = Liabilities + Equity
What the company
owns (used to generate
income)
• How the ownership of assets
was financed (By third parties or
by the owners)
• Equity = book value of company
• Long term liabilities are
obligations, usually loans,
that are due to be paid not in
the current year but in some
future period.
The amount specified in the
balance sheet is equal to the
total amount borrowed.
(long term debt, deferred
taxes)
1
6
The Balance Sheet (Cont.)
Assets = Liabilities + Equity
What the company
owns (used to generate
income)
• How the ownership of assets
was financed (By third parties or
by the owners)
• Equity = book value of company
Equity is the excess of the
assets over the liabilities.
It summarizes the owners‘
investment in the business.
(Stockholders’ equity,
accumulated retained
earnings, capital surplus)
1
7
Copyright © 2009 Pearson Prentice Hall. All rights reserved. 2-18
The Four Key Financial Statements
Table 2.2a Bartlett
Company Balance
Sheets ($000)
Copyright © 2009 Pearson Prentice Hall. All rights reserved. 2-19
The Four Key
Financial Statements (cont.)
Table 2.2b Bartlett
Company Balance
Sheets ($000)
Copyright © 2009 Pearson Prentice Hall. All rights reserved. 2-20
The Four Key Financial Statements:
Statement of Retained Earnings
• The statement of retained earnings reconciles the
net income earned and dividends paid during the
year, with the change in retained earnings.
Copyright © 2009 Pearson Prentice Hall. All rights reserved. 2-21
The Four Key Financial Statements
Table 2.3 Bartlett Company Statement of Retained Earnings
($000) for the Year Ended December 31, 2009
Copyright © 2009 Pearson Prentice Hall. All rights reserved. 2-22
The Four Key Financial Statements:
Statement of Cash Flows
• The statement of cash flows provides a
summary of the cash flows over the period of
concern, typically the year just ended.
• This statement not only provides insight into a
company’s investment, financing and operating
activities, but also ties together the income
statement and previous and current balance
sheets.
Statement of Cash Flows
(Cont.)
• The fundamental approach to the statement of cash
flows includes two steps:
1- List the activities that increased cash (cash
inflows) and those that decreased cash (cash
outflows).
2- place each cash inflow and outflow into one of
three categories according to the type of activity
that caused it: operating activities, investing
activities, and financing activities.
23
24
Statement of Cash Flows (Cont.)
• Cash flow from operating activities is the cash
flow that results from the firm’s normal activities
producing and selling goods and services.
• Cash flow from investing activities.
• Cash flow from financing activities is the net
payments to creditors and owners made during
the year.
25
Statement of Cash Flows (Cont.)
• The three components of the statement of cash
flows are:
1- Cash flow from Operating Activities
2- Cash flow from Investing Activities
3- Cash flow from Financing Activities
Copyright © 2009 Pearson Prentice Hall. All rights reserved. 2-26
The Four Key Financial Statements
Table 2.4 Bartlett
Company Statement of
Cash Flows ($000) for
the Year Ended
December 31, 2009
Copyright © 2009 Pearson Prentice Hall. All rights reserved. 2-27
Using Financial Ratios:
Interested Parties
• Ratio analysis involves methods of calculating
and interpreting financial ratios to assess a
firm’s financial condition and performance.
• It is of interest to shareholders, creditors, and the
firm’s own management.
Copyright © 2009 Pearson Prentice Hall. All rights reserved. 2-28
Using Financial Ratios:
Types of Ratio Comparisons
• Trend or time-series analysis: Evaluation of
the firm’s financial performance over time using
financial ratio analysis.
• Cross-sectional analysis: Comparison of
different firms’ financial ratios at the same point
in time; involves comparing the firm’s ratios to
those of other firms in its industry or to industry
averages.
Copyright © 2009 Pearson Prentice Hall. All rights reserved. 2-29
Using Financial Ratios:
Types of Ratio Comparisons (cont.)
Table 2.5 Industry Average Ratios for Selected Lines of
Businessa
Copyright © 2009 Pearson Prentice Hall. All rights reserved. 2-30
Using Financial Ratios:
Types of Ratio Comparisons (cont.)
Figure 2.1 Combined Analysis
Copyright © 2009 Pearson Prentice Hall. All rights reserved. 2-31
Using Financial Ratios:
Cautions for Doing Ratio Analysis
1. Ratios must be considered together; a single ratio by
itself means relatively little.
2. Financial statements that are being compared should
be dated at the same point in time.
3. The financial data being compared should have been
developed in the same way.
Copyright © 2009 Pearson Prentice Hall. All rights reserved. 2-32
Ratio Analysis
Liquidity Ratios
– Current Ratio
• The current ratio, measures the firm’s ability to
meet its short-term obligations.
• Generally, the higher the current ratio, the more
liquid the firm is considered to be.
Copyright © 2009 Pearson Prentice Hall. All rights reserved. 2-33
Current ratio = total current assets
total current liabilities
Current ratio = $1,233,000 = 1.97
$620,000
Ratio Analysis
• Liquidity Ratios
– Current Ratio
Copyright © 2009 Pearson Prentice Hall. All rights reserved. 2-34
Quick ratio = Total Current Assets - Inventory
total current liabilities
Quick ratio = $1,233,000 - $289,000 = 1.51
$620,000
Ratio Analysis (cont.)
• Liquidity Ratios
– Current Ratio
– Quick Ratio
Copyright © 2009 Pearson Prentice Hall. All rights reserved. 2-35
Ratio Analysis (cont.)
• Liquidity Ratios
– The quick ratio provides a better measure of overall
liquidity only when a firm’s inventory cannot be
easily converted into cash.
– If inventory is liquid, the current ratio is a preferred
measure of overall liquidity.
Copyright © 2009 Pearson Prentice Hall. All rights reserved. 2-36
Ratio Analysis (cont.)
Activity Ratios
Activity ratios measure the speed with which various
accounts are converted into sales or cash—inflows or
outflows.
– Inventory Turnover
The resulting turnover is meaningful only when it is
compared with that of other firms in the same industry
or to the firm’s past inventory turnover.
Copyright © 2009 Pearson Prentice Hall. All rights reserved. 2-37
Inventory Turnover = Cost of Goods Sold
Inventory
Inventory Turnover = $2,088,000 = 7.2
$289,000
Ratio Analysis (cont.)
• Activity Ratios
– Inventory Turnover
Copyright © 2009 Pearson Prentice Hall. All rights reserved. 2-38
Average Age of Inventory = 360
Inventory Turnover
Inventory Turnover = 360 = 50.0 days
7.2
Ratio Analysis (cont.)
• Activity Ratios
– Average Age of Inventory
• This value can be viewed as the average number of days’ sales in
inventory.
Copyright © 2009 Pearson Prentice Hall. All rights reserved. 2-39
ACP = Accounts Receivable
Net Sales/360
ACP = $503,000 = 58.9 days
$3,074,000/360
Ratio Analysis (cont.)
• Activity Ratios
– Average Collection Period
is the average amount of time needed to collect
accounts receivable.
Copyright © 2009 Pearson Prentice Hall. All rights reserved. 2-40
Ratio Analysis (cont.)
– Average Collection Period
• The average collection period is meaningful only in
relation to the firm’s credit terms.
• If the firm had extended 60-day credit terms, the 58.9-
day average collection period would be acceptable.
• If the firm had extended 30-day credit terms to
customers, an average collection period of 58.9 days
may indicate a poorly managed credit or collection
department, or both.
Copyright © 2009 Pearson Prentice Hall. All rights reserved. 2-41
APP = Accounts Payable
Annual Purchases/360
APP = $382,000 = 94.1 days
1461600/360
Ratio Analysis (cont.)
• Activity Ratios
– Average Payment Period
Is the average amount of time needed to pay accounts payable.
If the firm’s suppliers have extended, on average, 30-day credit
terms, an analyst would give the firm a low credit rating.
Copyright © 2009 Pearson Prentice Hall. All rights reserved. 2-42
Total Asset Turnover = Net Sales
Total Assets
Total Asset Turnover = $3,074,000 = .85
$3,597,000
Ratio Analysis (cont.)
• Activity Ratios
– Total Asset Turnover
It indicates the efficiency with which the firm uses its assets to
generate sales.
Copyright © 2009 Pearson Prentice Hall. All rights reserved. 2-43
Ratio Analysis (cont.)
– Total Asset Turnover
• Generally, the higher a firm’s total asset turnover, the
more efficiently its assets have been used.
• This measure is probably of greatest interest to
management, because it indicates whether the firm’s
operations have been financially efficient.
Copyright © 2009 Pearson Prentice Hall. All rights reserved. 2-44
Ratio Analysis (cont.)
Table 2.6 Financial Statements Associated with Patty’s
Alternatives
Copyright © 2009 Pearson Prentice Hall. All rights reserved. 2-45
Debt Ratio = Total Liabilities/Total Assets
Debt Ratio = $1,643,000/$3,597,000 = 45.7%
Ratio Analysis (cont.)
Financial Leverage Ratios
– Debt Ratio
The debt ratio measures the proportion of total assets
financed by the firm’s creditors.
Copyright © 2009 Pearson Prentice Hall. All rights reserved. 2-46
Ratio Analysis (cont.)
• Financial Leverage Ratios
– Debt Ratio measures the proportion of total assets
financed by the firm’s creditors.
• This value indicates that the company has
financed close to half of its assets with debt.
• The higher this ratio, the greater the firm’s
degree of indebtedness and the more financial
leverage it has.
Copyright © 2009 Pearson Prentice Hall. All rights reserved. 2-47
Times Interest Earned = EBIT/Interest
Times Interest Earned = $418,000/$93,000 = 4.5
Ratio Analysis (cont.)
• Leverage Ratios
– Times Interest Earned Ratio
Measures the firm’s ability to make contractual interest
payments.
A value of at least 3.0—and preferably closer to 5.0—is
often suggested.
Copyright © 2009 Pearson Prentice Hall. All rights reserved. 2-48
Ratio Analysis (cont.)
Profitability Ratios
– Common-Size Income Statement
Is an income statement in which each item is expressed
as a percentage of sales.
Copyright © 2009 Pearson Prentice Hall. All rights reserved. 2-49
Ratio Analysis (cont.)
Table 2.7
Bartlett Company
Common-Size
Income
Statements
Copyright © 2009 Pearson Prentice Hall. All rights reserved. 2-50
GPM = Gross Profit/Net Sales
GPM = $986,000/$3,074,000 = 32.1%
Ratio Analysis (cont.)
• Profitability Ratios
– Gross Profit Margin
It measures the percentage of each sales dollar
remaining after the firm has paid for its goods sold.
– The higher the gross profit margin, the better.
Copyright © 2009 Pearson Prentice Hall. All rights reserved. 2-51
OPM = EBIT/Net Sales
OPM = $418,000/$3,074,000 = 13.6%
Ratio Analysis (cont.)
• Profitability Ratios
– Operating Profit Margin (OPM)
A high operating profit margin is preferred.
Copyright © 2009 Pearson Prentice Hall. All rights reserved. 2-52
NPM = Earnings Available to Common Stockholders
Sales
NPM = $221,000/$3,074,000 = 7.2%
Ratio Analysis (cont.)
• Profitability Ratios
– Net Profit Margin (NPM)
It measures the percentage of each sales dollar remaining
after all costs and expenses, including interest, taxes, and
preferred stock dividends, have been deducted.
Copyright © 2009 Pearson Prentice Hall. All rights reserved. 2-53
EPS = Earnings Available to Common Stockholders
Number of Shares Outstanding
EPS = $221,000/76,262 = $2.90
Ratio Analysis (cont.)
• Profitability Ratios
– Earnings Per Share (EPS)
Copyright © 2009 Pearson Prentice Hall. All rights reserved. 2-54
ROA = Earnings Available to Common Stockholders
Total Assets
ROA = $221,000/$3,597,000 = 6.1%
Ratio Analysis (cont.)
• Profitability Ratios
– Return on Total Assets (ROA)
The higher the firm’s return on total assets, the better.
Copyright © 2009 Pearson Prentice Hall. All rights reserved. 2-55
ROE = $221,000/$1,754,000 = 12.6%
ROE = Earnings Available to Common Stockholders
Total Equity
Ratio Analysis (cont.)
• Profitability Ratios
– Return on Equity (ROE)
It measure the return earned on the common stockholders’
investment in the firm.
• The higher this return, the better off are the owners.
Copyright © 2009 Pearson Prentice Hall. All rights reserved. 2-56
P/E = Market Price Per Share of Common Stock
Earnings Per Share
P/E = $32.25/$2.90 = 11.1
Ratio Analysis (cont.)
Market Ratios
– Price Earnings (P/E) Ratio
The P/E ratio measures the amount that investors are willing to pay
for each dollar of a firm’s earnings.
• It indicates the degree of confidence that investors have in the
firm’s future performance.
Copyright © 2009 Pearson Prentice Hall. All rights reserved. 2-57
M/B Ratio = Market price per share of common stock
Book value per share of common stock
M/B Ratio = $32.25/$23.00 = 1.40
Ratio Analysis (cont.)
• Market Ratios
– Market/Book (M/B) Ratio
It provides an assessment of how investors view the
firm’s performance.
It means that investors are currently paying $1.40 for each $1.00
of book value of the company’s stock.
Copyright © 2009 Pearson Prentice Hall. All rights reserved. 2-58
Summarizing All Ratios
Table 2.8 Summary of Bartlett Company Ratios
(2007–2009, Including 2009 Industry Averages)
Copyright © 2009 Pearson Prentice Hall. All rights reserved. 2-59
Summarizing All Ratios (cont.)
Table 2.8 Summary of Bartlett Company Ratios
(2007–2009, Including 2009 Industry Averages)
Copyright © 2009 Pearson Prentice Hall. All rights reserved. 2-60
DuPont System of Analysis
• The DuPont system of analysis is used to dissect the firm’s
financial statements and to assess its financial condition.
• It merges the income statement and balance sheet into two summary
measures of profitability.
• The Modified DuPont Formula relates the firm’s ROA to its ROE
using the financial leverage multiplier (FLM), which is the ratio of
total assets to common stock equity:
• ROA and ROE as shown in the series of equations on the following
slide and in Figure 2.2 on the following slide.
Copyright © 2009 Pearson Prentice Hall. All rights reserved. 2-61
DuPont System of Analysis
Copyright © 2009 Pearson Prentice Hall. All rights reserved. 2-62
DuPont System of Analysis (cont.)
Figure 2.2 DuPont
System of Analysis
Copyright © 2009 Pearson Prentice Hall. All rights reserved. 2-63
ROE = 6.1% X 2.06 = 12.6%
Modified DuPont Formula (cont.)
• Use of the FLM to convert ROA into ROE reflects the
impact of financial leverage on the owner’s return.
• Substituting the values for Bartlett Company’s ROA of
6.1 percent calculated earlier, and Bartlett’s FLM of
2.06 ($3,597,000 total assets ÷ $1,754,000 common
stock equity) into the Modified DuPont formula yields:

Chapter 2 financial statements

  • 1.
    Copyright © 2009Pearson Prentice Hall. All rights reserved. Chapter 2 Financial Statements and Analysis
  • 2.
    Copyright © 2009Pearson Prentice Hall. All rights reserved. 2-2 Learning Goals 1. Review the contents of the stockholders’ report and the procedures for consolidating international financial statements. 2. Understand who uses financial ratios, and how. 3. Use ratios to analyze a firm’s liquidity and activity. 4. Discuss the relationship between debt and financial leverage and the ratios used to analyze a firm’s debt.
  • 3.
    Copyright © 2009Pearson Prentice Hall. All rights reserved. 2-3 Learning Goals (cont.) 5. Use ratios to analyze a firm’s profitability and market value. 6. Use a summary of financial ratios and the DuPont system of analysis to perform a complete ratio analysis.
  • 4.
    Financial (Accounting) Statements •Financial or Accounting statements are used for reporting corporate activity. 4
  • 5.
    Users of FinancialStatements External Users •Lenders •Shareholders •Governments •Consumer Groups •External Auditors •Customers Internal Users •Managers •Officers •Internal Auditors •Sales Staff •Budget Officers •Controllers 5
  • 6.
    Copyright © 2009Pearson Prentice Hall. All rights reserved. 2-6 The Four Key Financial Statements: The Income Statement • The income statement provides a financial summary of a company’s operating results during a specified period. • Although they are prepared annually for reporting purposes, they are generally computed monthly by management and quarterly for tax purposes.
  • 7.
    The Income Statement The income statement measures performance over a specific period of time, say, a year.  The accounting definition of income is: Revenues – Expenses = Income Are increases in ownership claims arising from the delivery of goods or services. Are decreases in ownership claims arising from delivering goods or services or using up asset. 7
  • 8.
    Copyright © 2009Pearson Prentice Hall. All rights reserved. 2-8 The Four Key Financial Statements Table 2.1 Bartlett Company Income Statements ($000)
  • 9.
    The Balance Sheet •The balance sheet (also called statement of financial position or statement of financial condition) is a snapshot of the financial status of an organization at a point in time. • The balance sheet shows the assets owned by a company, and how those assets are financed (debt and equity). 9
  • 10.
    Copyright © 2009Pearson Prentice Hall. All rights reserved. 2-10 The Balance Sheet • The balance sheet presents a summary of a firm’s financial position at a given point in time. • Assets indicate what the firm owns, equity represents the owners’ investment, and liabilities indicate what the firm has borrowed.
  • 11.
    The Balance Sheet(Cont.) Assets = Liabilities + Equity What the company owns (used to generate income) • How the ownership of assets was financed (By third parties or by the owners) • Equity = book value of company 1 1
  • 12.
    The Balance Sheet(Cont.) Assets = Liabilities + Equity What the company owns (used to generate income) Assets are economic resources that a company owns and expects to provide future benefits. Consist of: 1- Current assets 2- Fixed assets 1 2
  • 13.
    The Balance Sheet(Cont.) Assets = Liabilities + Equity Fixed assets are reported at the cost to purchase or acquire the asset minus the depreciation accumulated on the assets since the time of purchase. • How the ownership of assets was financed (By third parties or by the owners) • Equity = book value of company • Current assets are those the business expects to turn into cash during the next year. (Cash, account receivable, inventory, prepaid expenses) • Fixed assets are things of value that will provide benefits to the company for one or more years. (Machines, lands, equipment, plants) 1 3
  • 14.
    The Balance Sheet(Cont.) Assets = Liabilities + Equity • How the ownership of assets was financed (By third parties or by the owners) • Equity = book value of company Liabilities are the obligations to non owners. Consist of: 1- Current liabilities. 2- Long term liabilities. 1 4
  • 15.
    The Balance Sheet(Cont.) Assets = Liabilities + Equity • How the ownership of assets was financed (By third parties or by the owners) • Equity = book value of company • Current liabilities are the debts that a company must pay off within the coming year. (Accounts payable, notes payable, taxes payable) 1 5
  • 16.
    The Balance Sheet(Cont.) Assets = Liabilities + Equity What the company owns (used to generate income) • How the ownership of assets was financed (By third parties or by the owners) • Equity = book value of company • Long term liabilities are obligations, usually loans, that are due to be paid not in the current year but in some future period. The amount specified in the balance sheet is equal to the total amount borrowed. (long term debt, deferred taxes) 1 6
  • 17.
    The Balance Sheet(Cont.) Assets = Liabilities + Equity What the company owns (used to generate income) • How the ownership of assets was financed (By third parties or by the owners) • Equity = book value of company Equity is the excess of the assets over the liabilities. It summarizes the owners‘ investment in the business. (Stockholders’ equity, accumulated retained earnings, capital surplus) 1 7
  • 18.
    Copyright © 2009Pearson Prentice Hall. All rights reserved. 2-18 The Four Key Financial Statements Table 2.2a Bartlett Company Balance Sheets ($000)
  • 19.
    Copyright © 2009Pearson Prentice Hall. All rights reserved. 2-19 The Four Key Financial Statements (cont.) Table 2.2b Bartlett Company Balance Sheets ($000)
  • 20.
    Copyright © 2009Pearson Prentice Hall. All rights reserved. 2-20 The Four Key Financial Statements: Statement of Retained Earnings • The statement of retained earnings reconciles the net income earned and dividends paid during the year, with the change in retained earnings.
  • 21.
    Copyright © 2009Pearson Prentice Hall. All rights reserved. 2-21 The Four Key Financial Statements Table 2.3 Bartlett Company Statement of Retained Earnings ($000) for the Year Ended December 31, 2009
  • 22.
    Copyright © 2009Pearson Prentice Hall. All rights reserved. 2-22 The Four Key Financial Statements: Statement of Cash Flows • The statement of cash flows provides a summary of the cash flows over the period of concern, typically the year just ended. • This statement not only provides insight into a company’s investment, financing and operating activities, but also ties together the income statement and previous and current balance sheets.
  • 23.
    Statement of CashFlows (Cont.) • The fundamental approach to the statement of cash flows includes two steps: 1- List the activities that increased cash (cash inflows) and those that decreased cash (cash outflows). 2- place each cash inflow and outflow into one of three categories according to the type of activity that caused it: operating activities, investing activities, and financing activities. 23
  • 24.
    24 Statement of CashFlows (Cont.) • Cash flow from operating activities is the cash flow that results from the firm’s normal activities producing and selling goods and services. • Cash flow from investing activities. • Cash flow from financing activities is the net payments to creditors and owners made during the year.
  • 25.
    25 Statement of CashFlows (Cont.) • The three components of the statement of cash flows are: 1- Cash flow from Operating Activities 2- Cash flow from Investing Activities 3- Cash flow from Financing Activities
  • 26.
    Copyright © 2009Pearson Prentice Hall. All rights reserved. 2-26 The Four Key Financial Statements Table 2.4 Bartlett Company Statement of Cash Flows ($000) for the Year Ended December 31, 2009
  • 27.
    Copyright © 2009Pearson Prentice Hall. All rights reserved. 2-27 Using Financial Ratios: Interested Parties • Ratio analysis involves methods of calculating and interpreting financial ratios to assess a firm’s financial condition and performance. • It is of interest to shareholders, creditors, and the firm’s own management.
  • 28.
    Copyright © 2009Pearson Prentice Hall. All rights reserved. 2-28 Using Financial Ratios: Types of Ratio Comparisons • Trend or time-series analysis: Evaluation of the firm’s financial performance over time using financial ratio analysis. • Cross-sectional analysis: Comparison of different firms’ financial ratios at the same point in time; involves comparing the firm’s ratios to those of other firms in its industry or to industry averages.
  • 29.
    Copyright © 2009Pearson Prentice Hall. All rights reserved. 2-29 Using Financial Ratios: Types of Ratio Comparisons (cont.) Table 2.5 Industry Average Ratios for Selected Lines of Businessa
  • 30.
    Copyright © 2009Pearson Prentice Hall. All rights reserved. 2-30 Using Financial Ratios: Types of Ratio Comparisons (cont.) Figure 2.1 Combined Analysis
  • 31.
    Copyright © 2009Pearson Prentice Hall. All rights reserved. 2-31 Using Financial Ratios: Cautions for Doing Ratio Analysis 1. Ratios must be considered together; a single ratio by itself means relatively little. 2. Financial statements that are being compared should be dated at the same point in time. 3. The financial data being compared should have been developed in the same way.
  • 32.
    Copyright © 2009Pearson Prentice Hall. All rights reserved. 2-32 Ratio Analysis Liquidity Ratios – Current Ratio • The current ratio, measures the firm’s ability to meet its short-term obligations. • Generally, the higher the current ratio, the more liquid the firm is considered to be.
  • 33.
    Copyright © 2009Pearson Prentice Hall. All rights reserved. 2-33 Current ratio = total current assets total current liabilities Current ratio = $1,233,000 = 1.97 $620,000 Ratio Analysis • Liquidity Ratios – Current Ratio
  • 34.
    Copyright © 2009Pearson Prentice Hall. All rights reserved. 2-34 Quick ratio = Total Current Assets - Inventory total current liabilities Quick ratio = $1,233,000 - $289,000 = 1.51 $620,000 Ratio Analysis (cont.) • Liquidity Ratios – Current Ratio – Quick Ratio
  • 35.
    Copyright © 2009Pearson Prentice Hall. All rights reserved. 2-35 Ratio Analysis (cont.) • Liquidity Ratios – The quick ratio provides a better measure of overall liquidity only when a firm’s inventory cannot be easily converted into cash. – If inventory is liquid, the current ratio is a preferred measure of overall liquidity.
  • 36.
    Copyright © 2009Pearson Prentice Hall. All rights reserved. 2-36 Ratio Analysis (cont.) Activity Ratios Activity ratios measure the speed with which various accounts are converted into sales or cash—inflows or outflows. – Inventory Turnover The resulting turnover is meaningful only when it is compared with that of other firms in the same industry or to the firm’s past inventory turnover.
  • 37.
    Copyright © 2009Pearson Prentice Hall. All rights reserved. 2-37 Inventory Turnover = Cost of Goods Sold Inventory Inventory Turnover = $2,088,000 = 7.2 $289,000 Ratio Analysis (cont.) • Activity Ratios – Inventory Turnover
  • 38.
    Copyright © 2009Pearson Prentice Hall. All rights reserved. 2-38 Average Age of Inventory = 360 Inventory Turnover Inventory Turnover = 360 = 50.0 days 7.2 Ratio Analysis (cont.) • Activity Ratios – Average Age of Inventory • This value can be viewed as the average number of days’ sales in inventory.
  • 39.
    Copyright © 2009Pearson Prentice Hall. All rights reserved. 2-39 ACP = Accounts Receivable Net Sales/360 ACP = $503,000 = 58.9 days $3,074,000/360 Ratio Analysis (cont.) • Activity Ratios – Average Collection Period is the average amount of time needed to collect accounts receivable.
  • 40.
    Copyright © 2009Pearson Prentice Hall. All rights reserved. 2-40 Ratio Analysis (cont.) – Average Collection Period • The average collection period is meaningful only in relation to the firm’s credit terms. • If the firm had extended 60-day credit terms, the 58.9- day average collection period would be acceptable. • If the firm had extended 30-day credit terms to customers, an average collection period of 58.9 days may indicate a poorly managed credit or collection department, or both.
  • 41.
    Copyright © 2009Pearson Prentice Hall. All rights reserved. 2-41 APP = Accounts Payable Annual Purchases/360 APP = $382,000 = 94.1 days 1461600/360 Ratio Analysis (cont.) • Activity Ratios – Average Payment Period Is the average amount of time needed to pay accounts payable. If the firm’s suppliers have extended, on average, 30-day credit terms, an analyst would give the firm a low credit rating.
  • 42.
    Copyright © 2009Pearson Prentice Hall. All rights reserved. 2-42 Total Asset Turnover = Net Sales Total Assets Total Asset Turnover = $3,074,000 = .85 $3,597,000 Ratio Analysis (cont.) • Activity Ratios – Total Asset Turnover It indicates the efficiency with which the firm uses its assets to generate sales.
  • 43.
    Copyright © 2009Pearson Prentice Hall. All rights reserved. 2-43 Ratio Analysis (cont.) – Total Asset Turnover • Generally, the higher a firm’s total asset turnover, the more efficiently its assets have been used. • This measure is probably of greatest interest to management, because it indicates whether the firm’s operations have been financially efficient.
  • 44.
    Copyright © 2009Pearson Prentice Hall. All rights reserved. 2-44 Ratio Analysis (cont.) Table 2.6 Financial Statements Associated with Patty’s Alternatives
  • 45.
    Copyright © 2009Pearson Prentice Hall. All rights reserved. 2-45 Debt Ratio = Total Liabilities/Total Assets Debt Ratio = $1,643,000/$3,597,000 = 45.7% Ratio Analysis (cont.) Financial Leverage Ratios – Debt Ratio The debt ratio measures the proportion of total assets financed by the firm’s creditors.
  • 46.
    Copyright © 2009Pearson Prentice Hall. All rights reserved. 2-46 Ratio Analysis (cont.) • Financial Leverage Ratios – Debt Ratio measures the proportion of total assets financed by the firm’s creditors. • This value indicates that the company has financed close to half of its assets with debt. • The higher this ratio, the greater the firm’s degree of indebtedness and the more financial leverage it has.
  • 47.
    Copyright © 2009Pearson Prentice Hall. All rights reserved. 2-47 Times Interest Earned = EBIT/Interest Times Interest Earned = $418,000/$93,000 = 4.5 Ratio Analysis (cont.) • Leverage Ratios – Times Interest Earned Ratio Measures the firm’s ability to make contractual interest payments. A value of at least 3.0—and preferably closer to 5.0—is often suggested.
  • 48.
    Copyright © 2009Pearson Prentice Hall. All rights reserved. 2-48 Ratio Analysis (cont.) Profitability Ratios – Common-Size Income Statement Is an income statement in which each item is expressed as a percentage of sales.
  • 49.
    Copyright © 2009Pearson Prentice Hall. All rights reserved. 2-49 Ratio Analysis (cont.) Table 2.7 Bartlett Company Common-Size Income Statements
  • 50.
    Copyright © 2009Pearson Prentice Hall. All rights reserved. 2-50 GPM = Gross Profit/Net Sales GPM = $986,000/$3,074,000 = 32.1% Ratio Analysis (cont.) • Profitability Ratios – Gross Profit Margin It measures the percentage of each sales dollar remaining after the firm has paid for its goods sold. – The higher the gross profit margin, the better.
  • 51.
    Copyright © 2009Pearson Prentice Hall. All rights reserved. 2-51 OPM = EBIT/Net Sales OPM = $418,000/$3,074,000 = 13.6% Ratio Analysis (cont.) • Profitability Ratios – Operating Profit Margin (OPM) A high operating profit margin is preferred.
  • 52.
    Copyright © 2009Pearson Prentice Hall. All rights reserved. 2-52 NPM = Earnings Available to Common Stockholders Sales NPM = $221,000/$3,074,000 = 7.2% Ratio Analysis (cont.) • Profitability Ratios – Net Profit Margin (NPM) It measures the percentage of each sales dollar remaining after all costs and expenses, including interest, taxes, and preferred stock dividends, have been deducted.
  • 53.
    Copyright © 2009Pearson Prentice Hall. All rights reserved. 2-53 EPS = Earnings Available to Common Stockholders Number of Shares Outstanding EPS = $221,000/76,262 = $2.90 Ratio Analysis (cont.) • Profitability Ratios – Earnings Per Share (EPS)
  • 54.
    Copyright © 2009Pearson Prentice Hall. All rights reserved. 2-54 ROA = Earnings Available to Common Stockholders Total Assets ROA = $221,000/$3,597,000 = 6.1% Ratio Analysis (cont.) • Profitability Ratios – Return on Total Assets (ROA) The higher the firm’s return on total assets, the better.
  • 55.
    Copyright © 2009Pearson Prentice Hall. All rights reserved. 2-55 ROE = $221,000/$1,754,000 = 12.6% ROE = Earnings Available to Common Stockholders Total Equity Ratio Analysis (cont.) • Profitability Ratios – Return on Equity (ROE) It measure the return earned on the common stockholders’ investment in the firm. • The higher this return, the better off are the owners.
  • 56.
    Copyright © 2009Pearson Prentice Hall. All rights reserved. 2-56 P/E = Market Price Per Share of Common Stock Earnings Per Share P/E = $32.25/$2.90 = 11.1 Ratio Analysis (cont.) Market Ratios – Price Earnings (P/E) Ratio The P/E ratio measures the amount that investors are willing to pay for each dollar of a firm’s earnings. • It indicates the degree of confidence that investors have in the firm’s future performance.
  • 57.
    Copyright © 2009Pearson Prentice Hall. All rights reserved. 2-57 M/B Ratio = Market price per share of common stock Book value per share of common stock M/B Ratio = $32.25/$23.00 = 1.40 Ratio Analysis (cont.) • Market Ratios – Market/Book (M/B) Ratio It provides an assessment of how investors view the firm’s performance. It means that investors are currently paying $1.40 for each $1.00 of book value of the company’s stock.
  • 58.
    Copyright © 2009Pearson Prentice Hall. All rights reserved. 2-58 Summarizing All Ratios Table 2.8 Summary of Bartlett Company Ratios (2007–2009, Including 2009 Industry Averages)
  • 59.
    Copyright © 2009Pearson Prentice Hall. All rights reserved. 2-59 Summarizing All Ratios (cont.) Table 2.8 Summary of Bartlett Company Ratios (2007–2009, Including 2009 Industry Averages)
  • 60.
    Copyright © 2009Pearson Prentice Hall. All rights reserved. 2-60 DuPont System of Analysis • The DuPont system of analysis is used to dissect the firm’s financial statements and to assess its financial condition. • It merges the income statement and balance sheet into two summary measures of profitability. • The Modified DuPont Formula relates the firm’s ROA to its ROE using the financial leverage multiplier (FLM), which is the ratio of total assets to common stock equity: • ROA and ROE as shown in the series of equations on the following slide and in Figure 2.2 on the following slide.
  • 61.
    Copyright © 2009Pearson Prentice Hall. All rights reserved. 2-61 DuPont System of Analysis
  • 62.
    Copyright © 2009Pearson Prentice Hall. All rights reserved. 2-62 DuPont System of Analysis (cont.) Figure 2.2 DuPont System of Analysis
  • 63.
    Copyright © 2009Pearson Prentice Hall. All rights reserved. 2-63 ROE = 6.1% X 2.06 = 12.6% Modified DuPont Formula (cont.) • Use of the FLM to convert ROA into ROE reflects the impact of financial leverage on the owner’s return. • Substituting the values for Bartlett Company’s ROA of 6.1 percent calculated earlier, and Bartlett’s FLM of 2.06 ($3,597,000 total assets ÷ $1,754,000 common stock equity) into the Modified DuPont formula yields:

Editor's Notes

  • #12 This fundamental relationship must always exist, because the assets represent the things owned by the organization, and the liabilities and equity indicate how much was supplied by both creditors and owners
  • #13 Accounts Receivable: Money owned to the company by debtors, generally for the purchase of goods and services. Inventories: The value of products that have been completed and are in storage waiting to be sold (finished goods), products that have been partially completed (work in process), and raw materials. Prepaid Expenses: The value of items that the company has paid for in advance, such as insurance premiums.
  • #14 Accounts Receivable: Money owned to the company by debtors, generally for the purchase of goods and services. Inventories: The value of products that have been completed and are in storage waiting to be sold (finished goods), products that have been partially completed (work in process), and raw materials. Prepaid Expenses: The value of items that the company has paid for in advance, such as insurance premiums.