Page
14-2
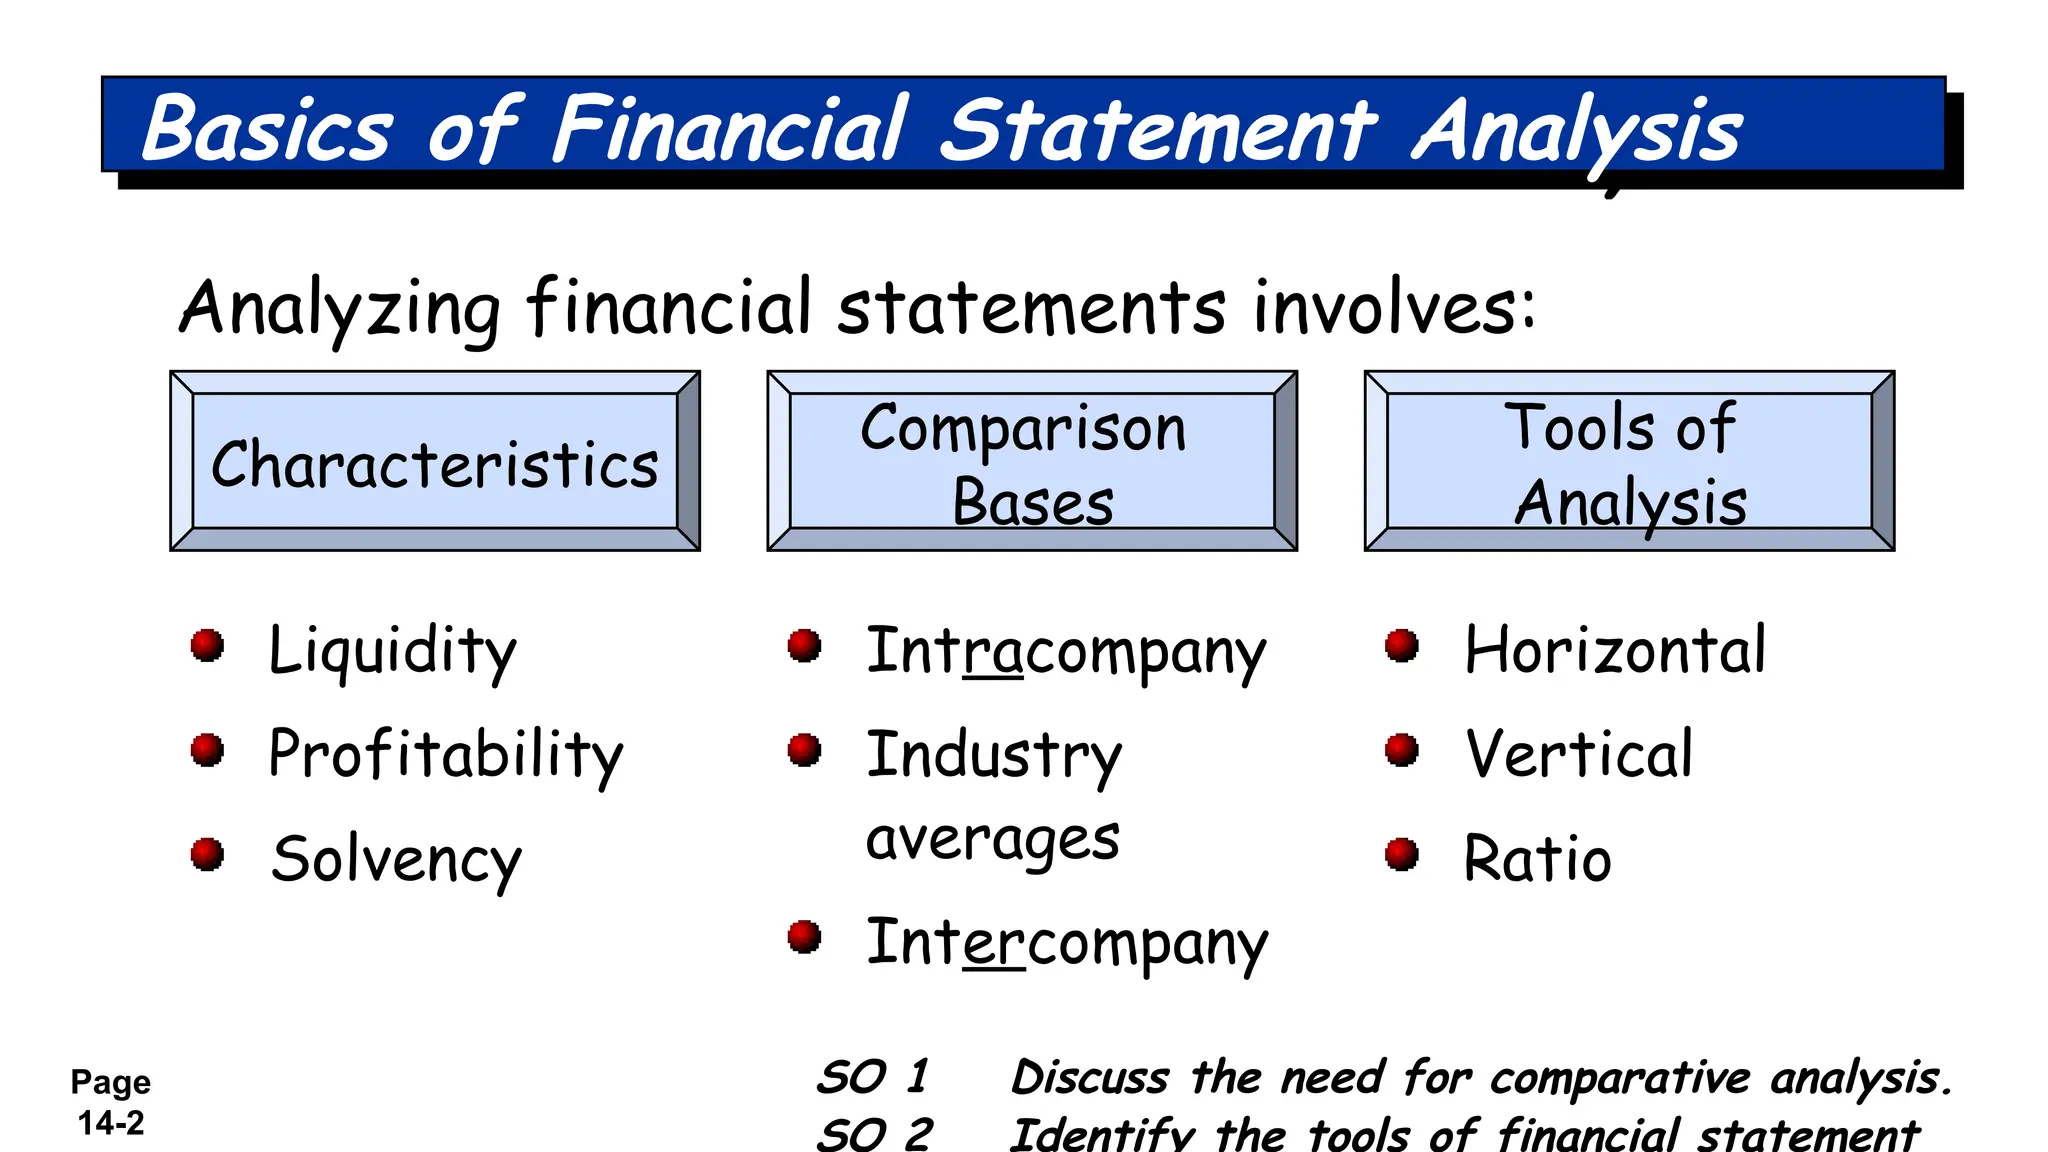
Analyzing financial statementsinvolves:
Basics of Financial Statement Analysis
Characteristics
Comparison
Bases
Tools of
Analysis
Liquidity
Profitability
Solvency
Intracompany
Industry
averages
Intercompany
Horizontal
Vertical
Ratio
SO 1 Discuss the need for comparative analysis.
SO 2 Identify the tools of financial statement
3.
Page
14-3 SO 3Explain and apply horizontal analysis.
Horizontal Analysis
Horizontal analysis, also called trend analysis, is a
technique for evaluating a series of financial
statement data over a period of time.
Its purpose is to determine the increase or decrease
that has taken place.
Horizontal analysis is commonly applied to the balance
sheet, income statement, and statement of retained
earnings.
4.
Page
14-4 SO 3Explain and apply horizontal analysis.
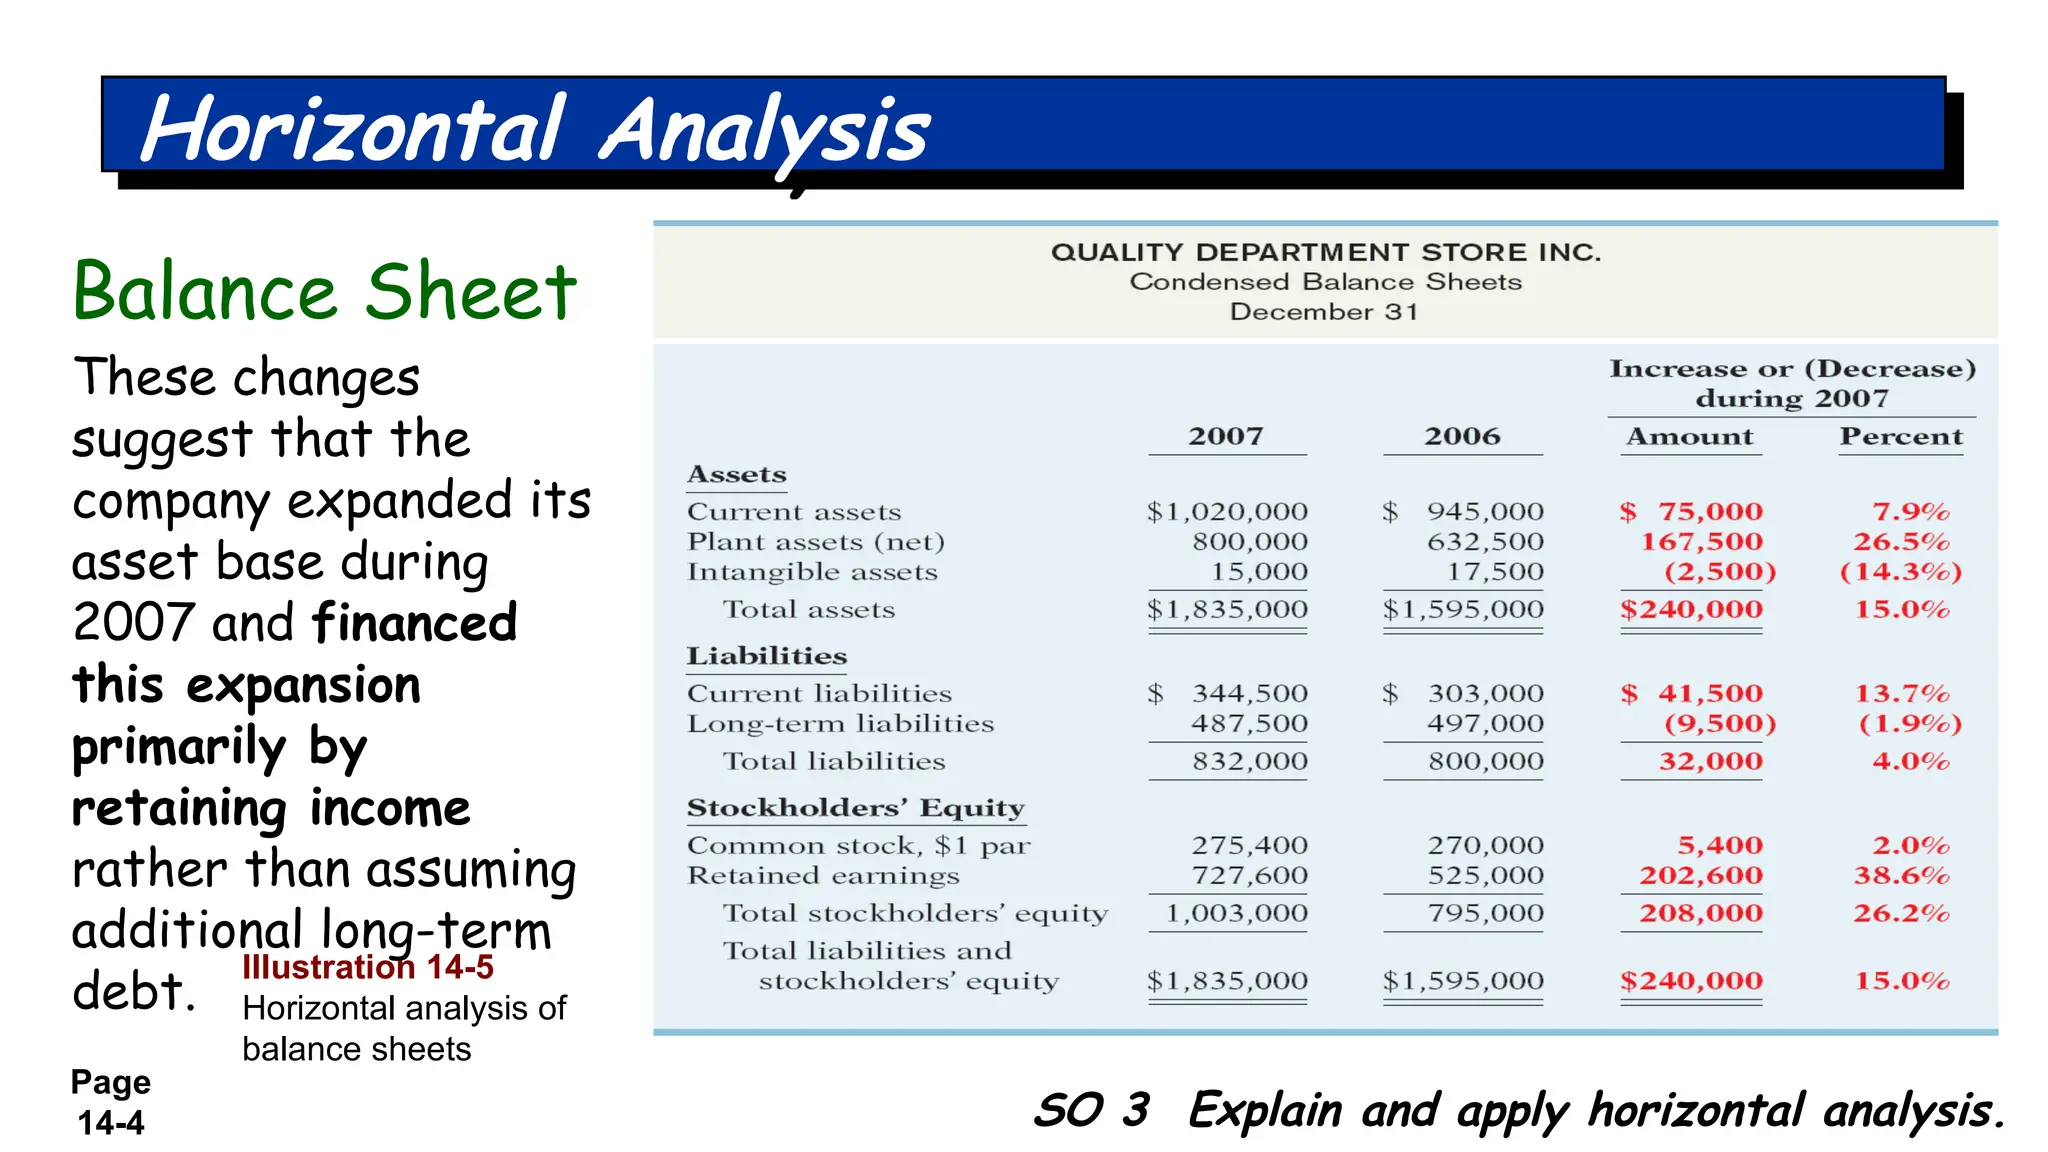
These changes
suggest that the
company expanded its
asset base during
2007 and financed
this expansion
primarily by
retaining income
rather than assuming
additional long-term
debt.
Horizontal Analysis
Balance Sheet
Illustration 14-5
Horizontal analysis of
balance sheets
5.
Page
14-5 SO 3Explain and apply horizontal analysis.
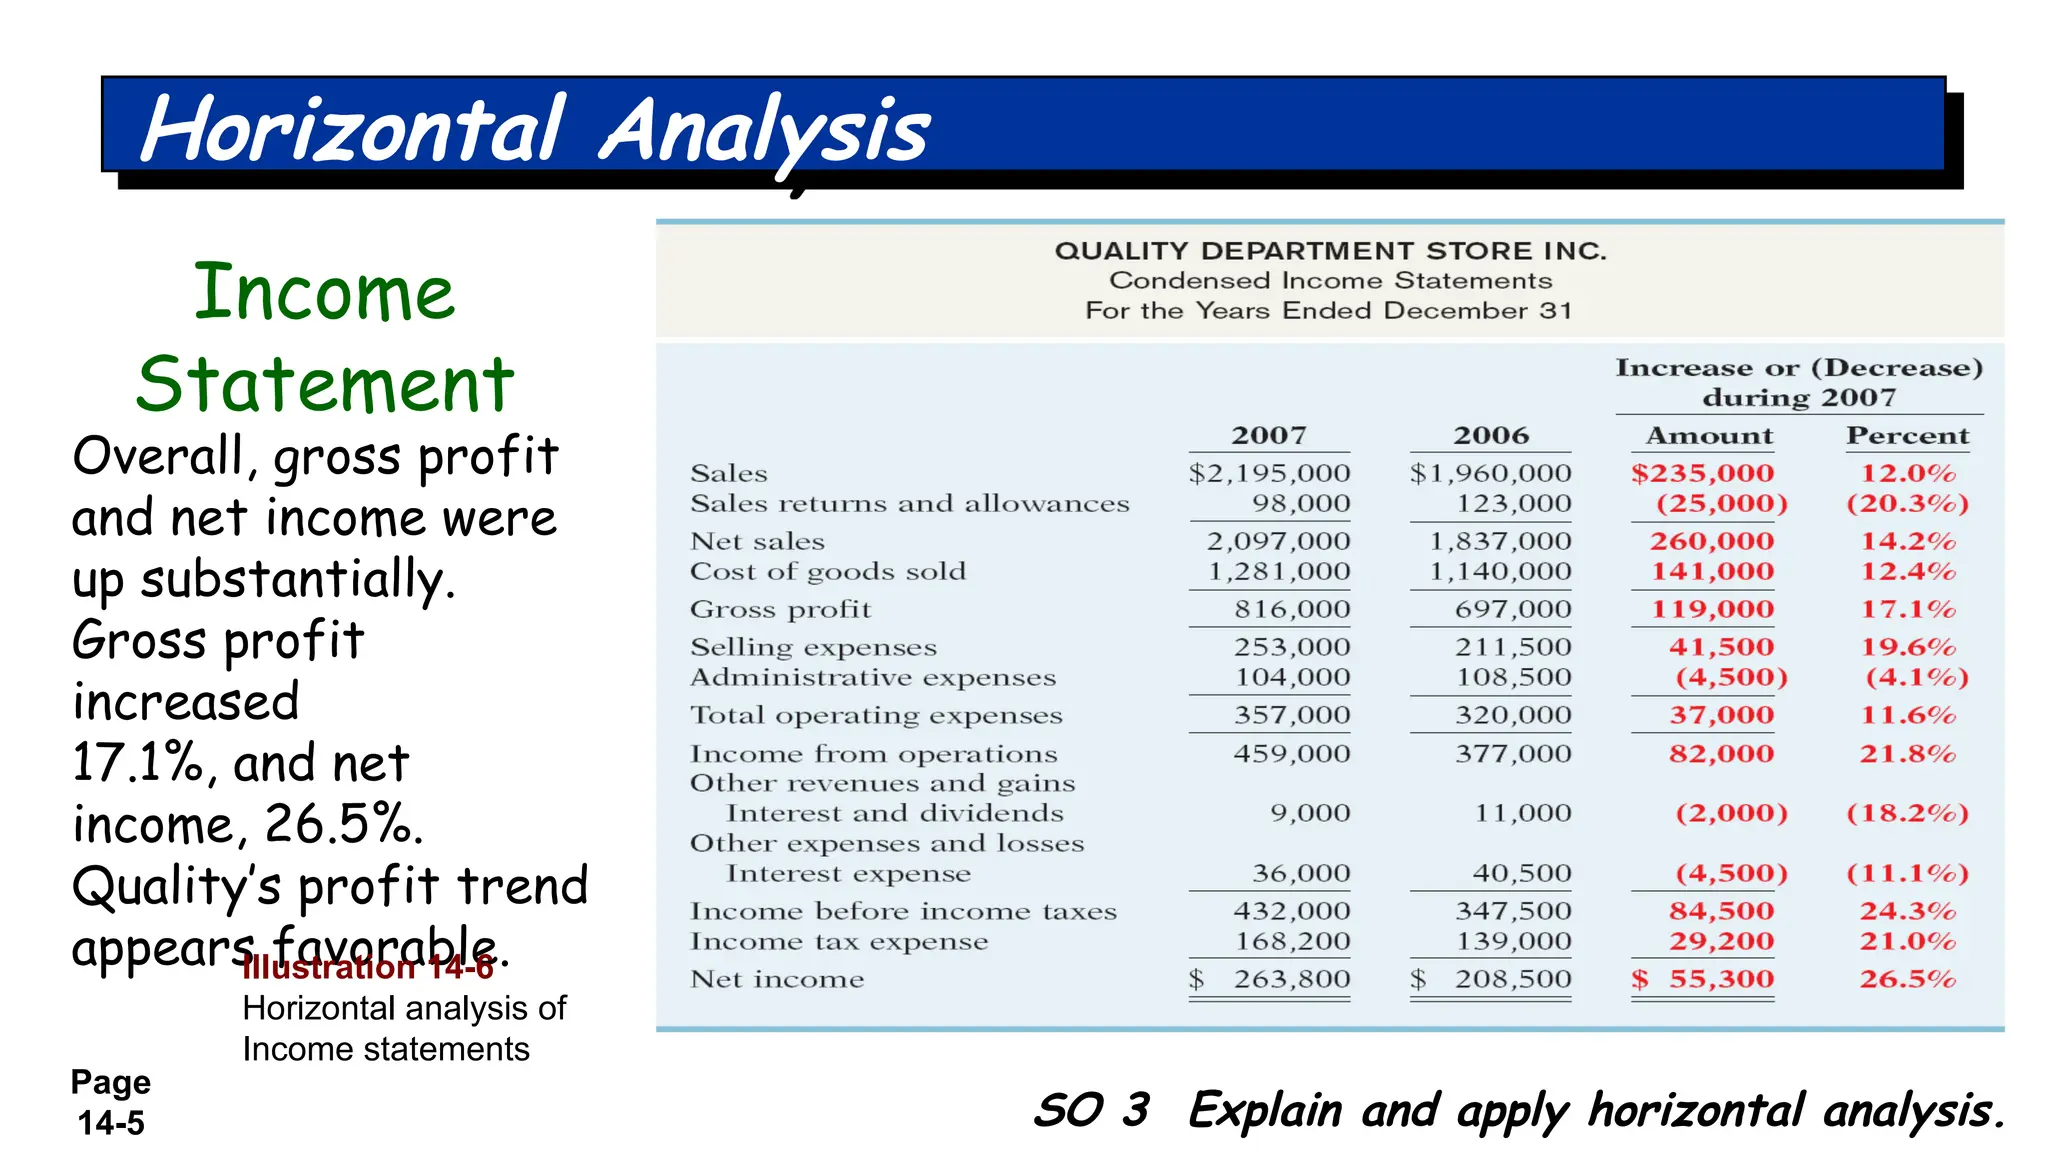
Overall, gross profit
and net income were
up substantially.
Gross profit
increased
17.1%, and net
income, 26.5%.
Quality’s profit trend
appears favorable.
Horizontal Analysis
Income
Statement
Illustration 14-6
Horizontal analysis of
Income statements
6.
Page
14-6 SO 3Explain and apply horizontal analysis.
We saw in the horizontal analysis of the balance sheet that ending retained
earnings increased 38.6%. As indicated earlier, the company retained a
significant portion of net income to finance additional plant facilities.
Horizontal Analysis
Illustration 14-7
Horizontal analysis of
retained earnings
statements
Retained
Earnings
Statement
7.
Page
14-7
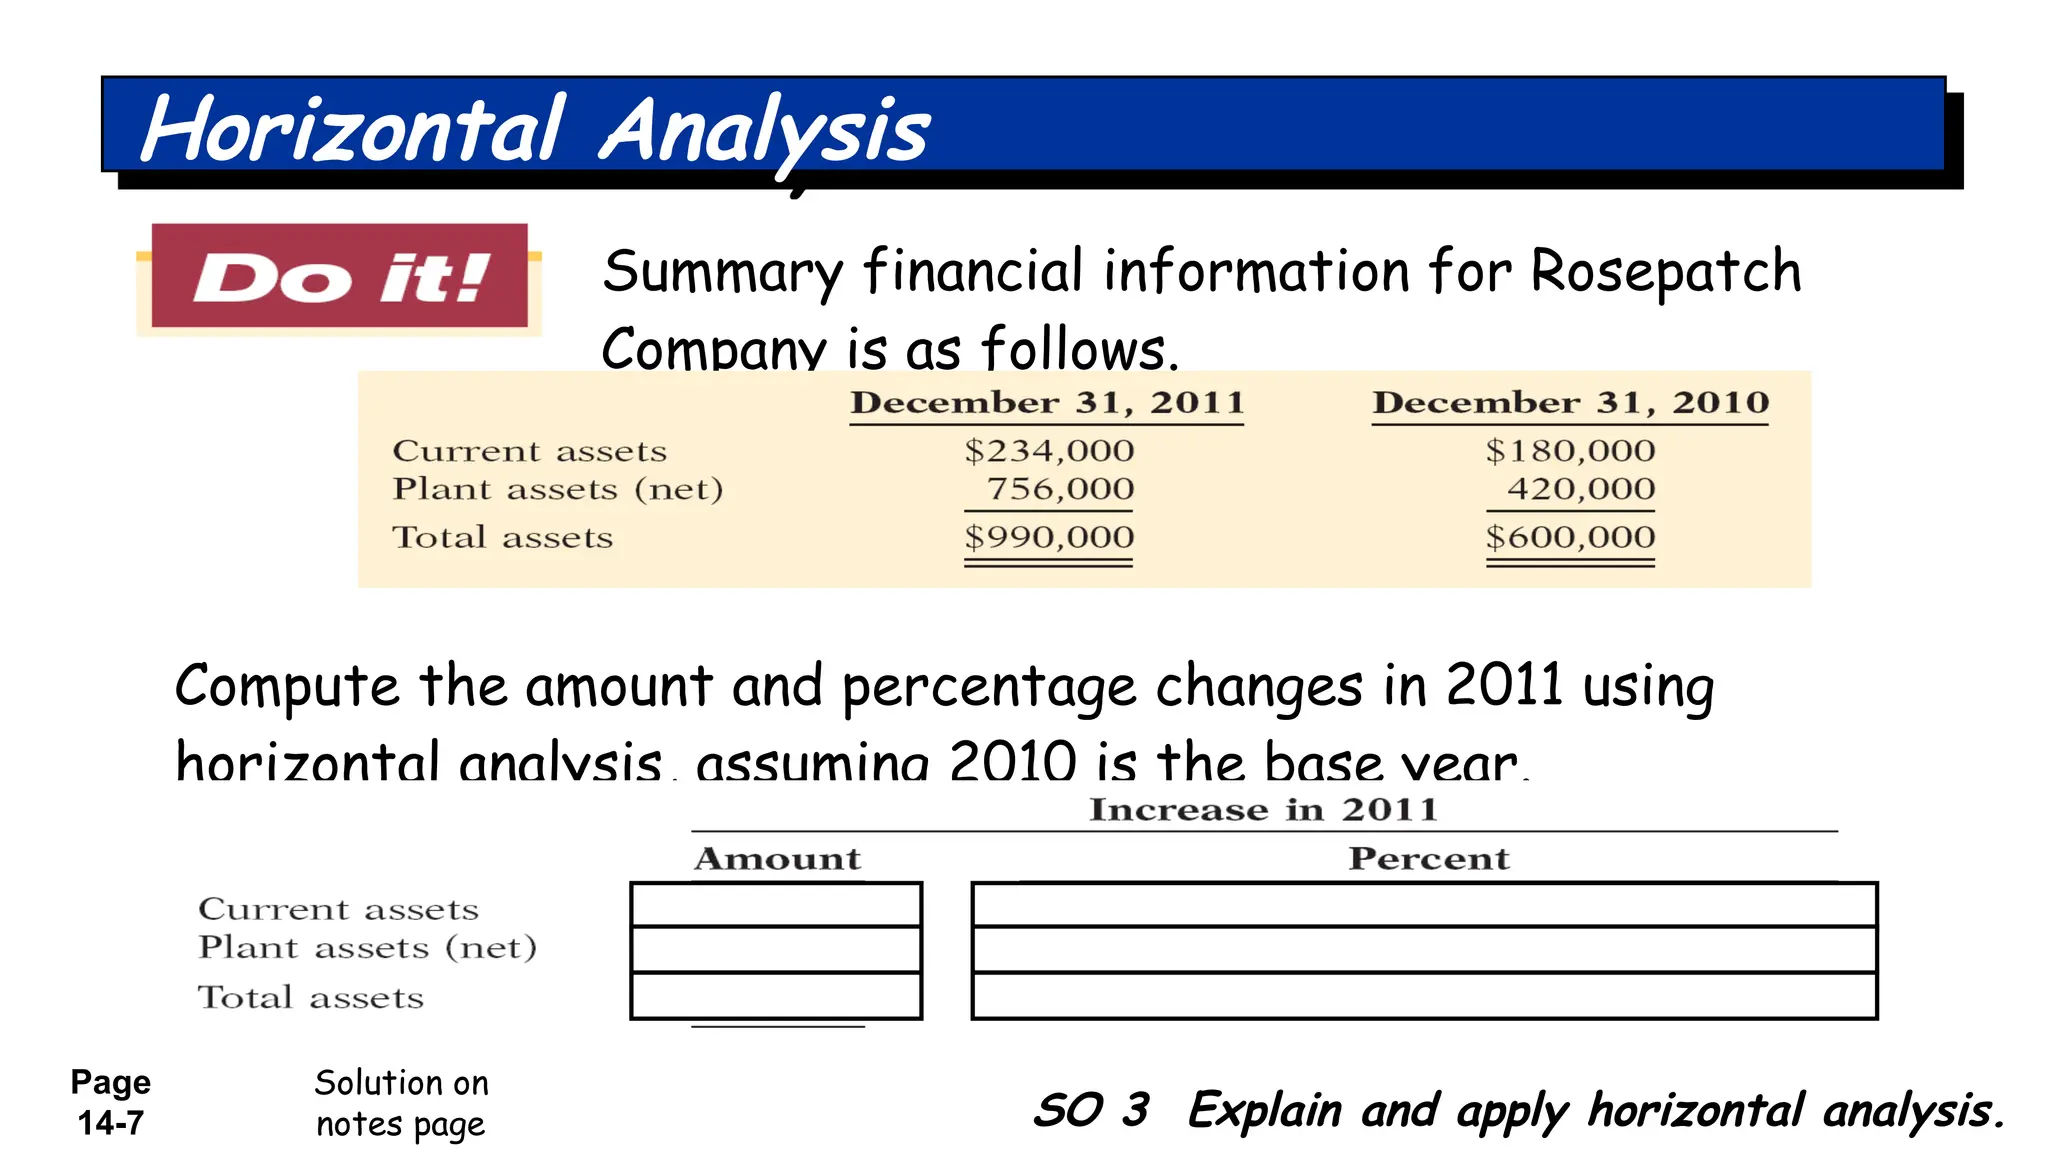
Summary financial informationfor Rosepatch
Company is as follows.
Solution on
notes page SO 3 Explain and apply horizontal analysis.
Horizontal Analysis
Compute the amount and percentage changes in 2011 using
horizontal analysis, assuming 2010 is the base year.
8.
Page
14-8 SO 4Describe and apply vertical analysis.
Vertical Analysis
Vertical analysis, also called common-size analysis, is
a technique that expresses each financial statement
item as a percent of a base amount.
On an income statement, we might say that selling
expenses are 16% of net sales.
Vertical analysis is commonly applied to the balance
sheet and the income statement.
9.
Page
14-9
These results
reinforce the
earlierobservations
that Quality is
choosing to finance
its growth through
retention of
earnings rather
than through
issuing additional
debt.
Balance Sheet
Illustration 14-8
Vertical analysis of
balance sheets
SO 4 Describe and apply vertical analysis.
Vertical Analysis
10.
Page
14-10
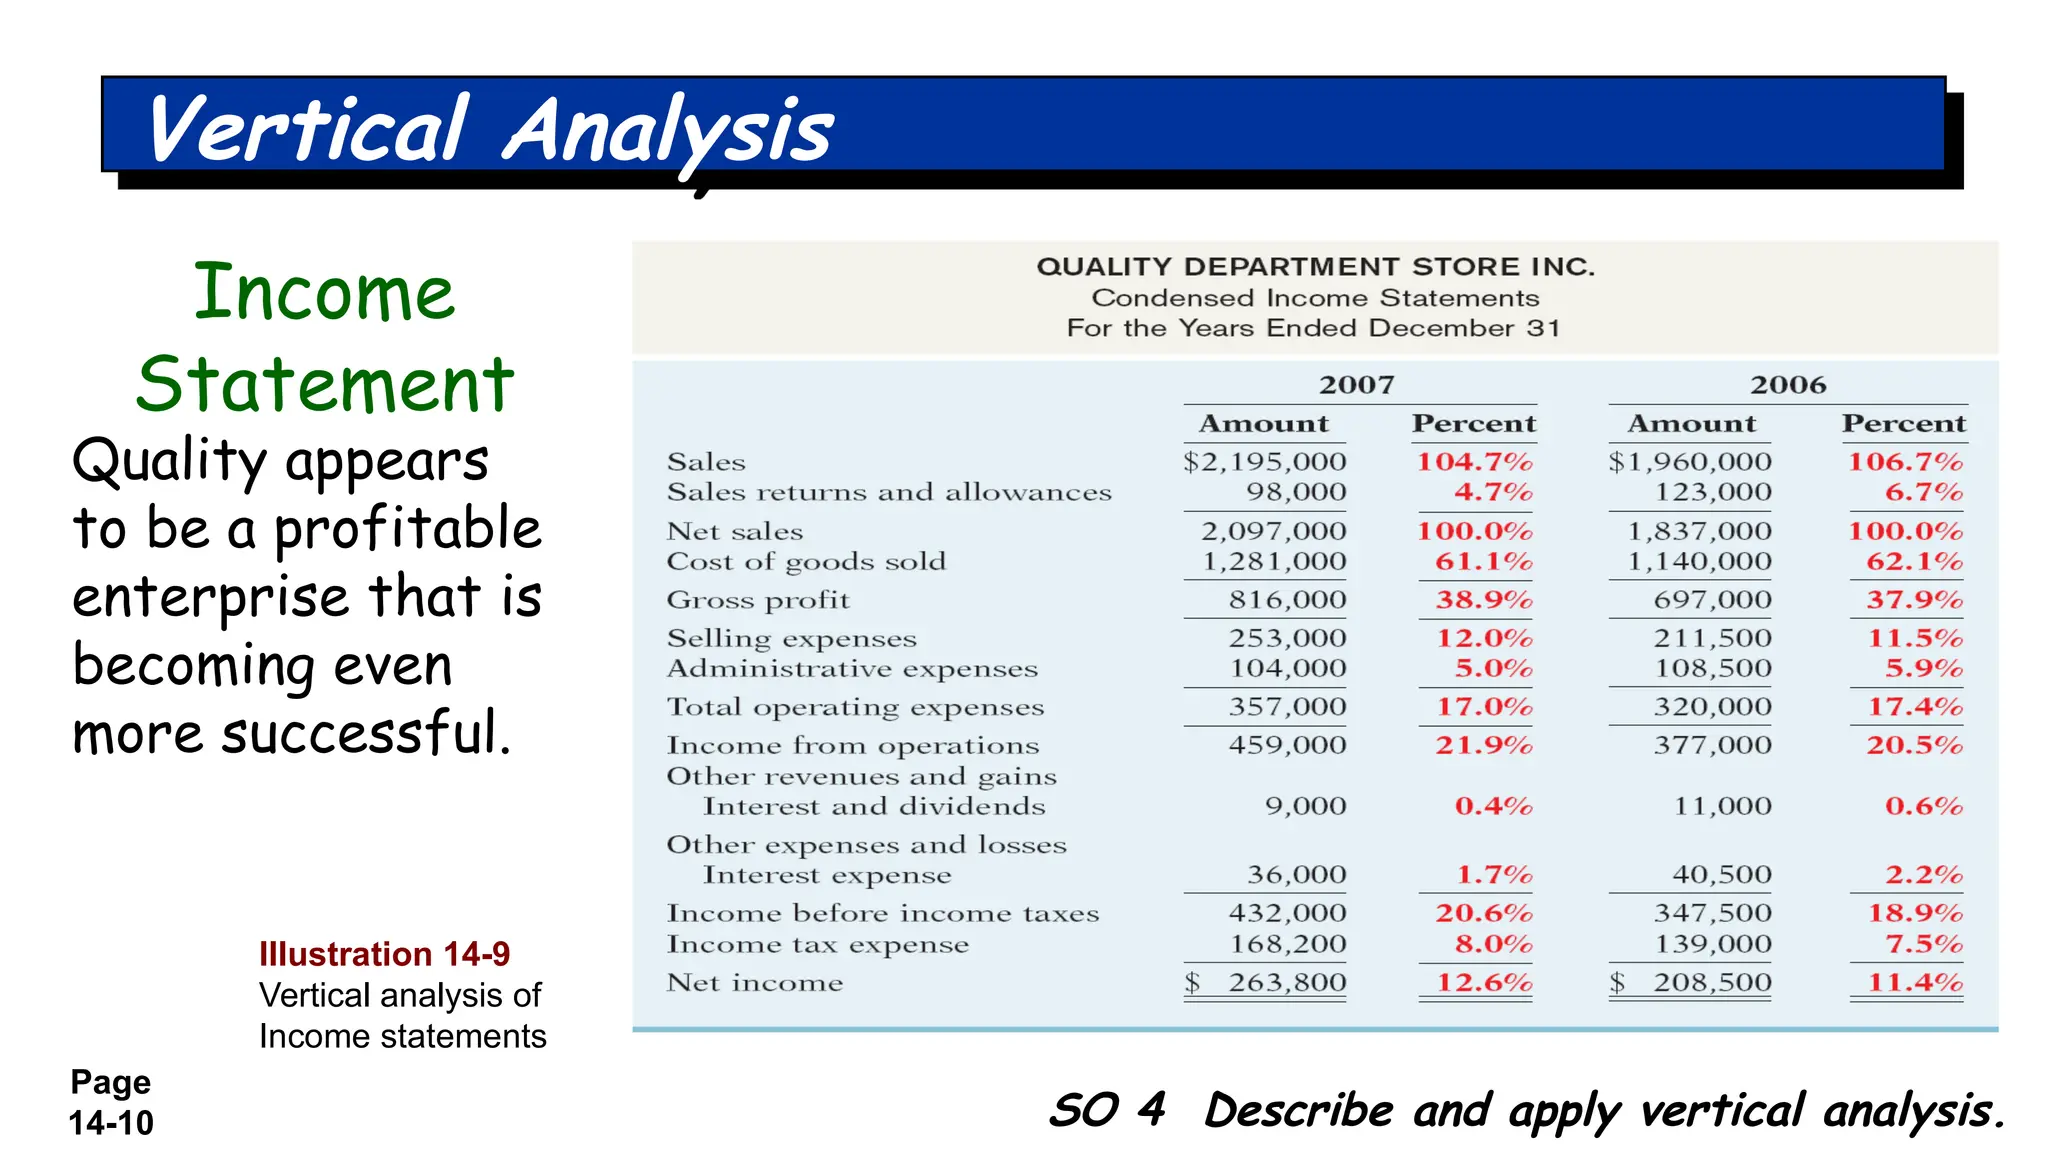
Quality appears
to bea profitable
enterprise that is
becoming even
more successful.
Income
Statement
Illustration 14-9
Vertical analysis of
Income statements
SO 4 Describe and apply vertical analysis.
Vertical Analysis
11.
Page
14-11
Enables a comparisonof companies of different sizes.
Illustration 14-10
Intercompany income
statement comparison
SO 4 Describe and apply vertical analysis.
Vertical Analysis
J.C. Penney earned net income more than 4,208 times larger than Quality’s, J.C.
Penney’s net income as a percent of each sales dollar (5.6%) is only 44% of
Quality’s (12.6%).
12.
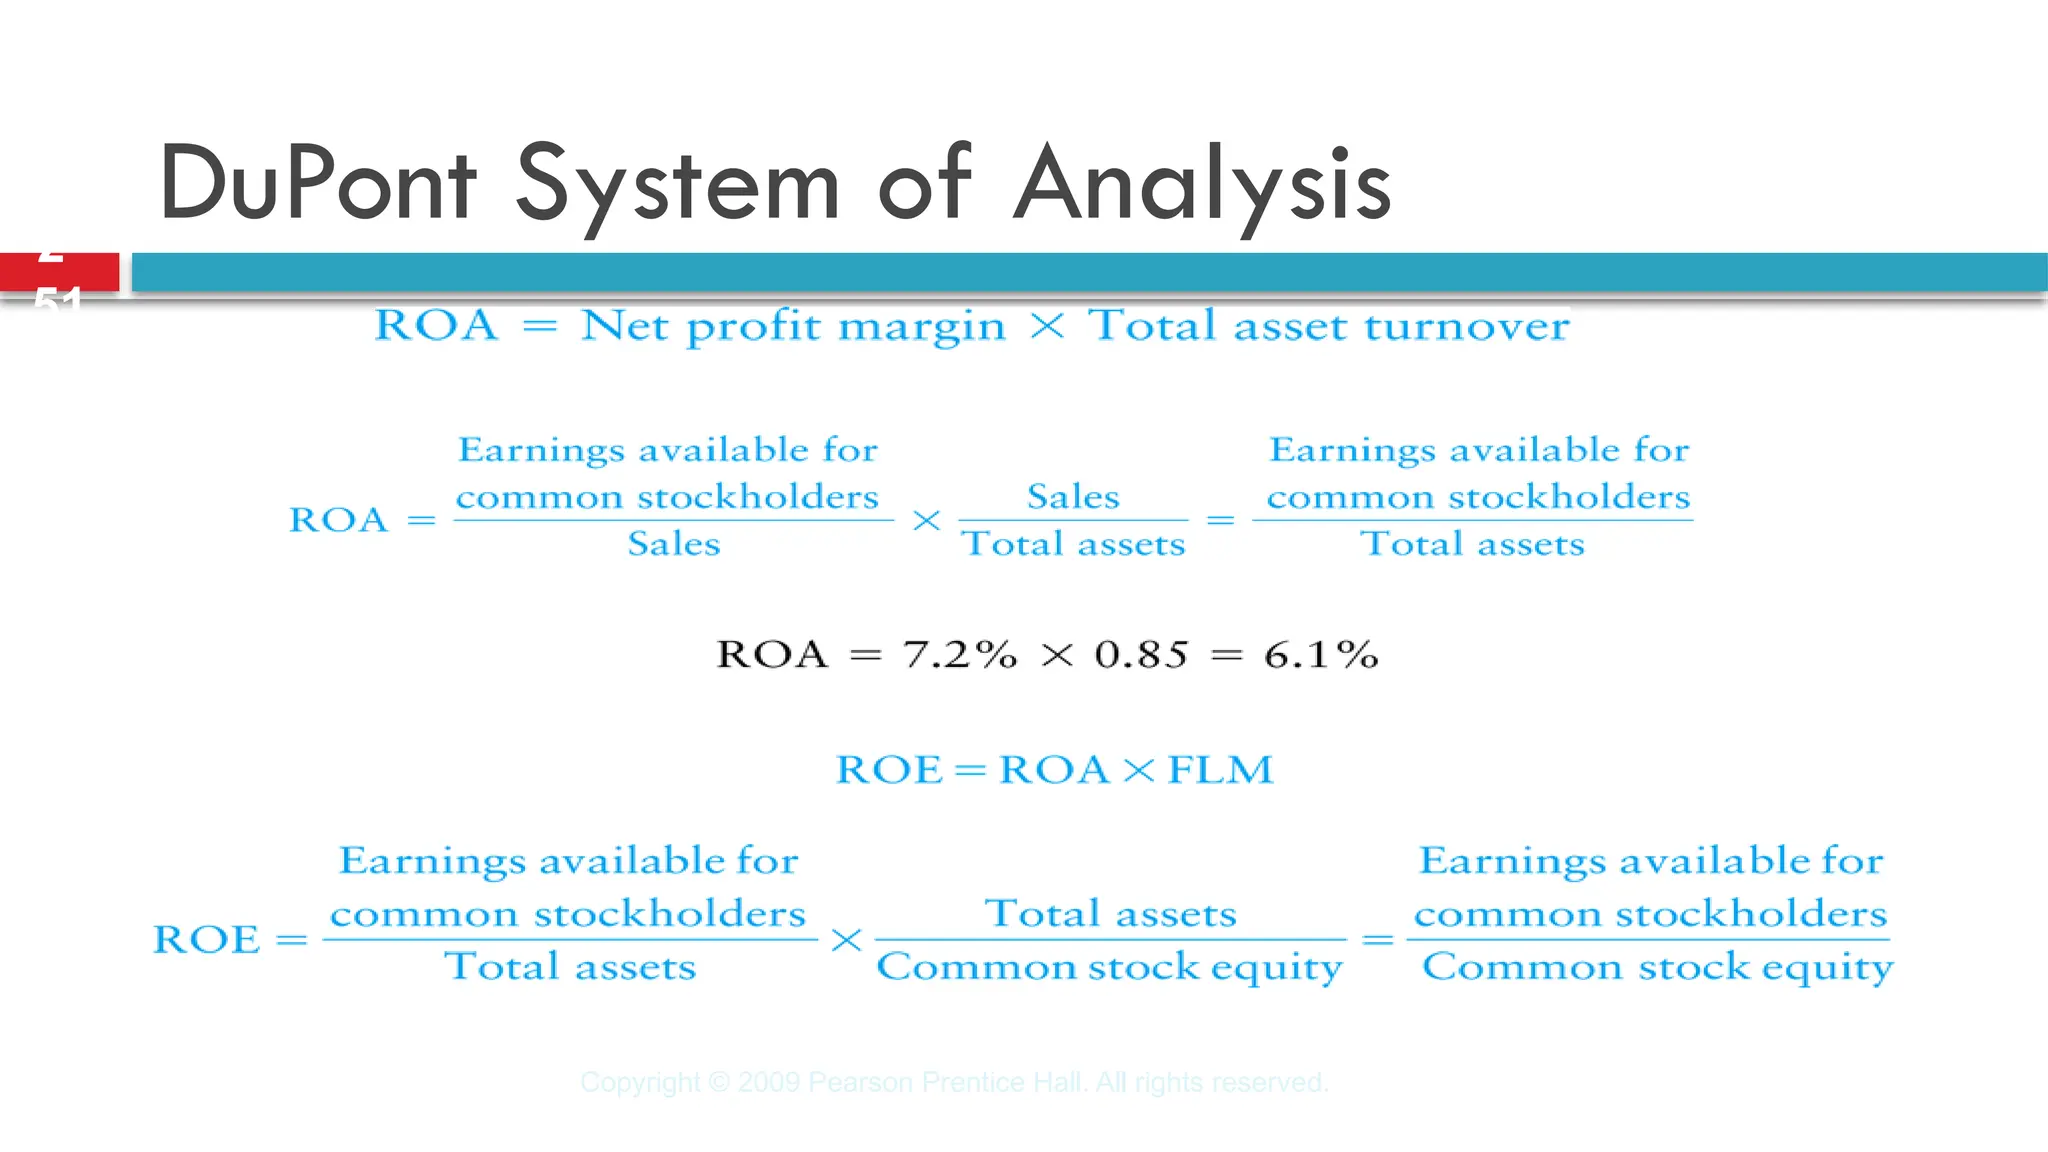
Basic Financial Analysis
Ratio analysis involves methods of
calculating and interpreting
financial ratios to assess a firm’s
financial condition and
performance.
It is of interest to shareholders,
creditors, and the firm’s own
management
13.
BASIC FINANCIAL ANALYSIS
Ratio analysis involves methods of calculating and
interpreting financial ratios to assess a firm’s
financial condition and performance.
It is of interest to shareholders, creditors, and the
firm’s own management
14.
Using Financial Ratios:
Typesof Ratio Comparisons
Trend or time-series analysis
Used to evaluate a firm’s performance
over time
Cross-sectional analysis
Used to compare different firms at the same point in
time
15.
Using Financial Ratios:
Typesof Ratio Comparisons (cont.)
Cross-sectional analysis
Industry comparative analysis
One specific type of cross sectional analysis. Used to compare one
firm’s financial performance to the industry’s average performance
Benchmarking
A type of cross sectional analysis in which the firm’s ratio values are
compared to those of a key competitor or group of competitors that it
wishes to emulate
16.
Using Financial Ratios:
Typesof Ratio Comparisons (cont.)
Trend or time-series analysis
Cross-sectional analysis
Combined Analysis
Combined analysis simply uses a combination of both
time series analysis and cross-sectional analysis
17.
Ratio Analysis
LiquidityRatios – measures capacity to meet short term
obligation
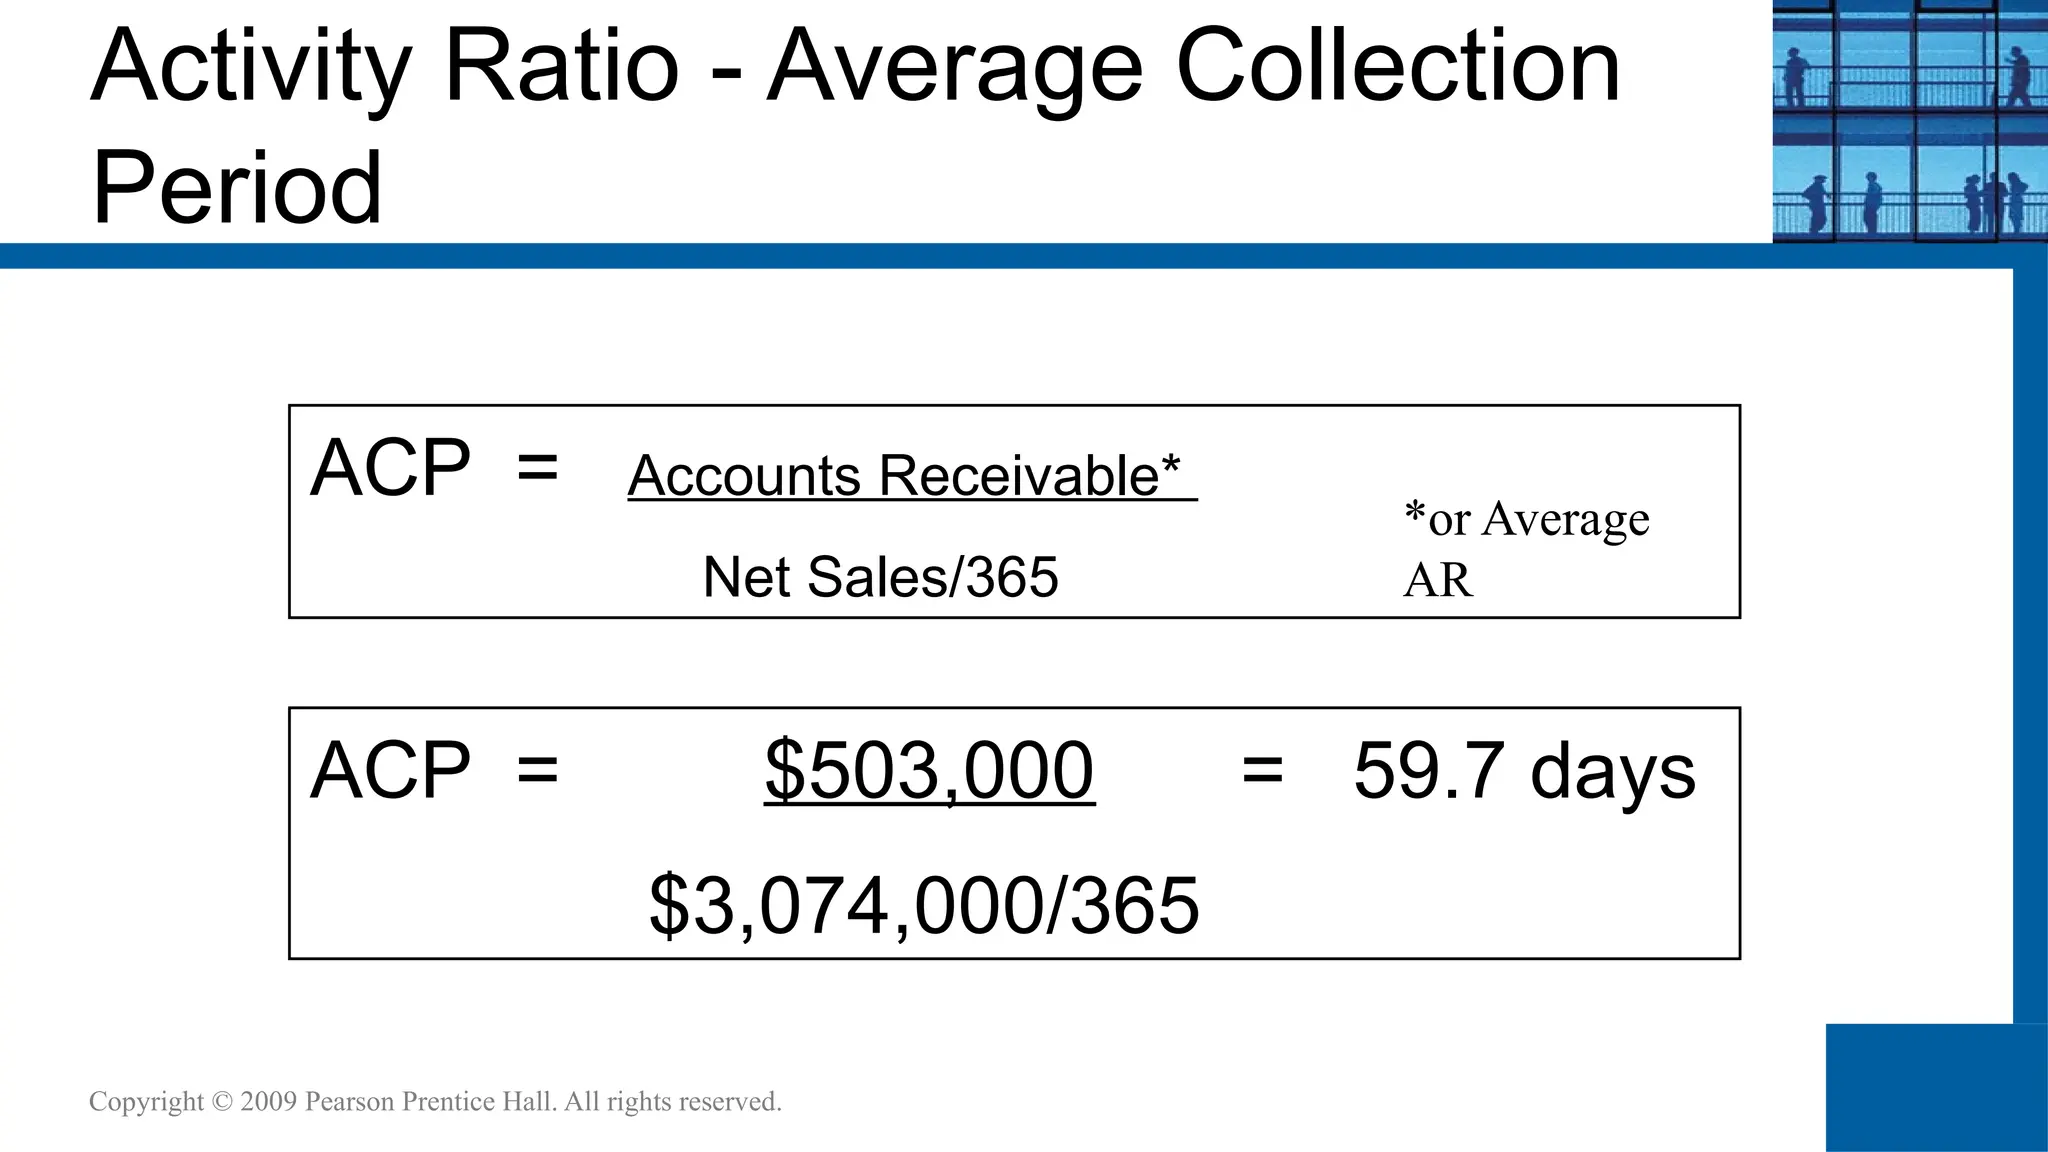
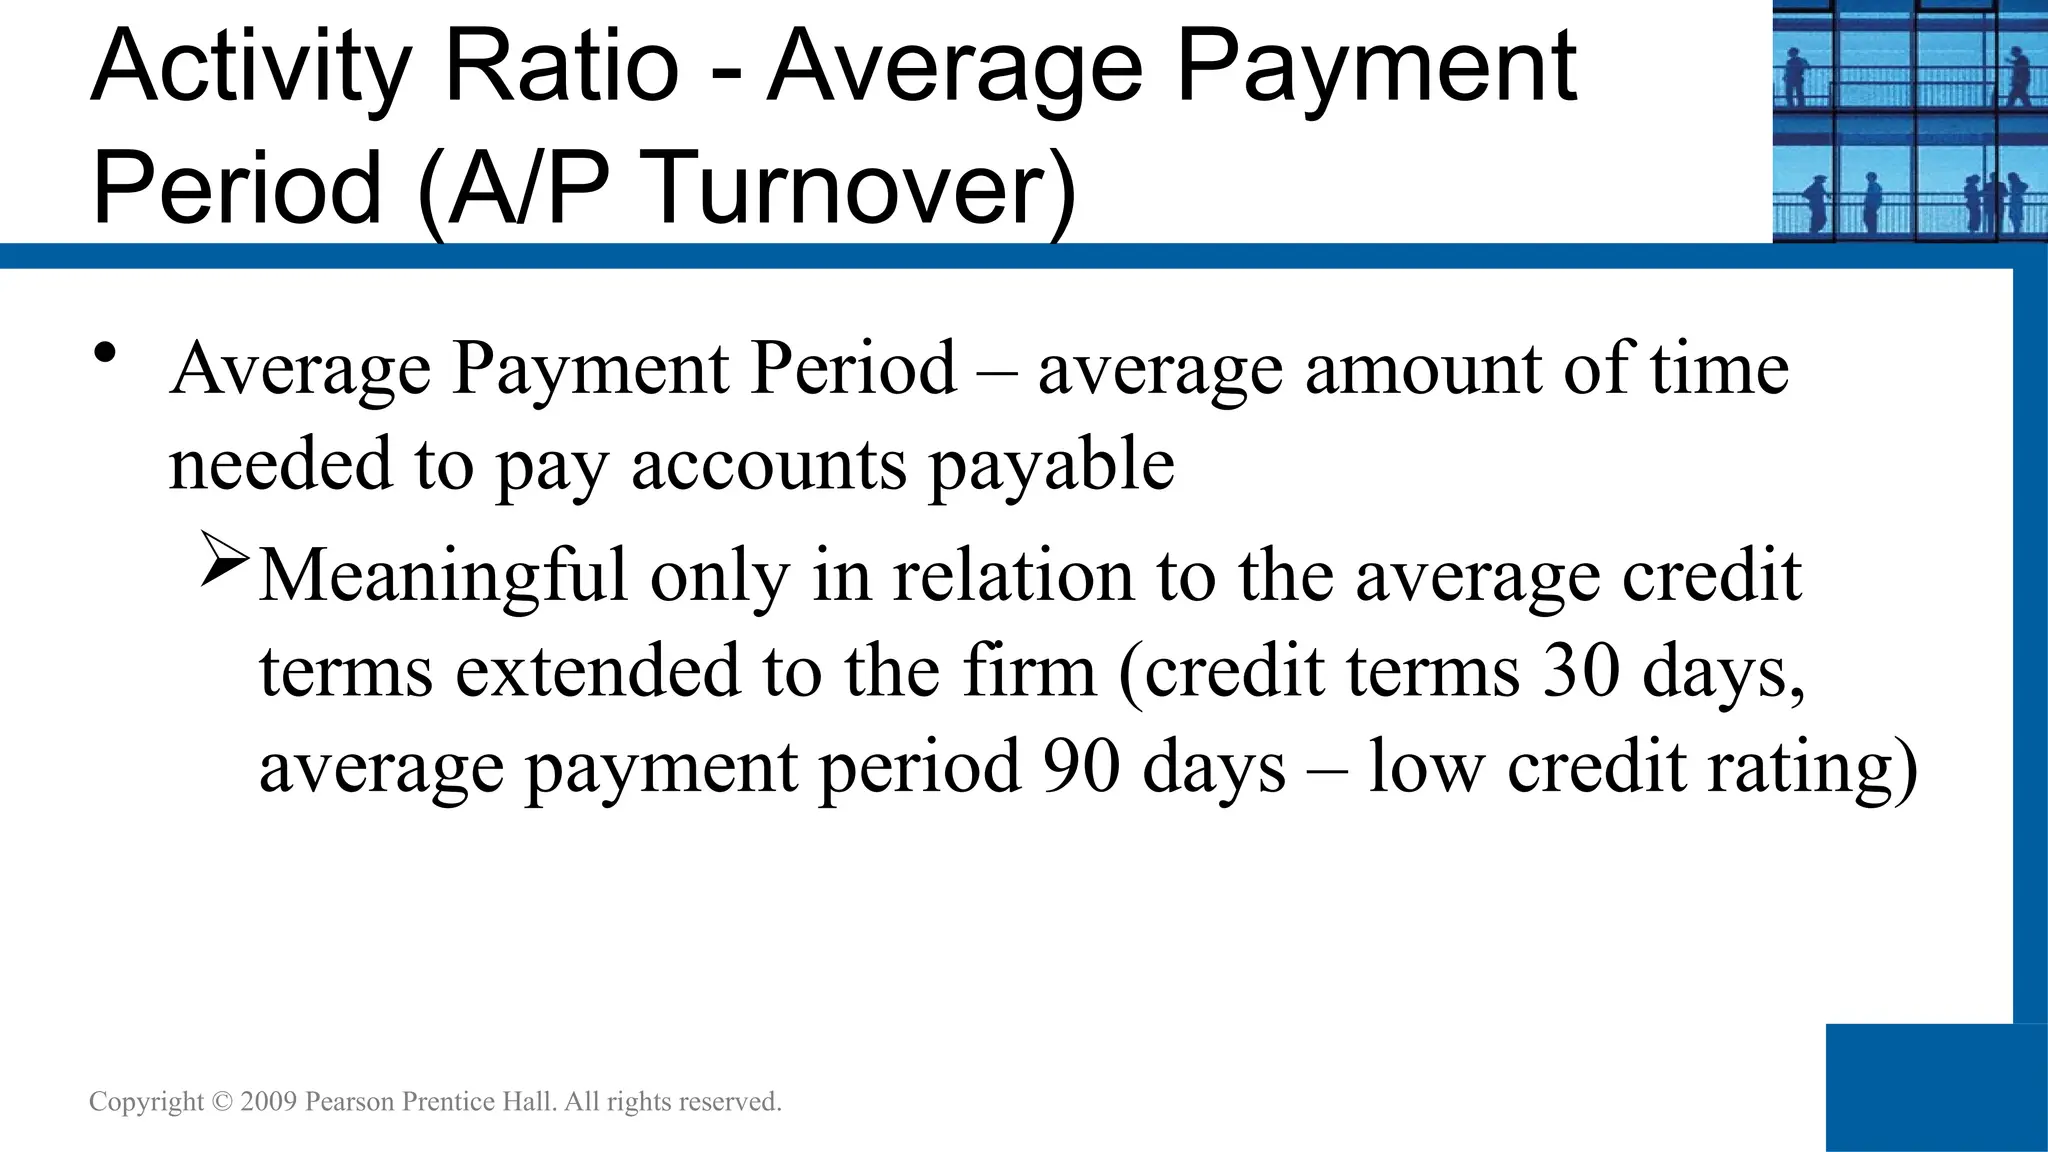
Activity Ratios – measures effective use of resources
Leverage (gearing) Ratios – measures indebtedness
Profitability Ratios – measures overall profitability
Market Ratios – measures based on market price of shares -
important to investors
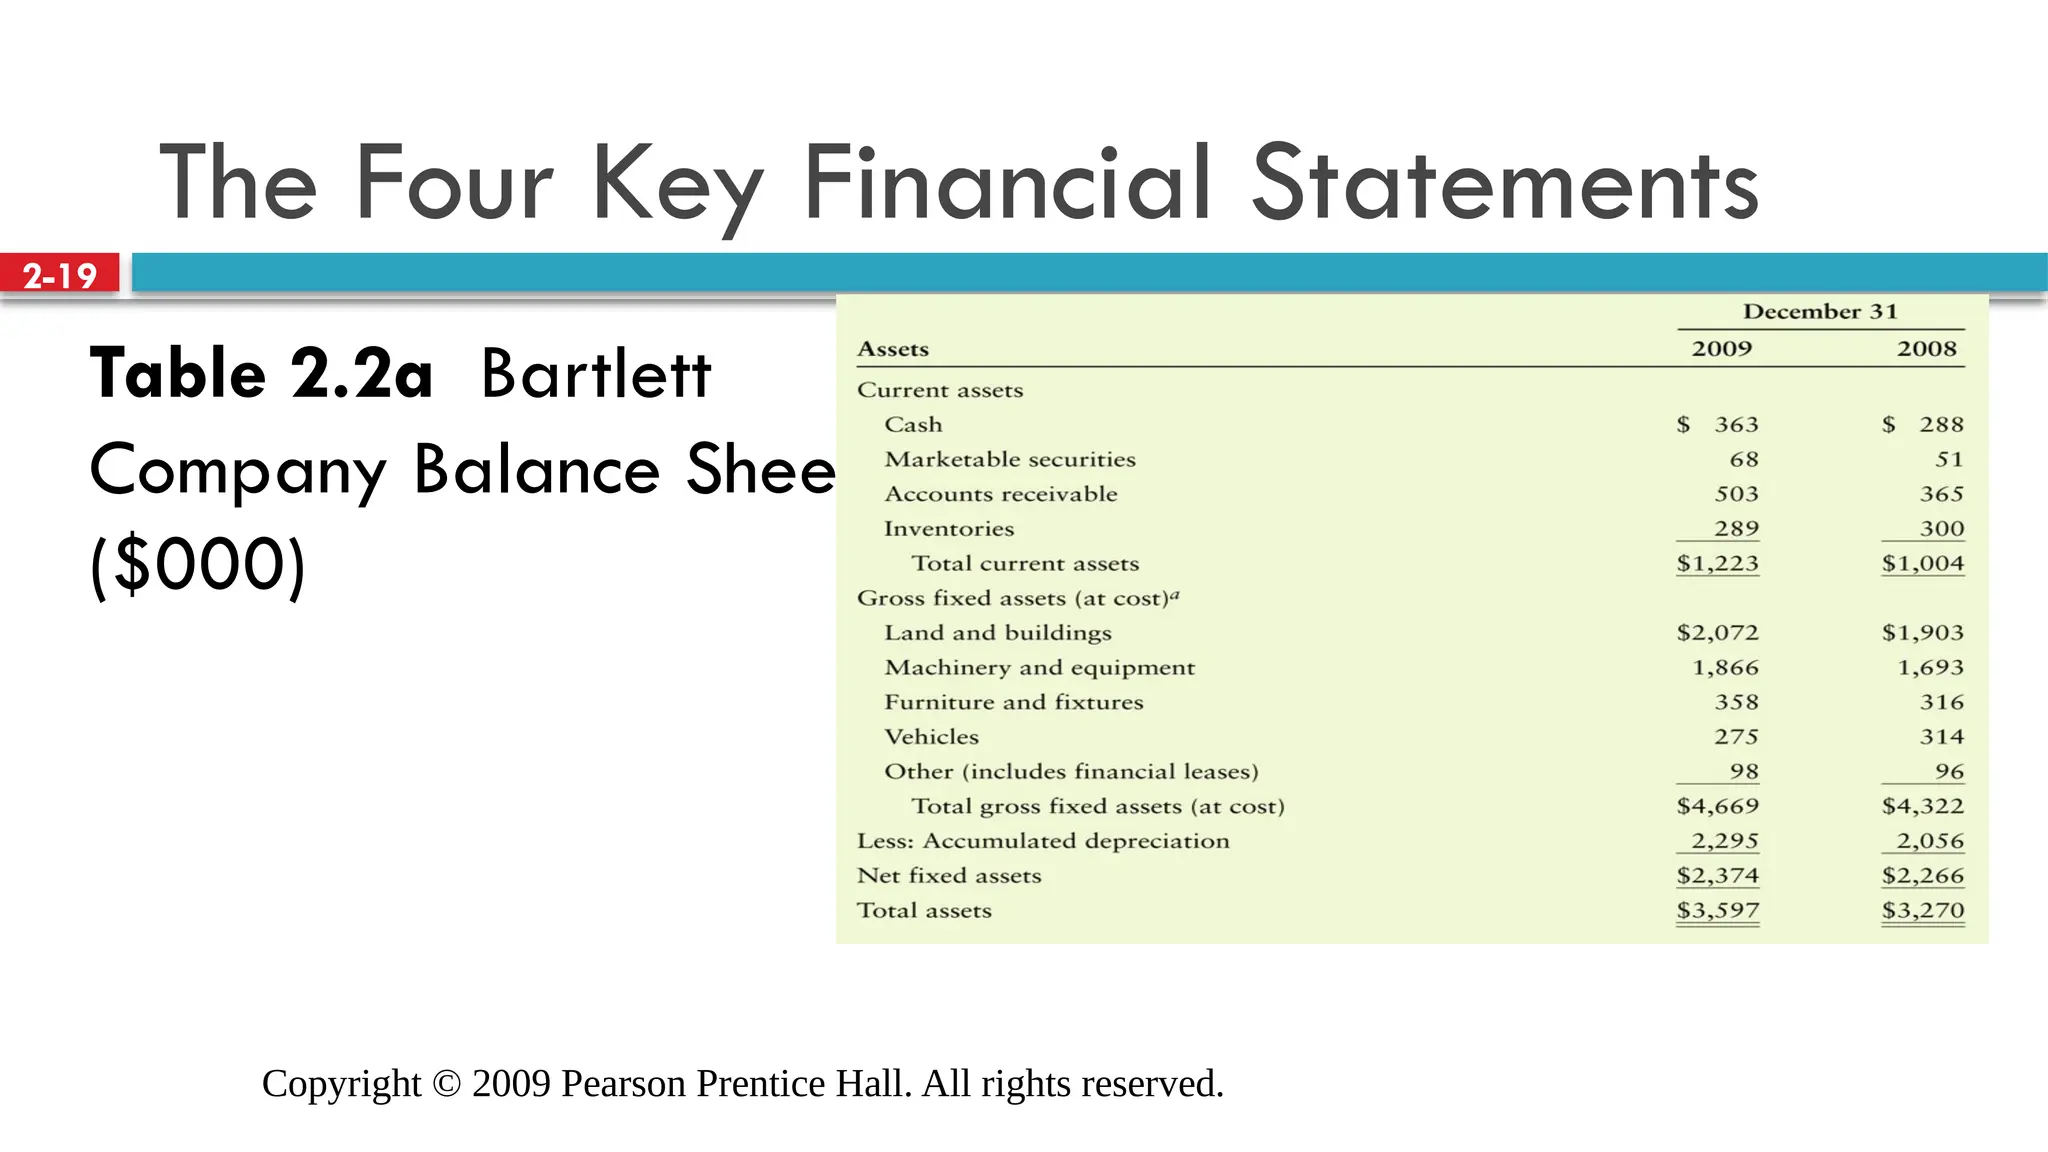
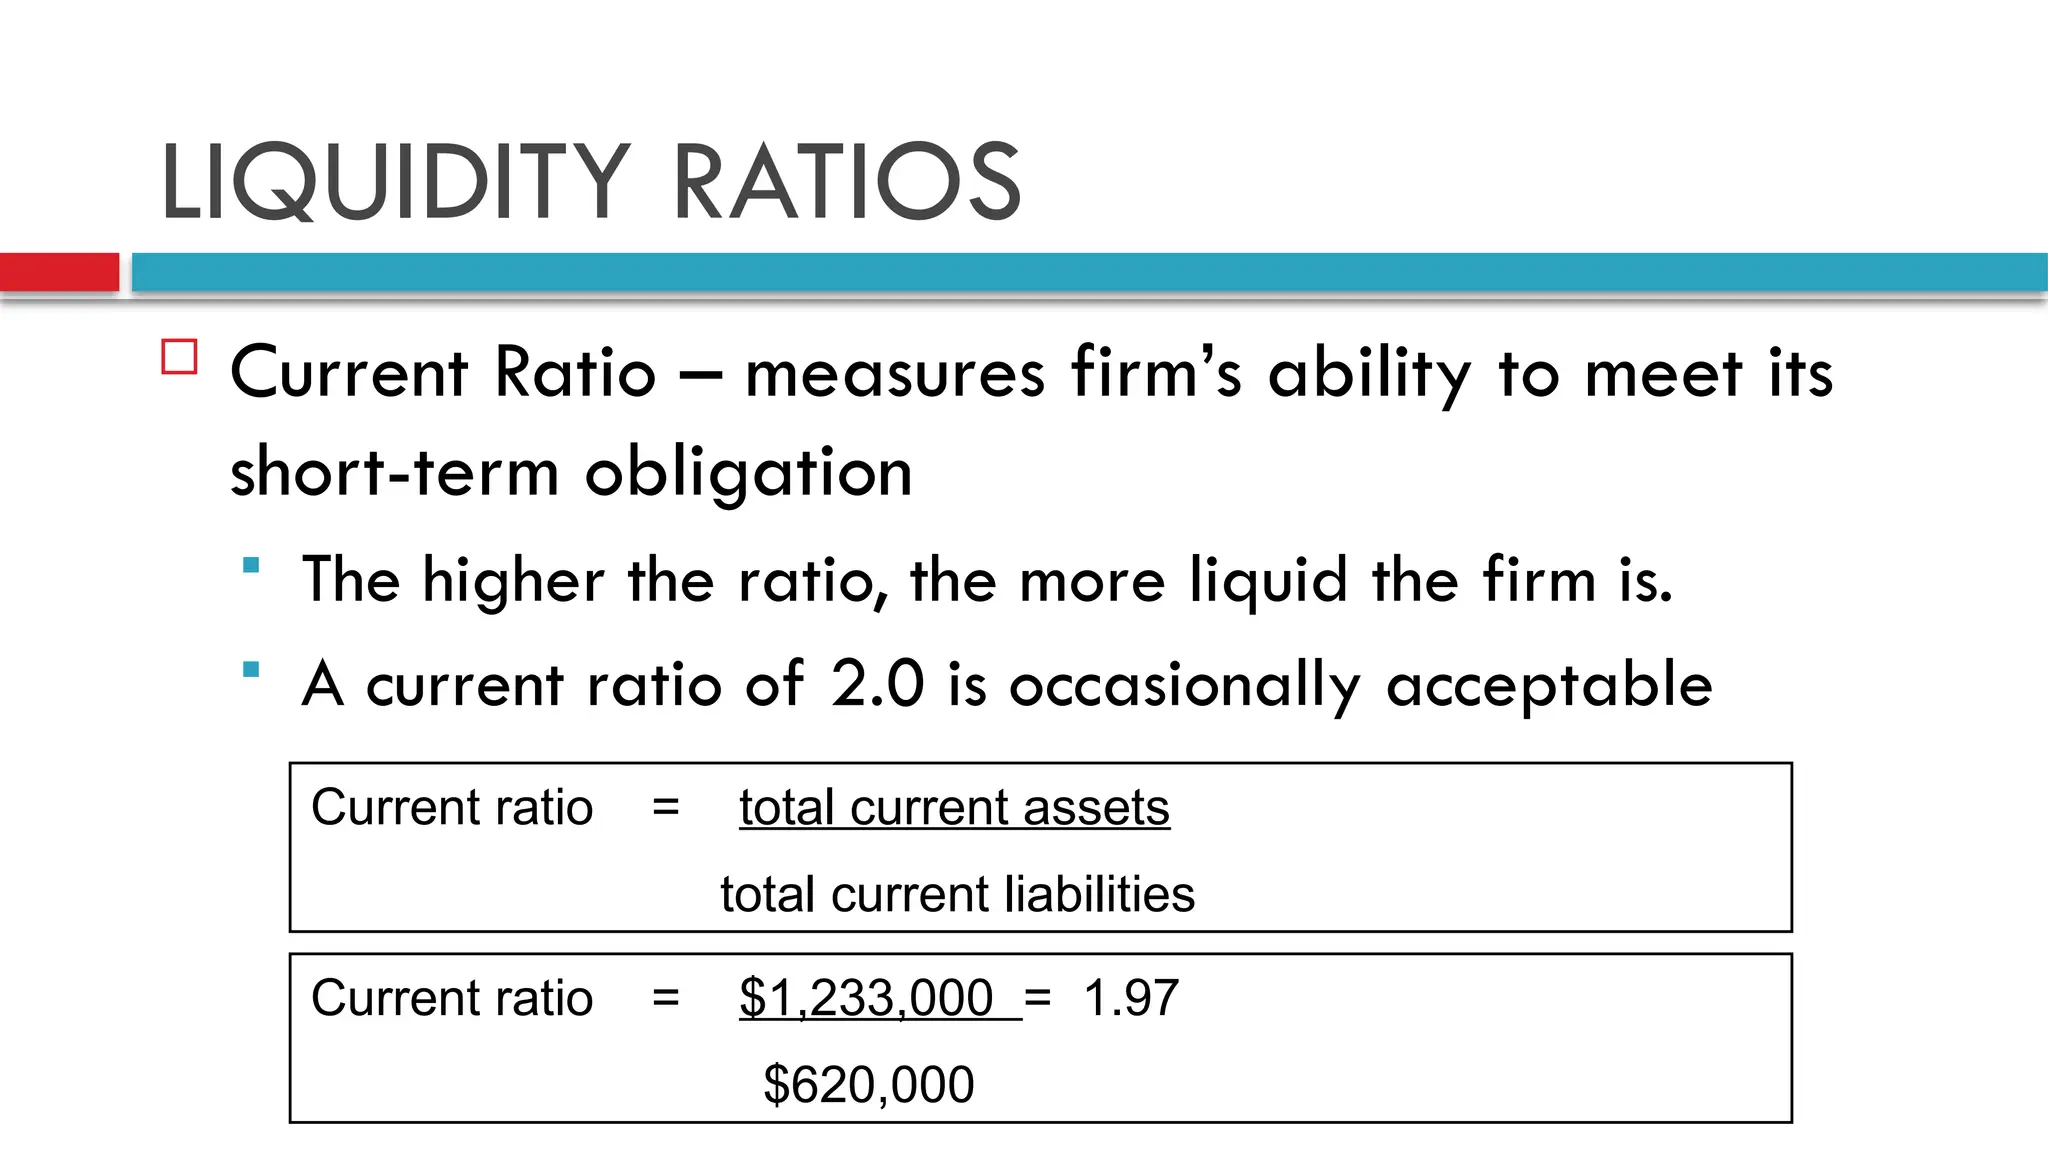
LIQUIDITY RATIOS
CurrentRatio – measures firm’s ability to meet its
short-term obligation
The higher the ratio, the more liquid the firm is.
A current ratio of 2.0 is occasionally acceptable
Current ratio = total current assets
total current liabilities
Current ratio = $1,233,000 = 1.97
$620,000
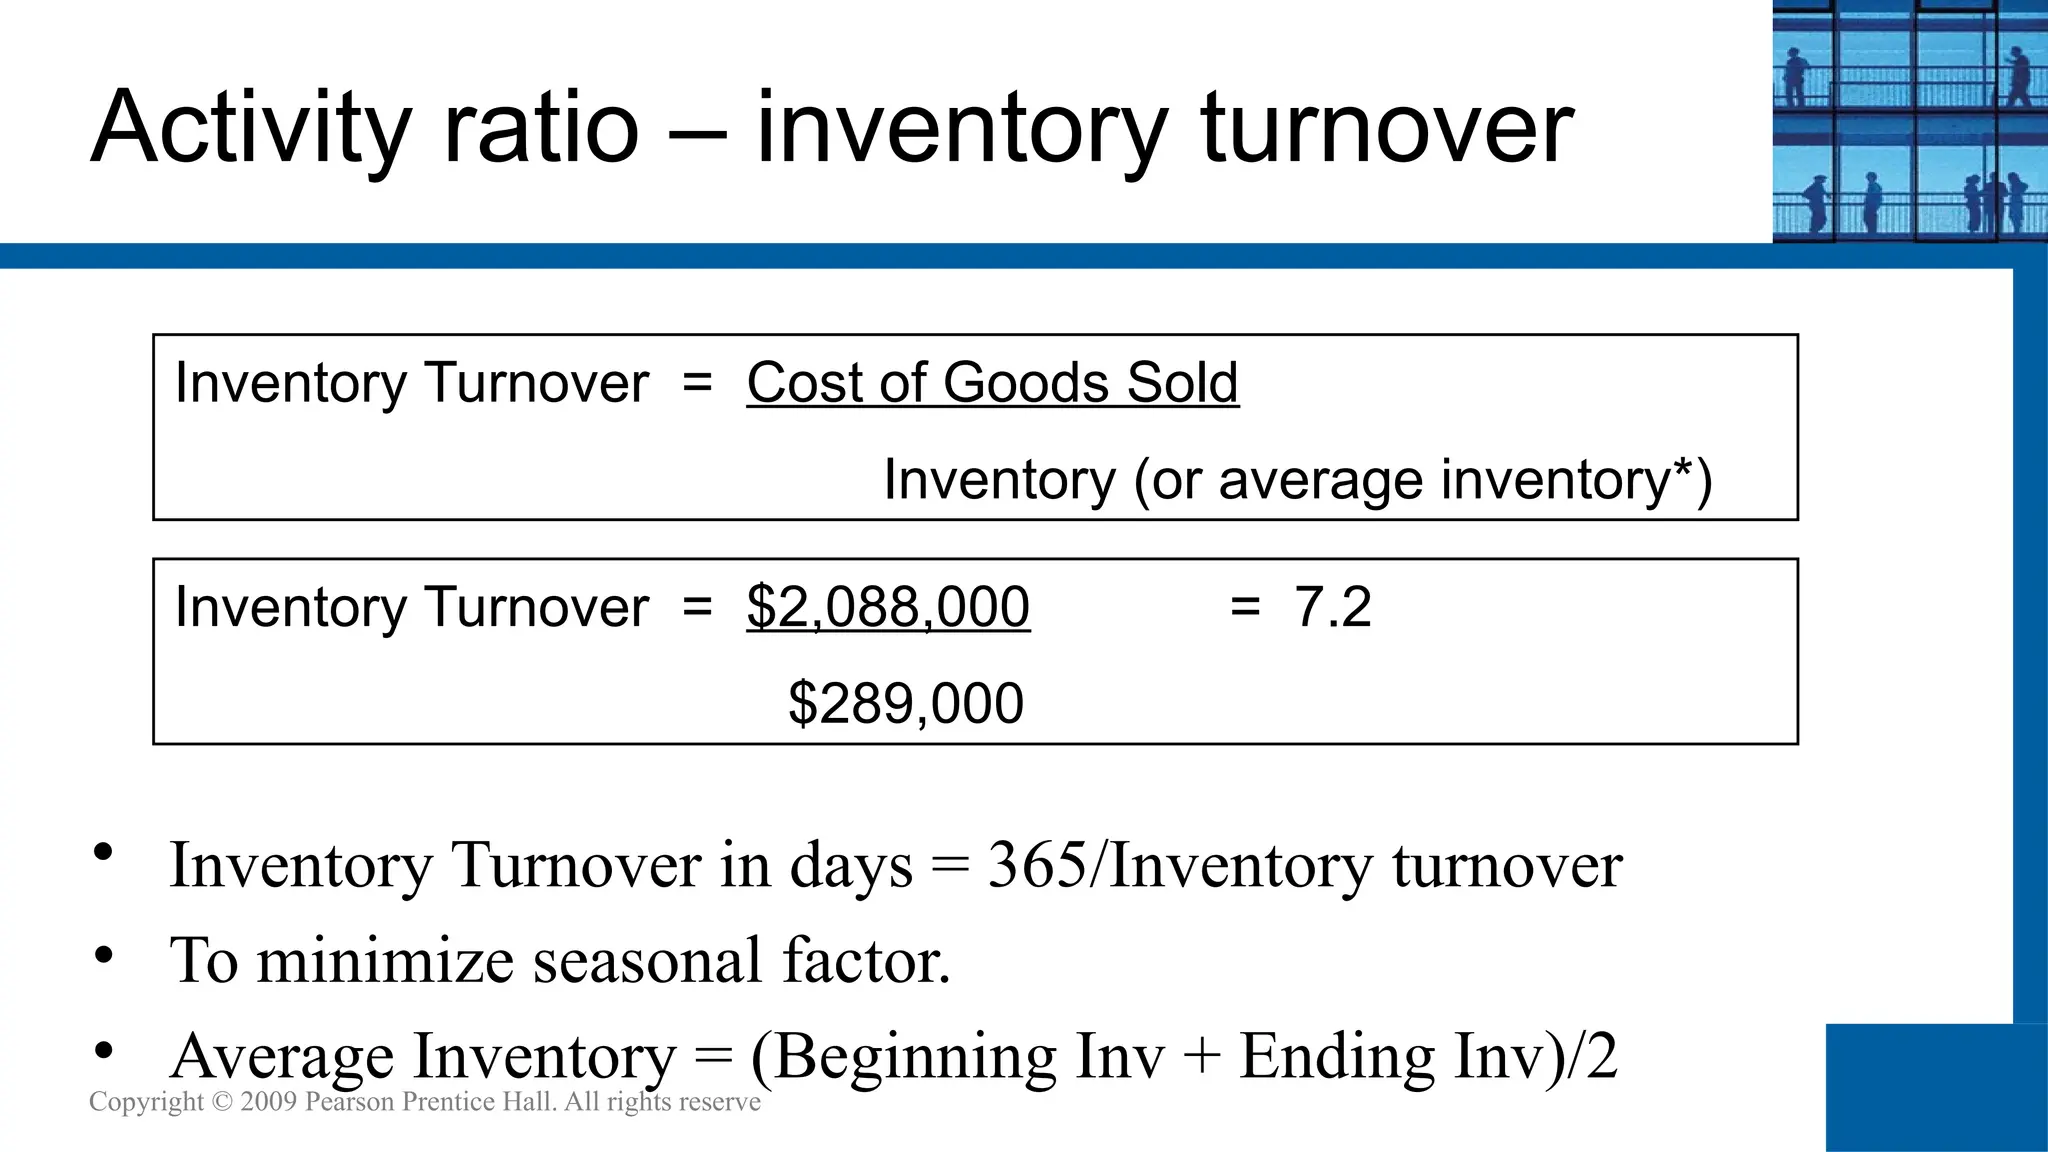
Activity ratio –inventory turnover
Inventory Turnover – measures the
activity/liquidity of a firm’s inventory
The higher the better but only meaningful if
compared with other firms in the same
industry (20 for grocery store, lower for an
art gallery)
Leverage Ratio -Debt Ratio
Debt Ratio (Financial leverage ratio) – measures the
proportion of total assets financed by the firm’s creditors
The higher this ratio, the greater the firms’ degree of
indebtedness, the more financial leverage it has
Debt Ratio = Total Liabilities/Total Assets
Debt Ratio = $1,643,000/$3,597,000 = 45.7%
35.
Debt Ratio –Times Interest Earned Ratio
Times Interest Earned Ratio (interest coverage) – measures
the firms’ ability to make contractual interest payments
The higher the better – a value of at least 3.0 and
preferably closer to 5.0 is often suggested
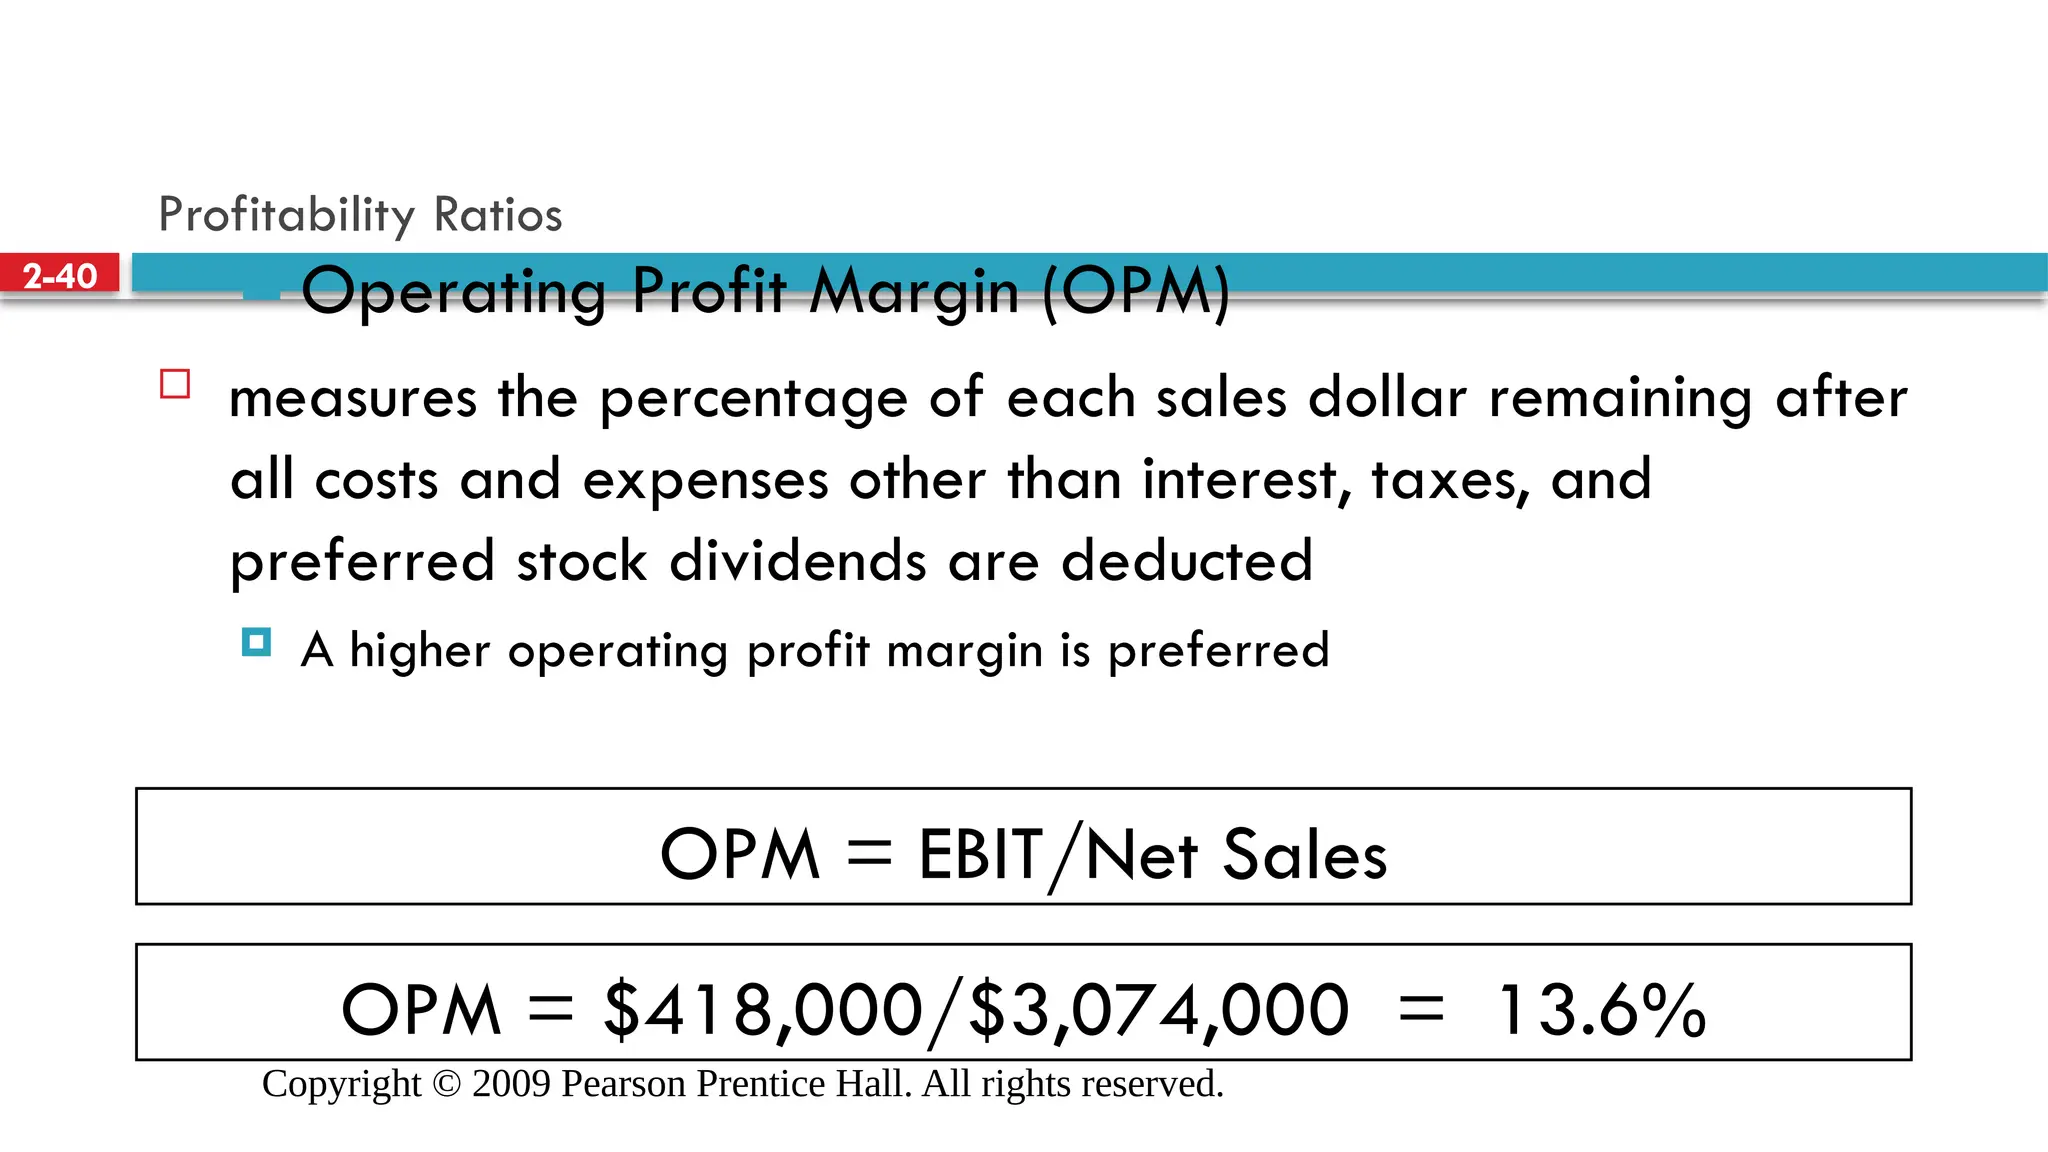
Times Interest Earned = EBIT (Operating Income)/Interest
Times Interest Earned = $418,000/$93,000 = 4.5
36.
Debt ratio -Fixed-Payment Coverage
Fixed-Payment Coverage Ratio – measures the firms’
ability to meet all fixed-payment obligations (loan
interest and principal, lease payments, preferred stock
dividend)
The higher, the better. Also measures risk, the lower the
ratio, the greater the risk to both lenders and owners
Debt-equity ratio
Measuresthe relationship between the firm’s resources
provided through debt and those provided through
ownership (equity)
The greater the D/E ratio is, the riskier the company is
as an investment
Formula = Total Liabilities
Total stockholders’ equity
39.
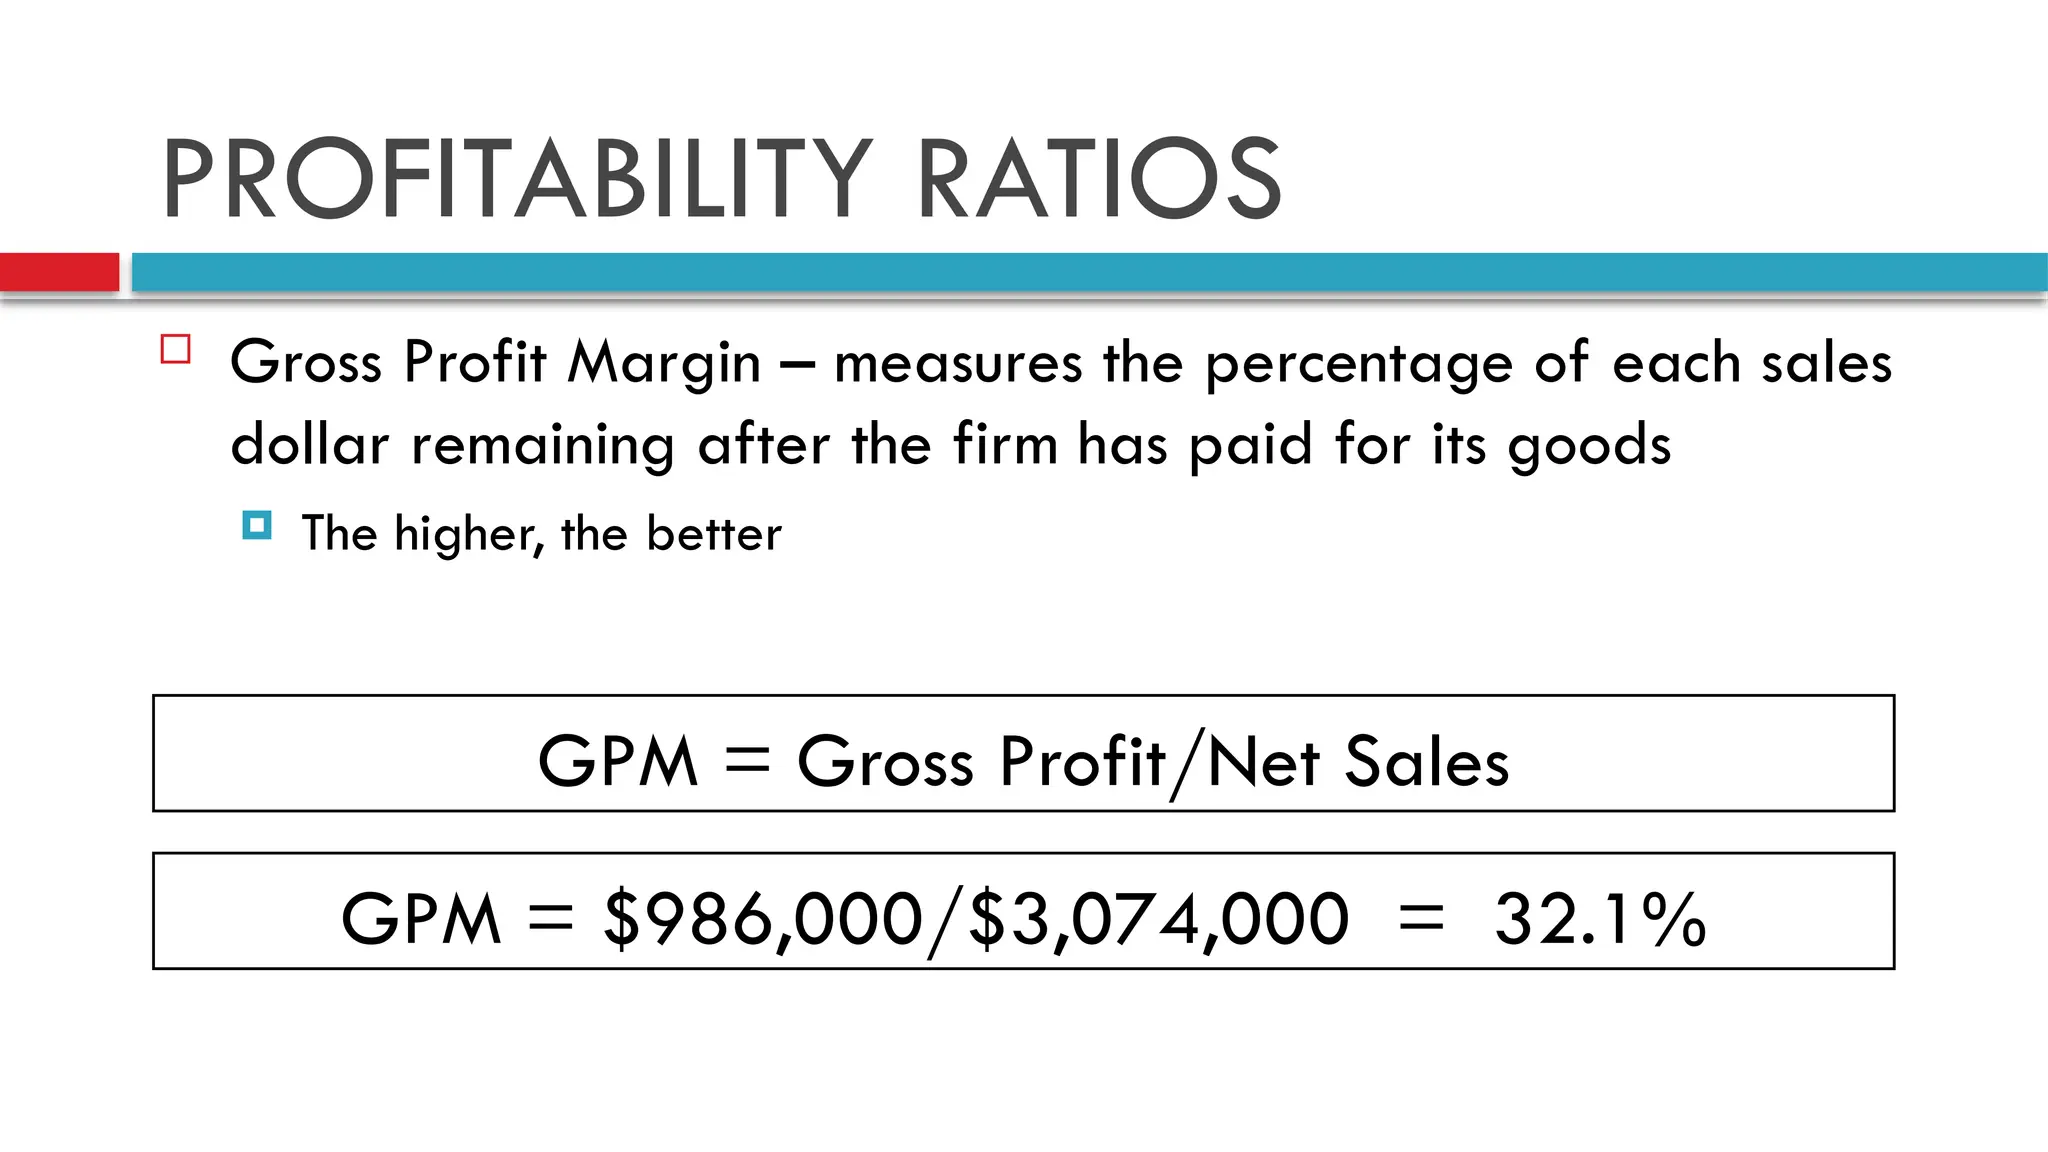
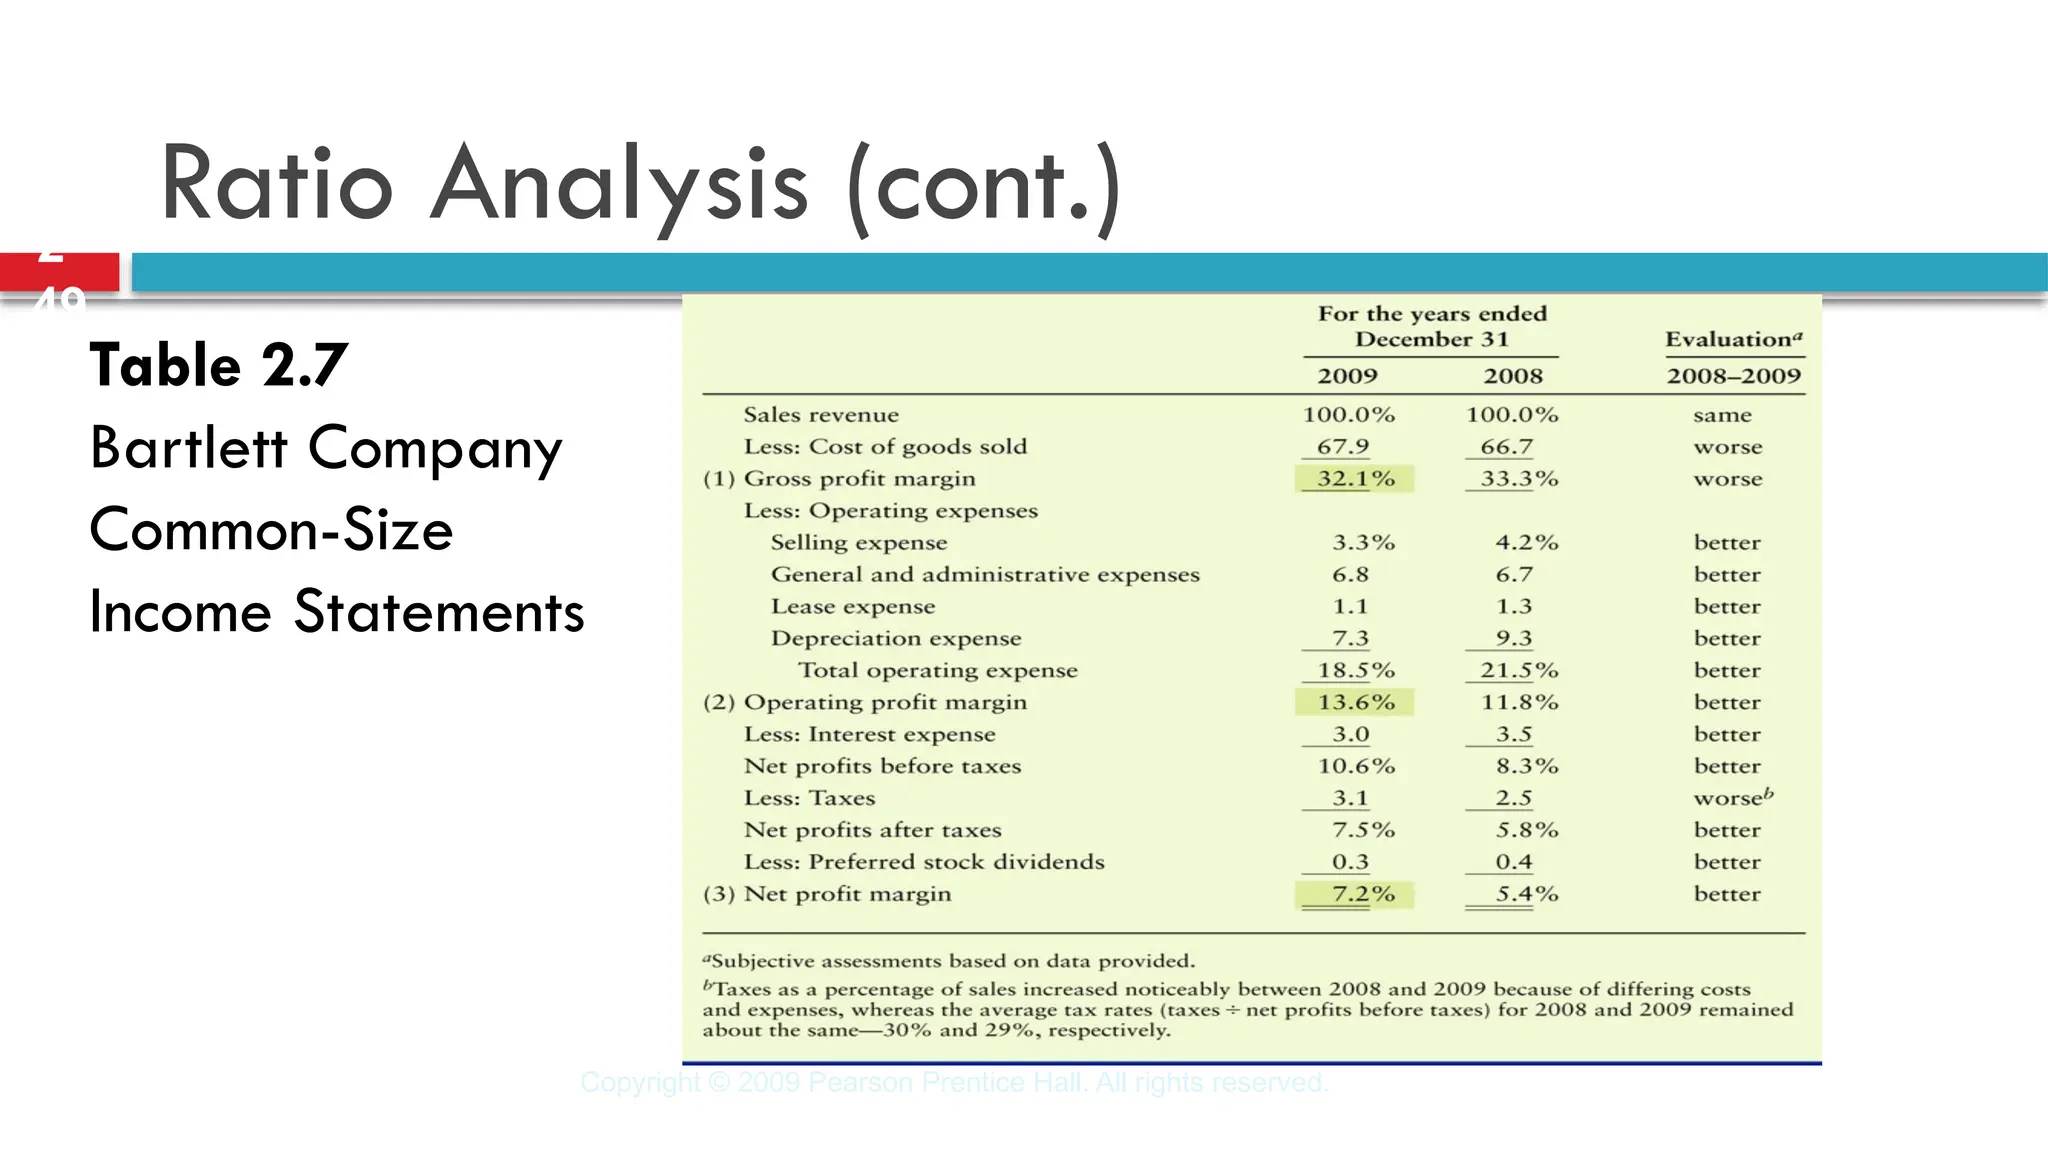
PROFITABILITY RATIOS
GrossProfit Margin – measures the percentage of each sales
dollar remaining after the firm has paid for its goods
The higher, the better
GPM = Gross Profit/Net Sales
GPM = $986,000/$3,074,000 = 32.1%
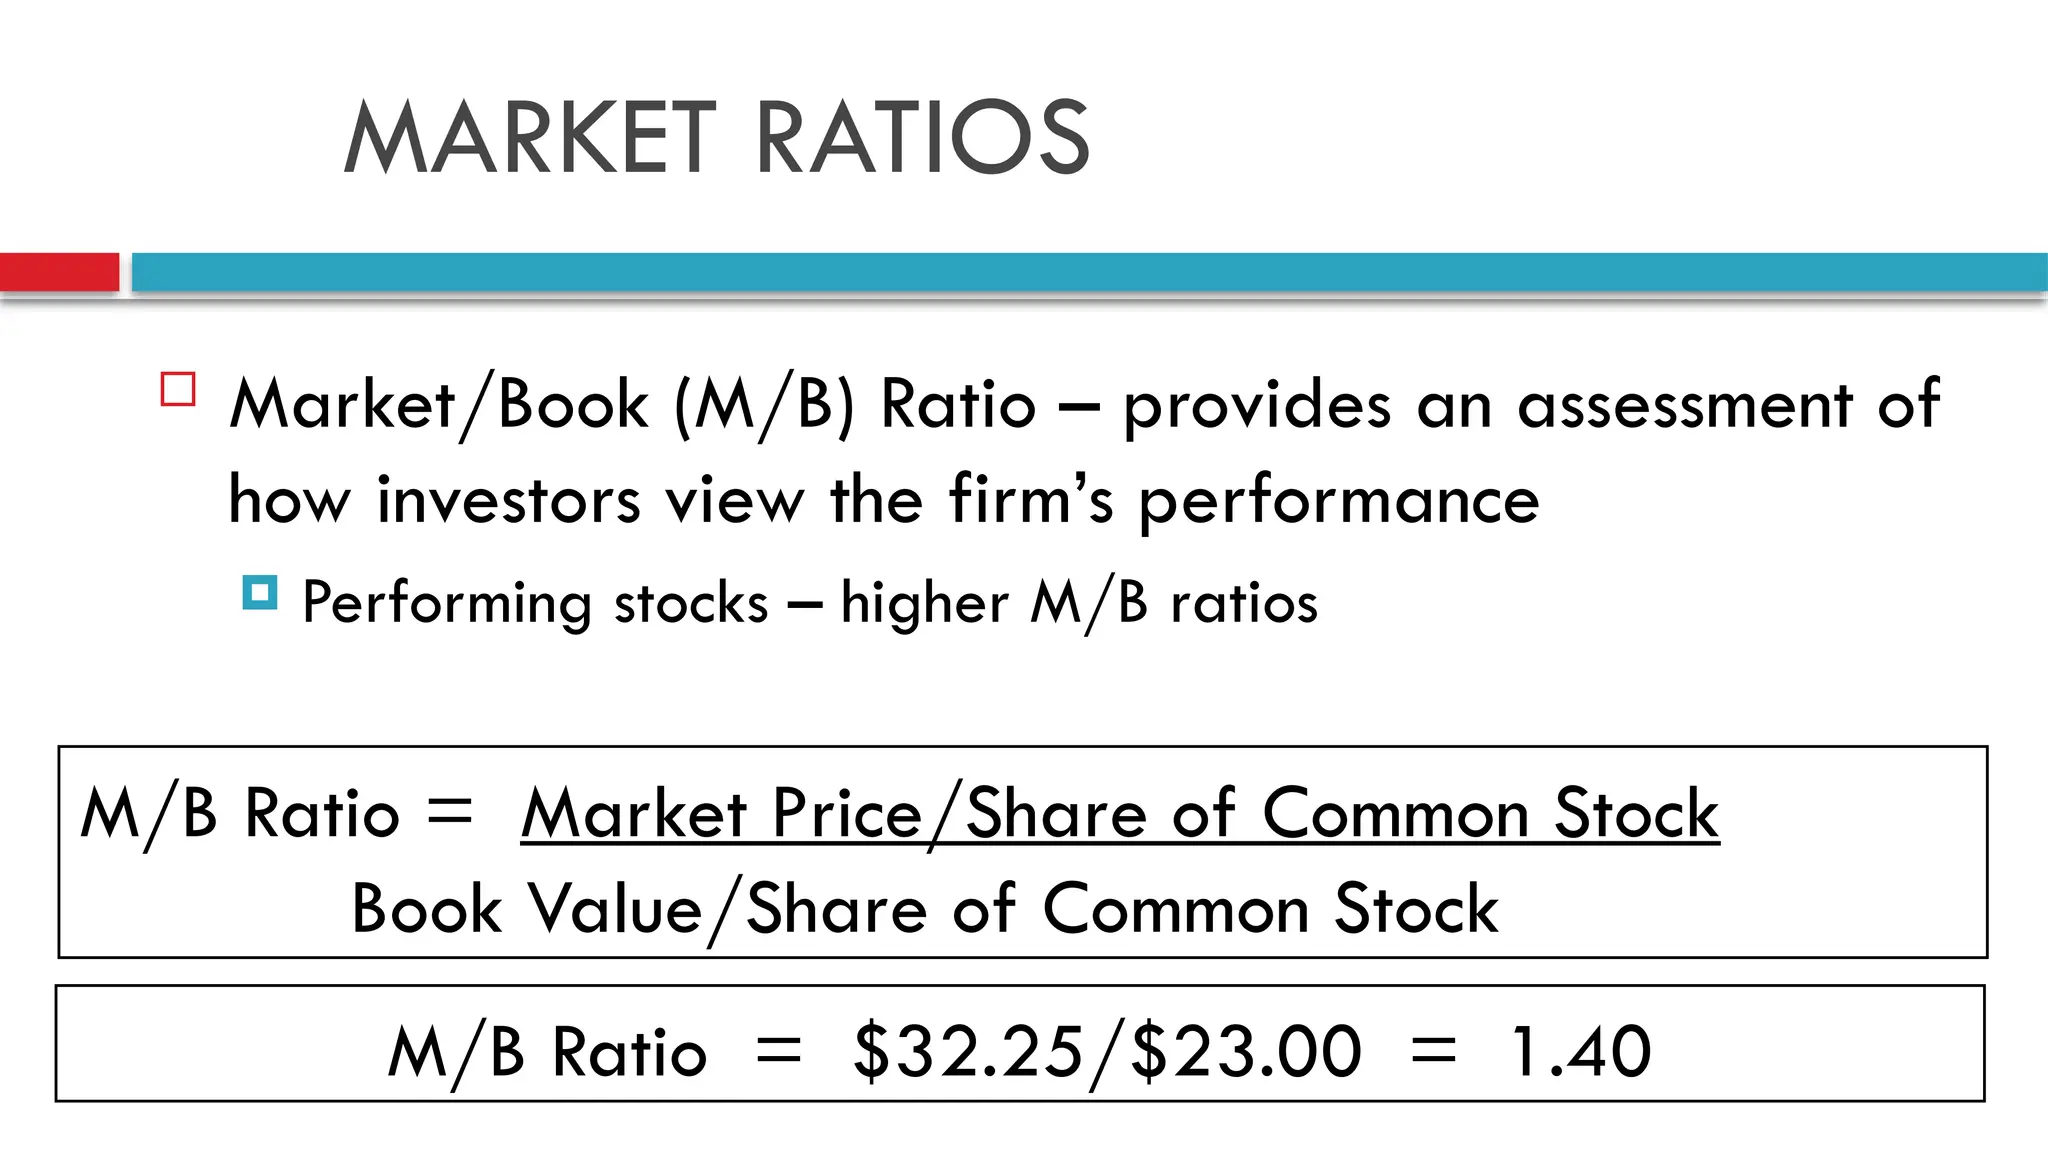
MARKET RATIOS
Market/Book(M/B) Ratio – provides an assessment of
how investors view the firm’s performance
Performing stocks – higher M/B ratios
M/B Ratio = Market Price/Share of Common Stock
Book Value/Share of Common Stock
M/B Ratio = $32.25/$23.00 = 1.40
47.
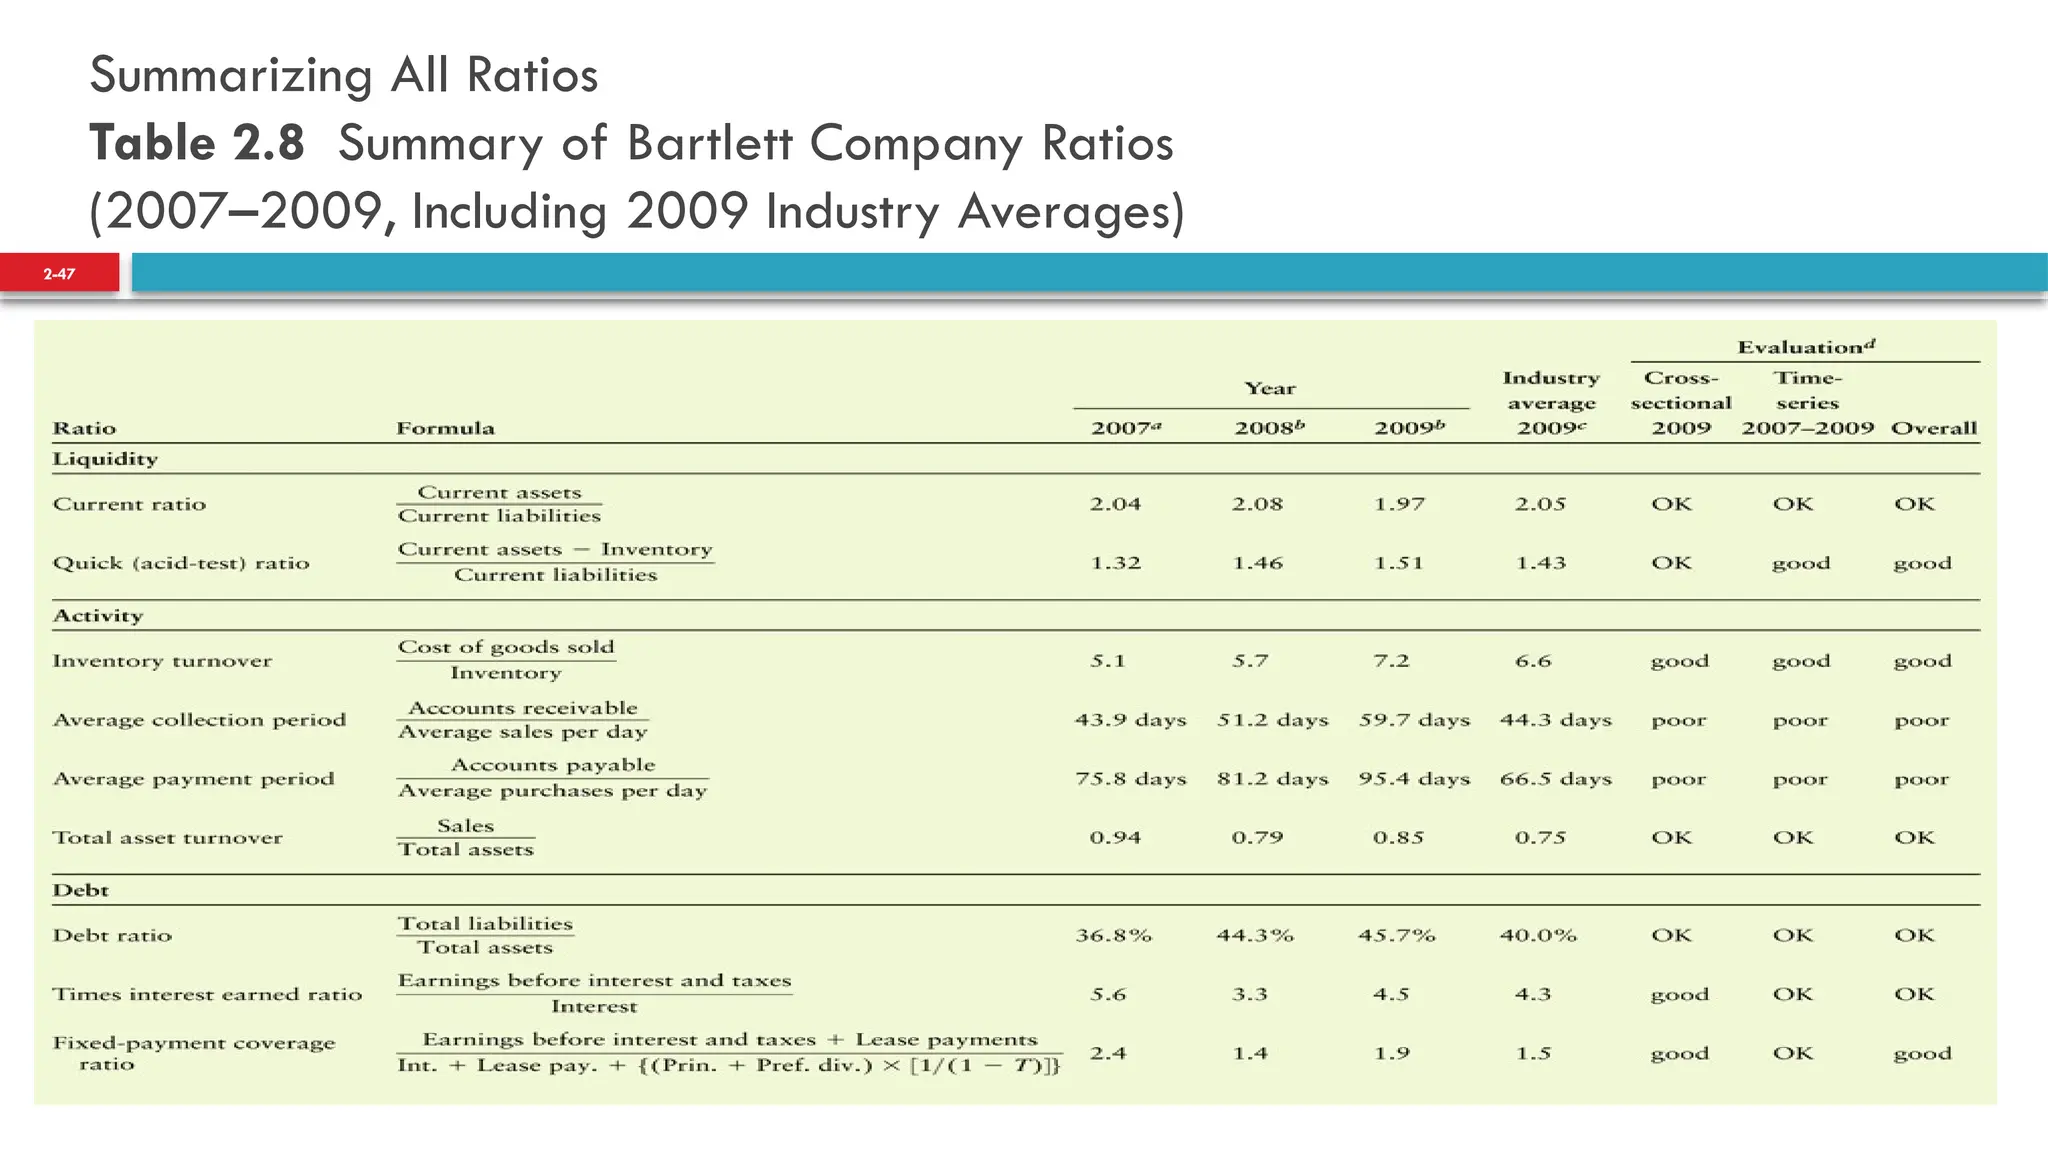
Summarizing All Ratios
Table2.8 Summary of Bartlett Company Ratios
(2007–2009, Including 2009 Industry Averages)
2-47
48.
Summarizing All Ratios(cont.)
Table 2.8 Summary of Bartlett Company Ratios
(2007–2009, Including 2009 Industry Averages)
2-48


![Copyright © 2009 Pearson Prentice Hall. All rights reserved.
2-37
FPCR = EBIT + Lease Payments________________
Interest + Lease Pymts + {(Princ Pymts + PSD) x [1/(1-t)]}
FPCR = $418,000 + $35,000 = 1.9
$93,000 + $35,000 + {($71,000 + $10,000) x [1/(1-.29)]}
Debt Ratio
Fixed-Payment coverage Ratio (FPCR)](https://image.slidesharecdn.com/fsa-250420080857-dcadd451/75/Financial-Statement-Analysis-Annual-Report-Analysis-37-2048.jpg)