Chapter 11 of 'Finance by Boundless' covers capital budgeting, which is the planning process to determine long-term investments worth pursuing. Key methods include net present value (NPV), internal rate of return (IRR), payback period, and profitability index, all of which help to rank and evaluate investment proposals. The chapter emphasizes the importance of accurate forecasting of revenues and expenditures and outlines that capital budgeting plays a crucial role in the financial health and direction of an organization.


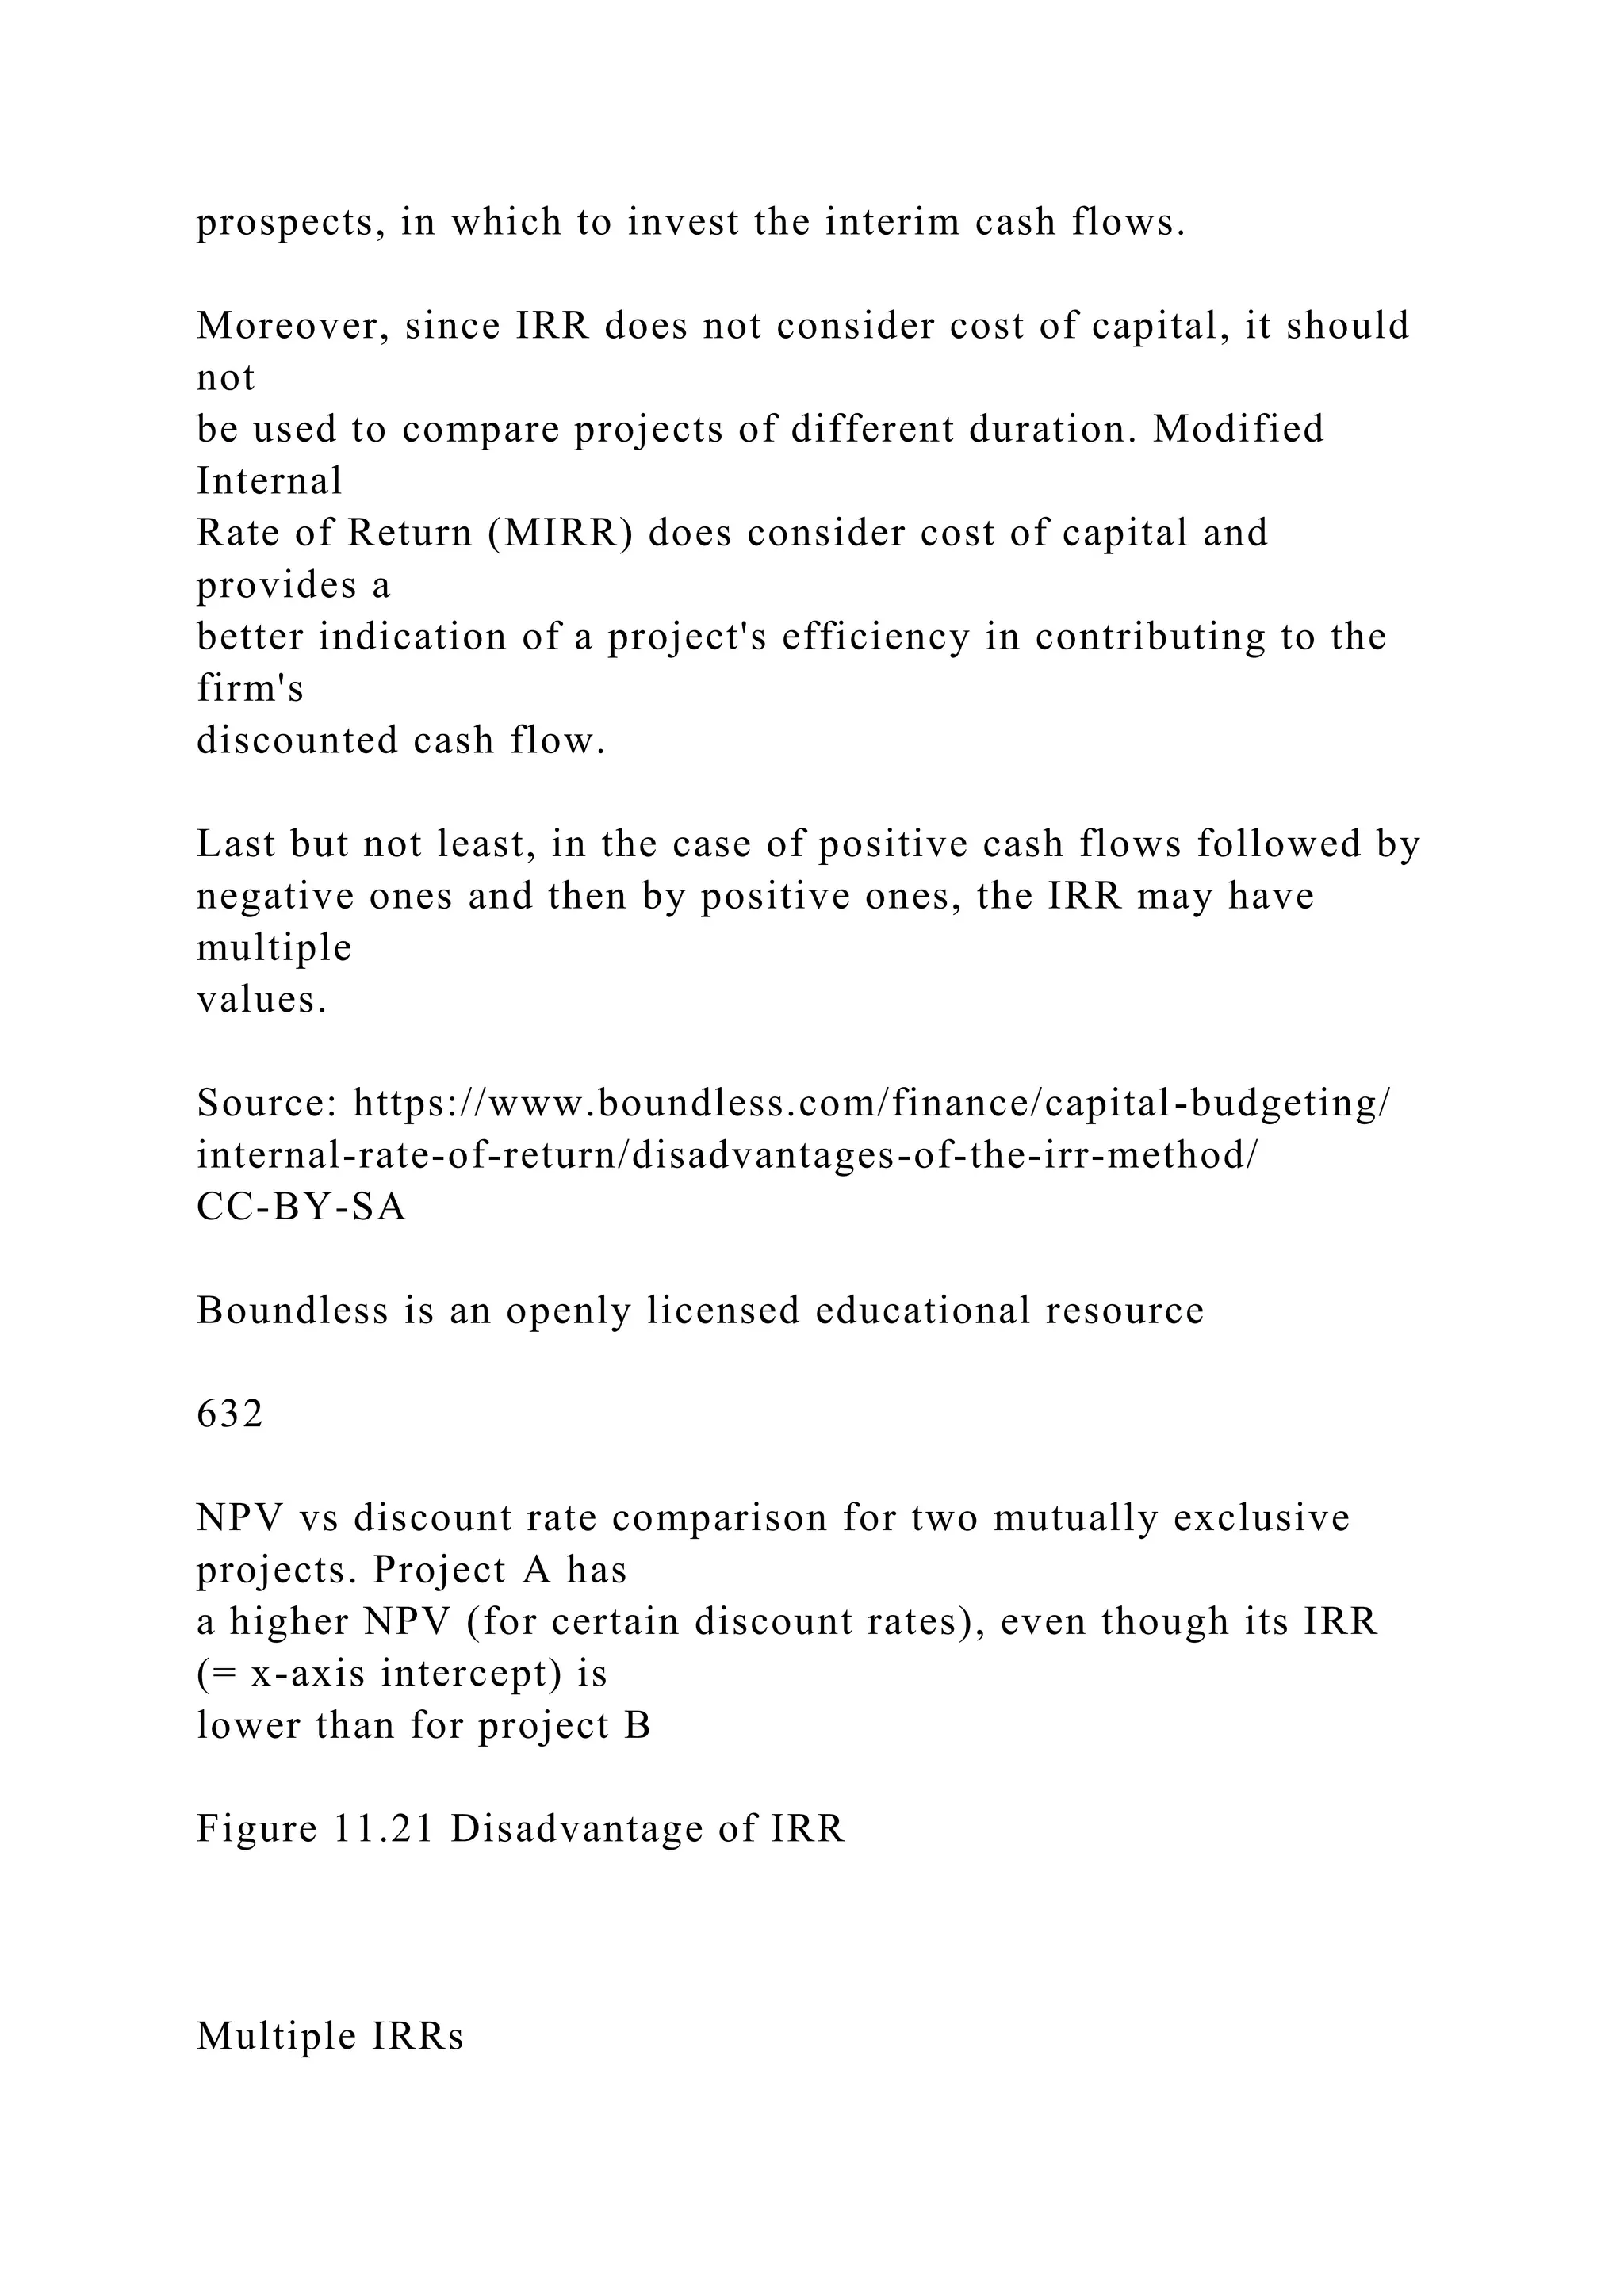
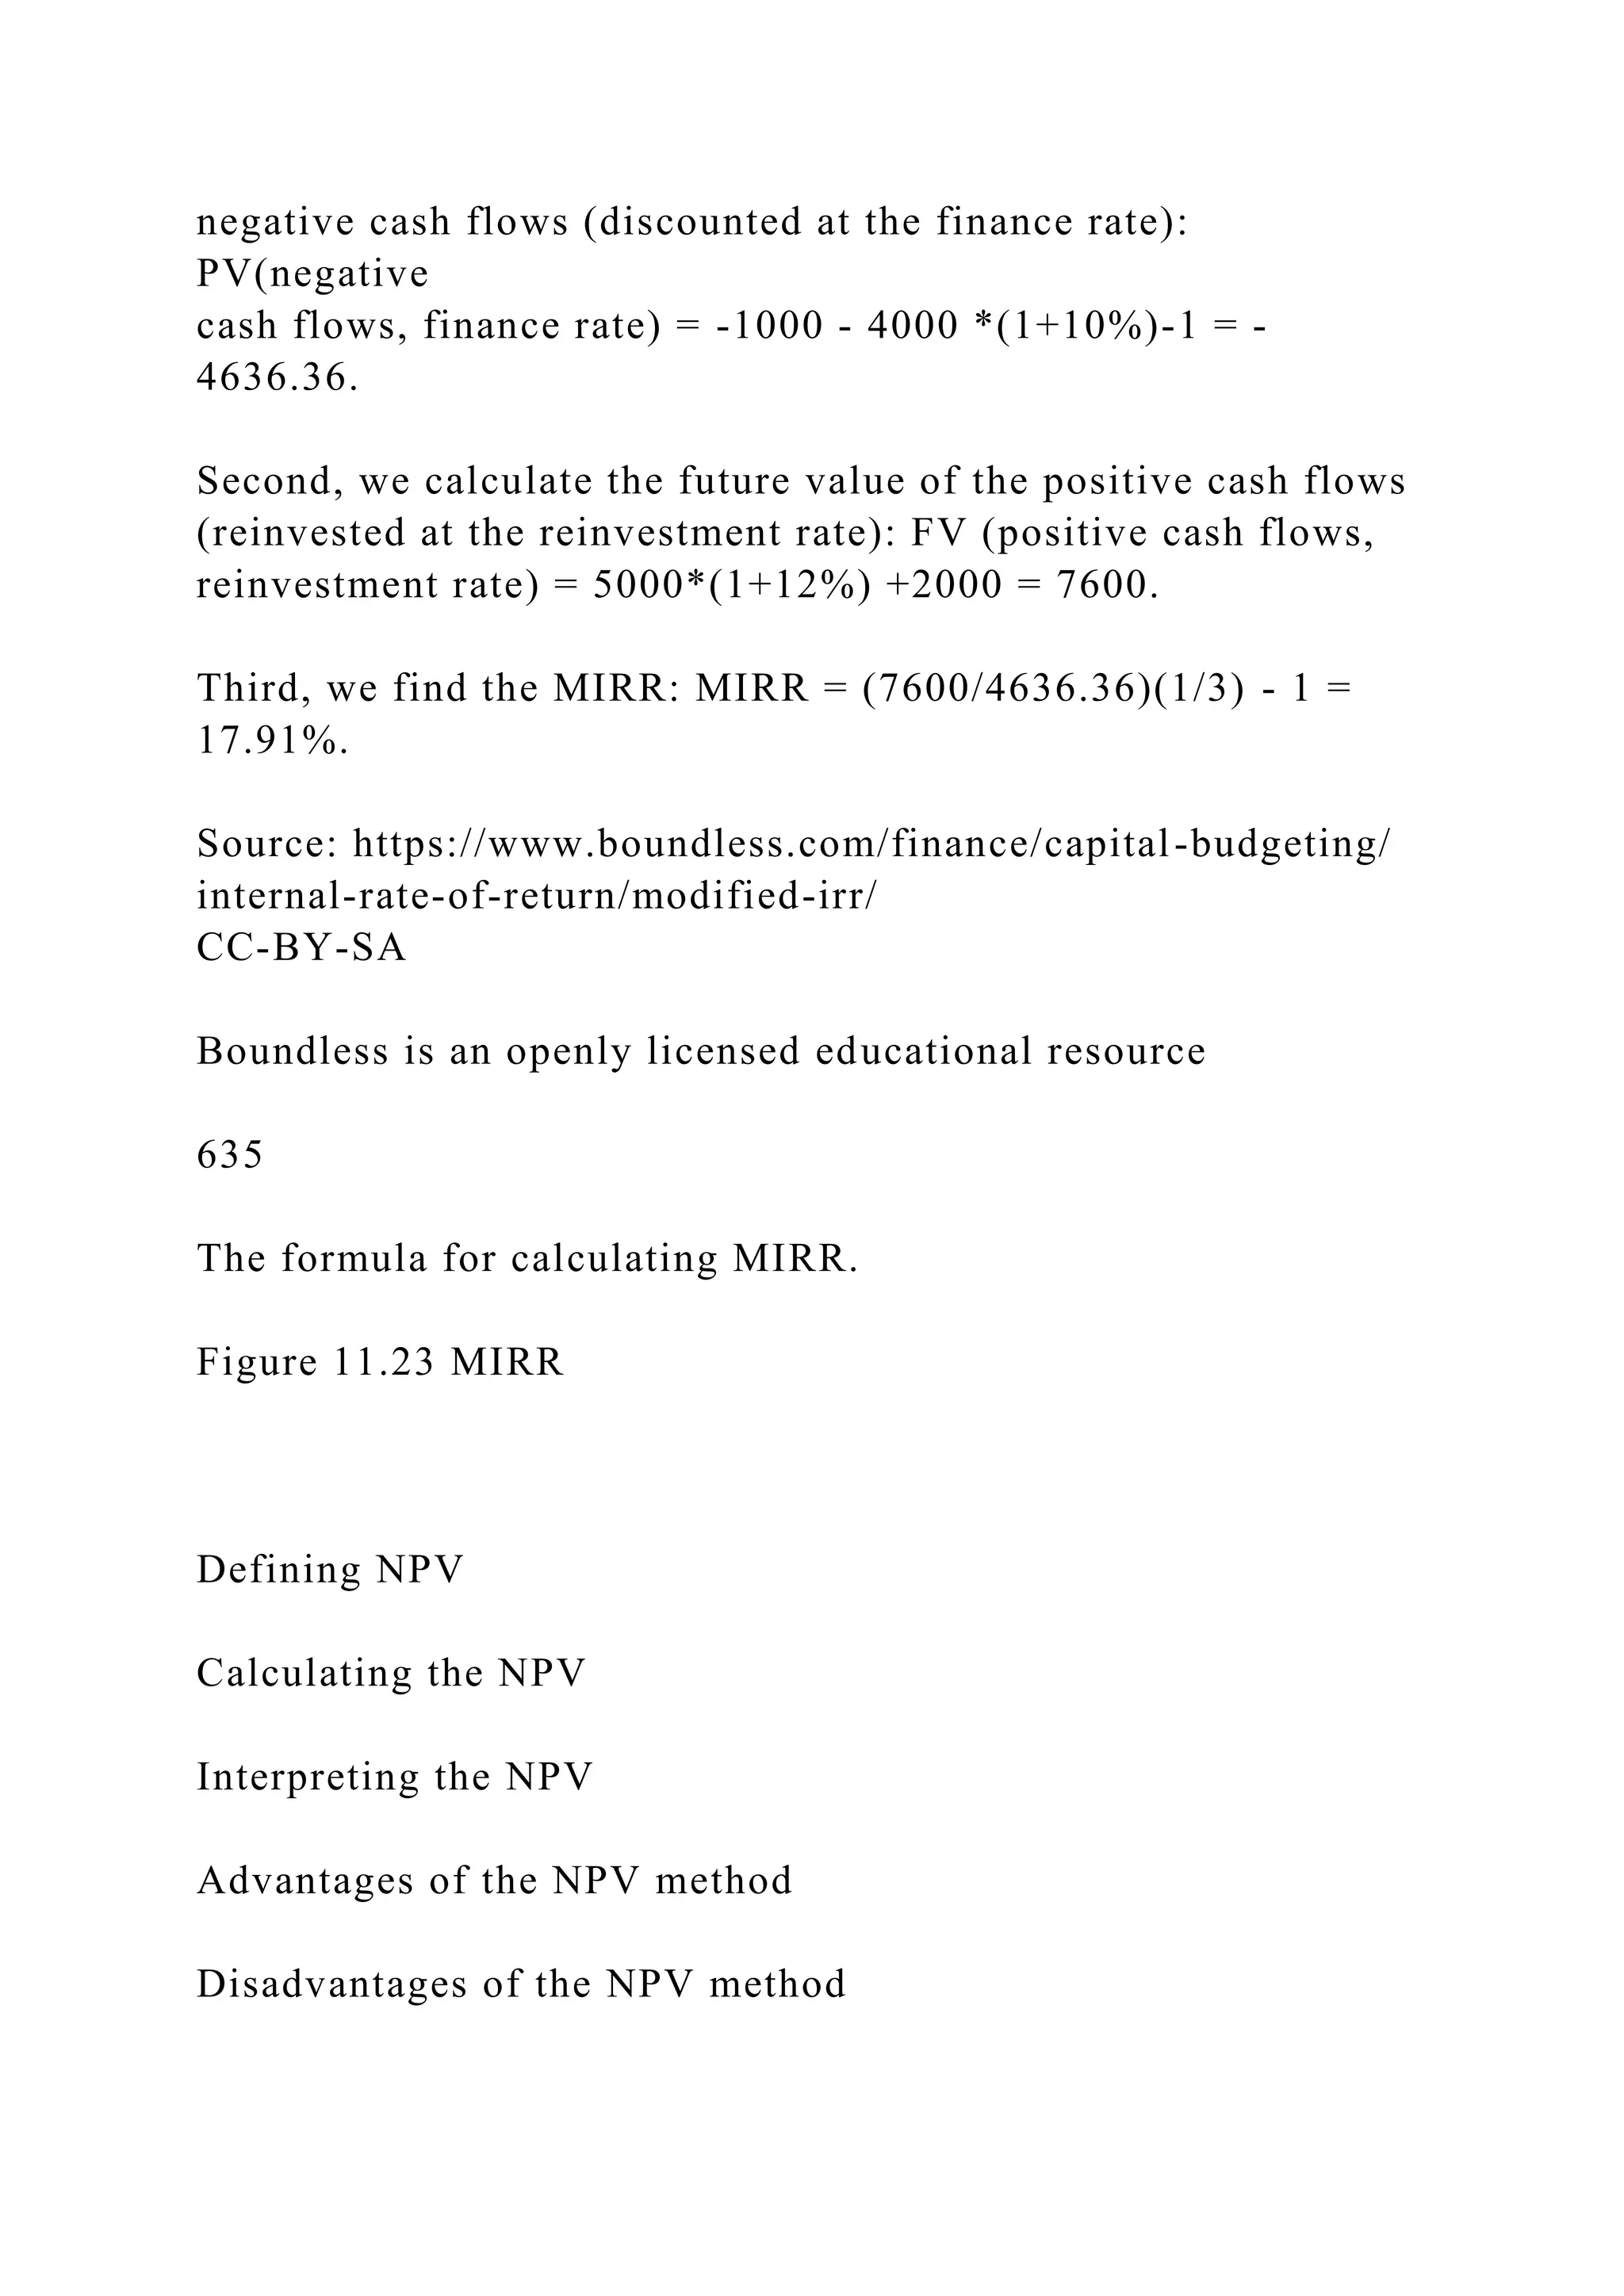
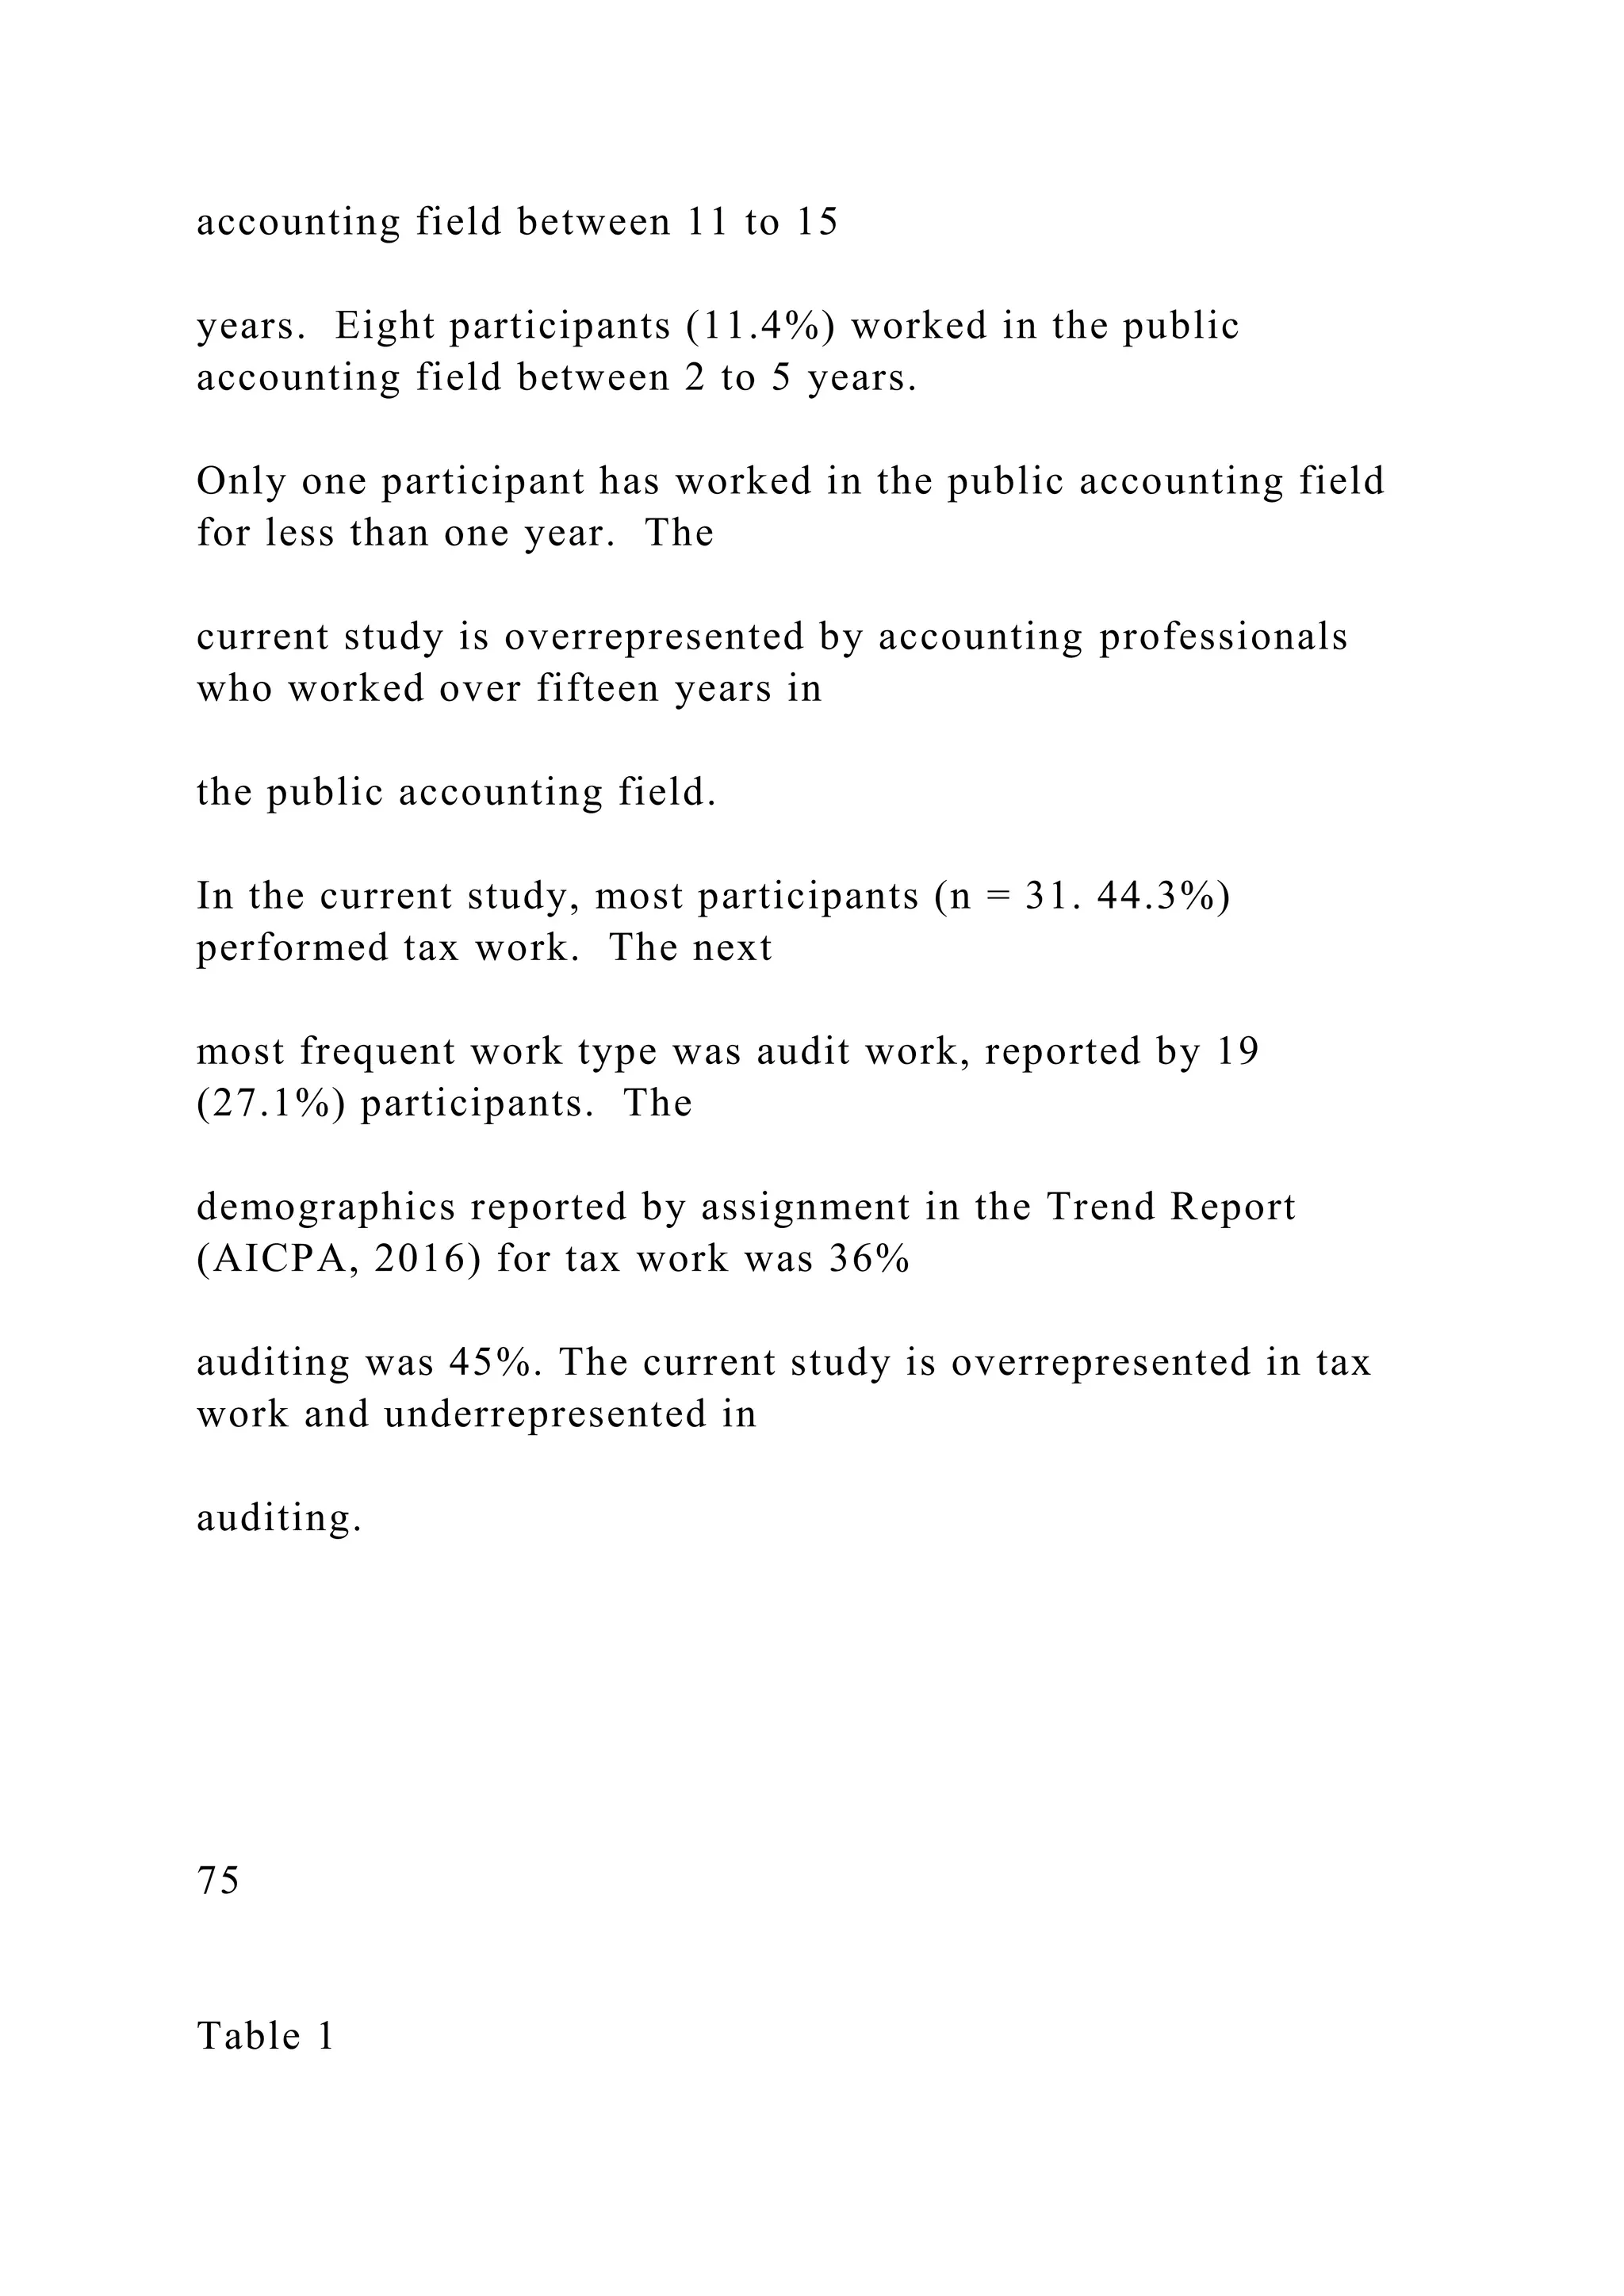
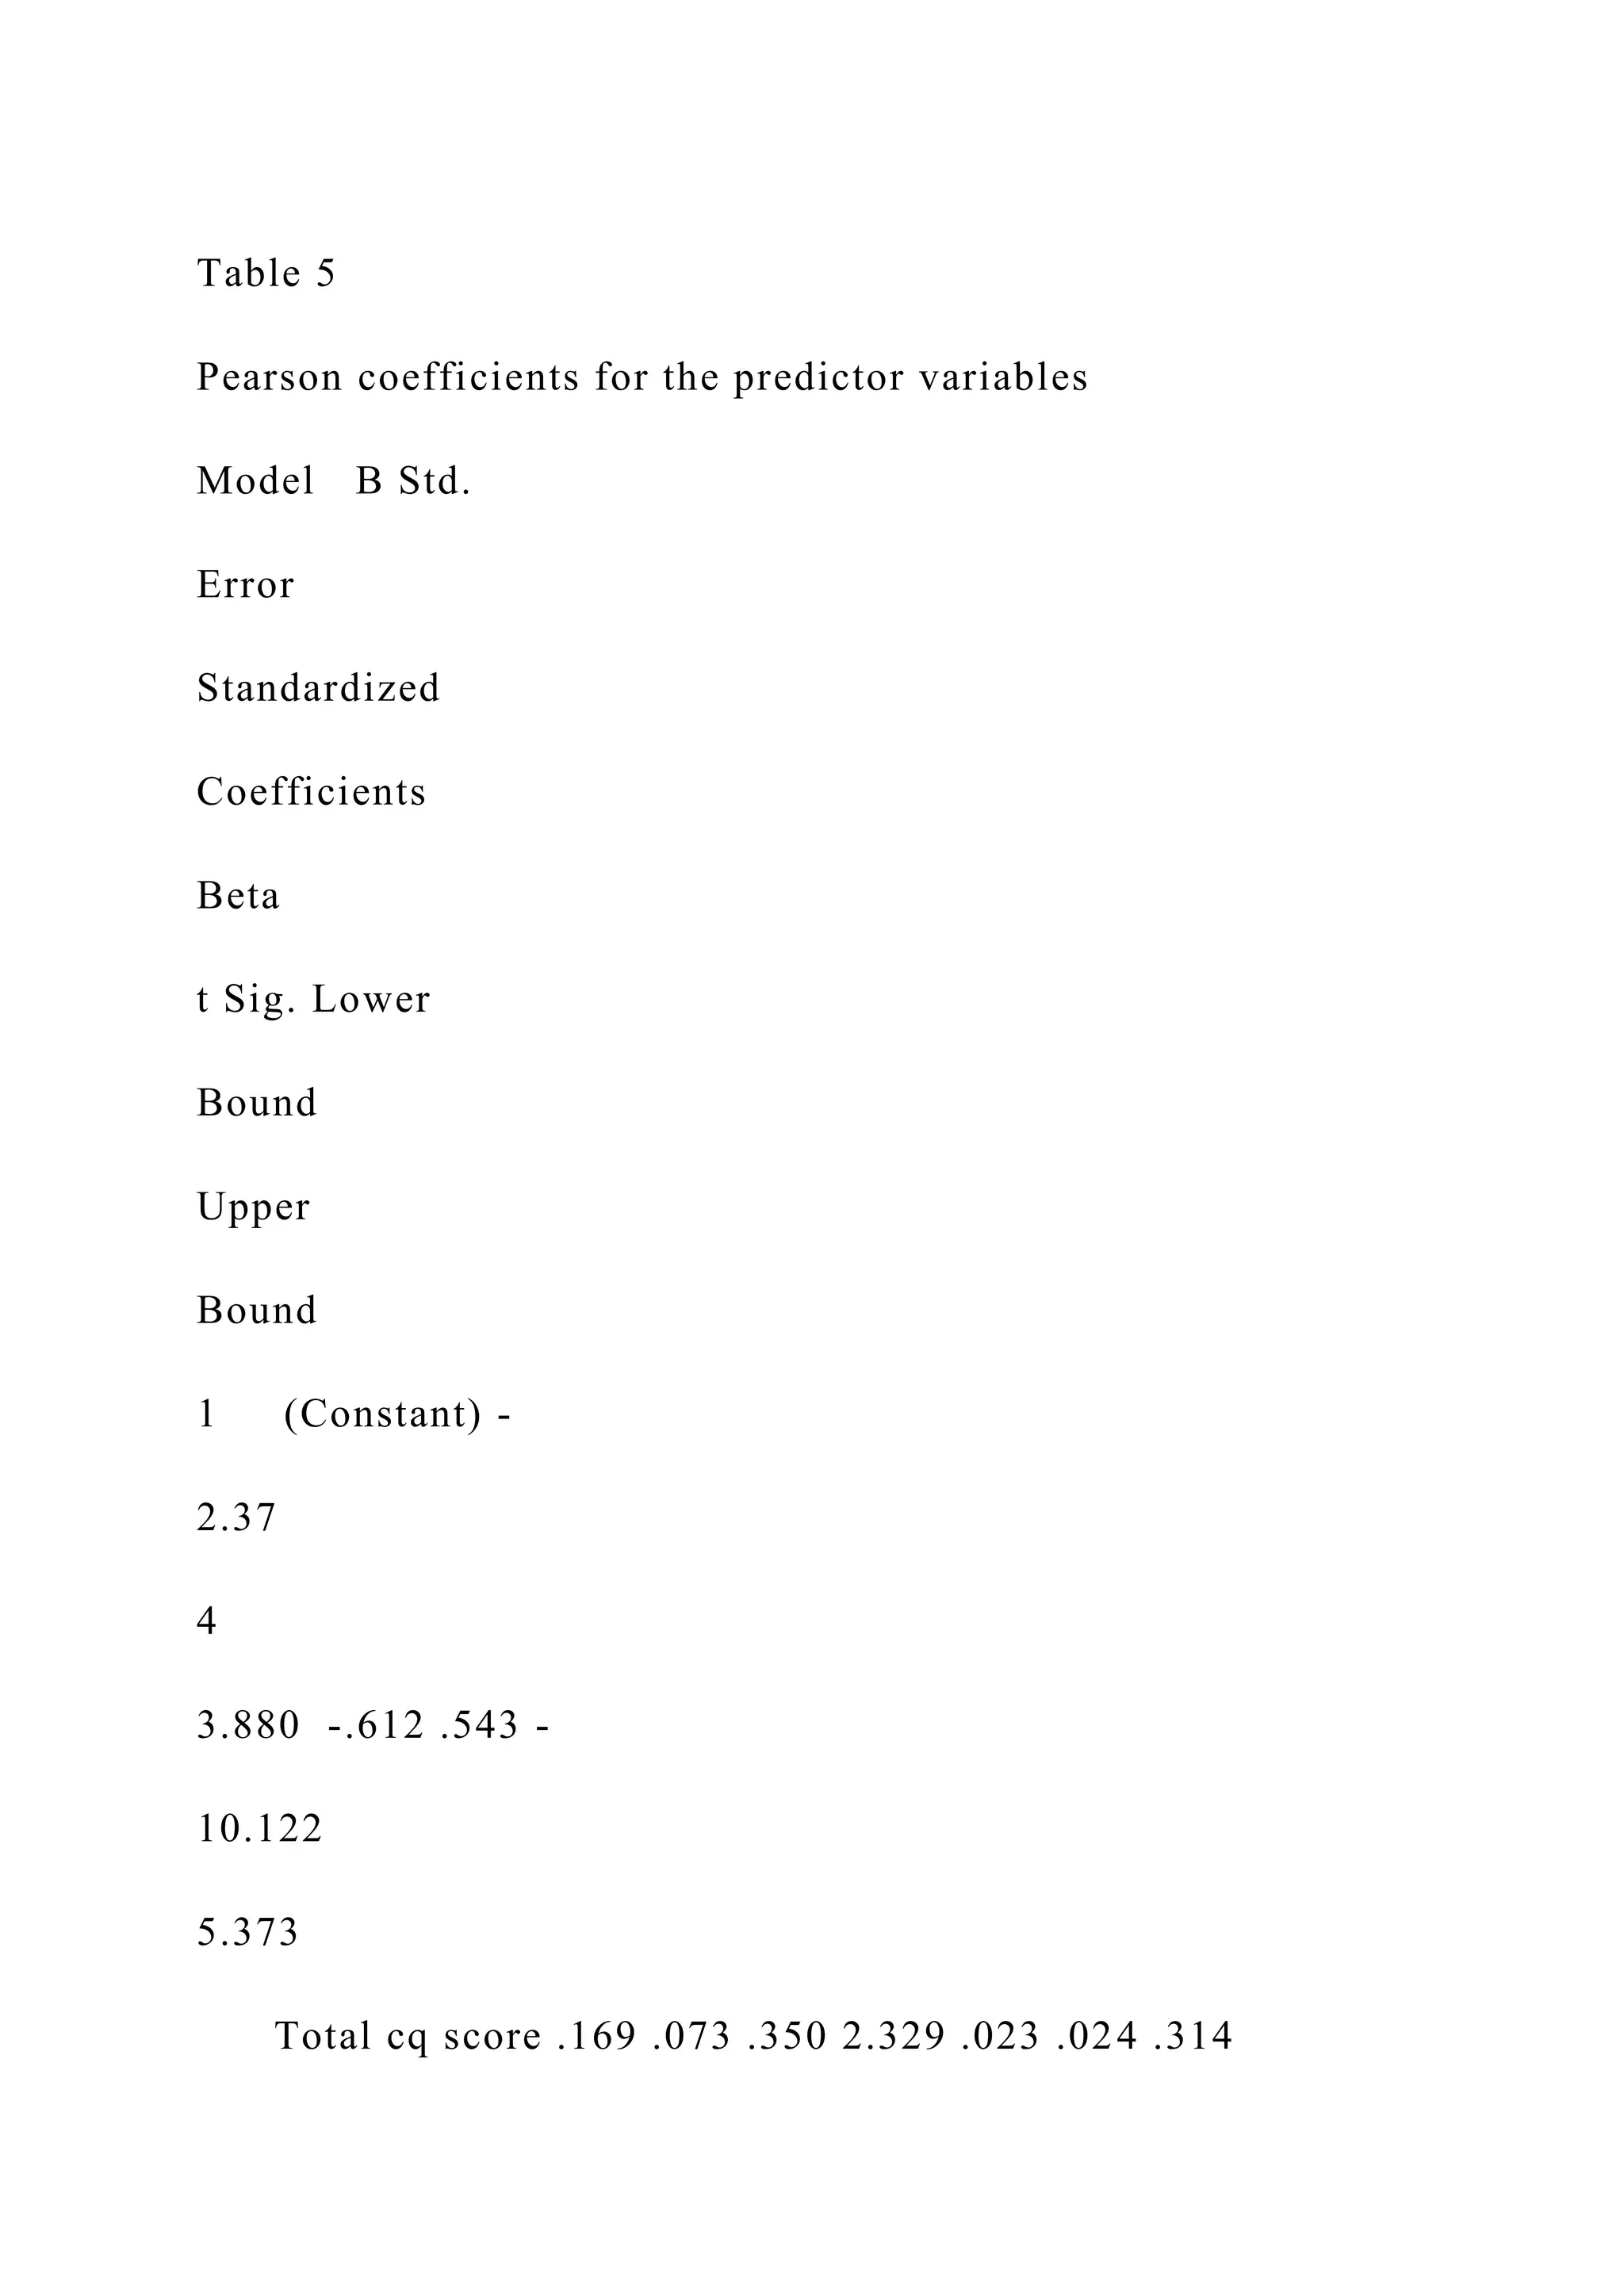
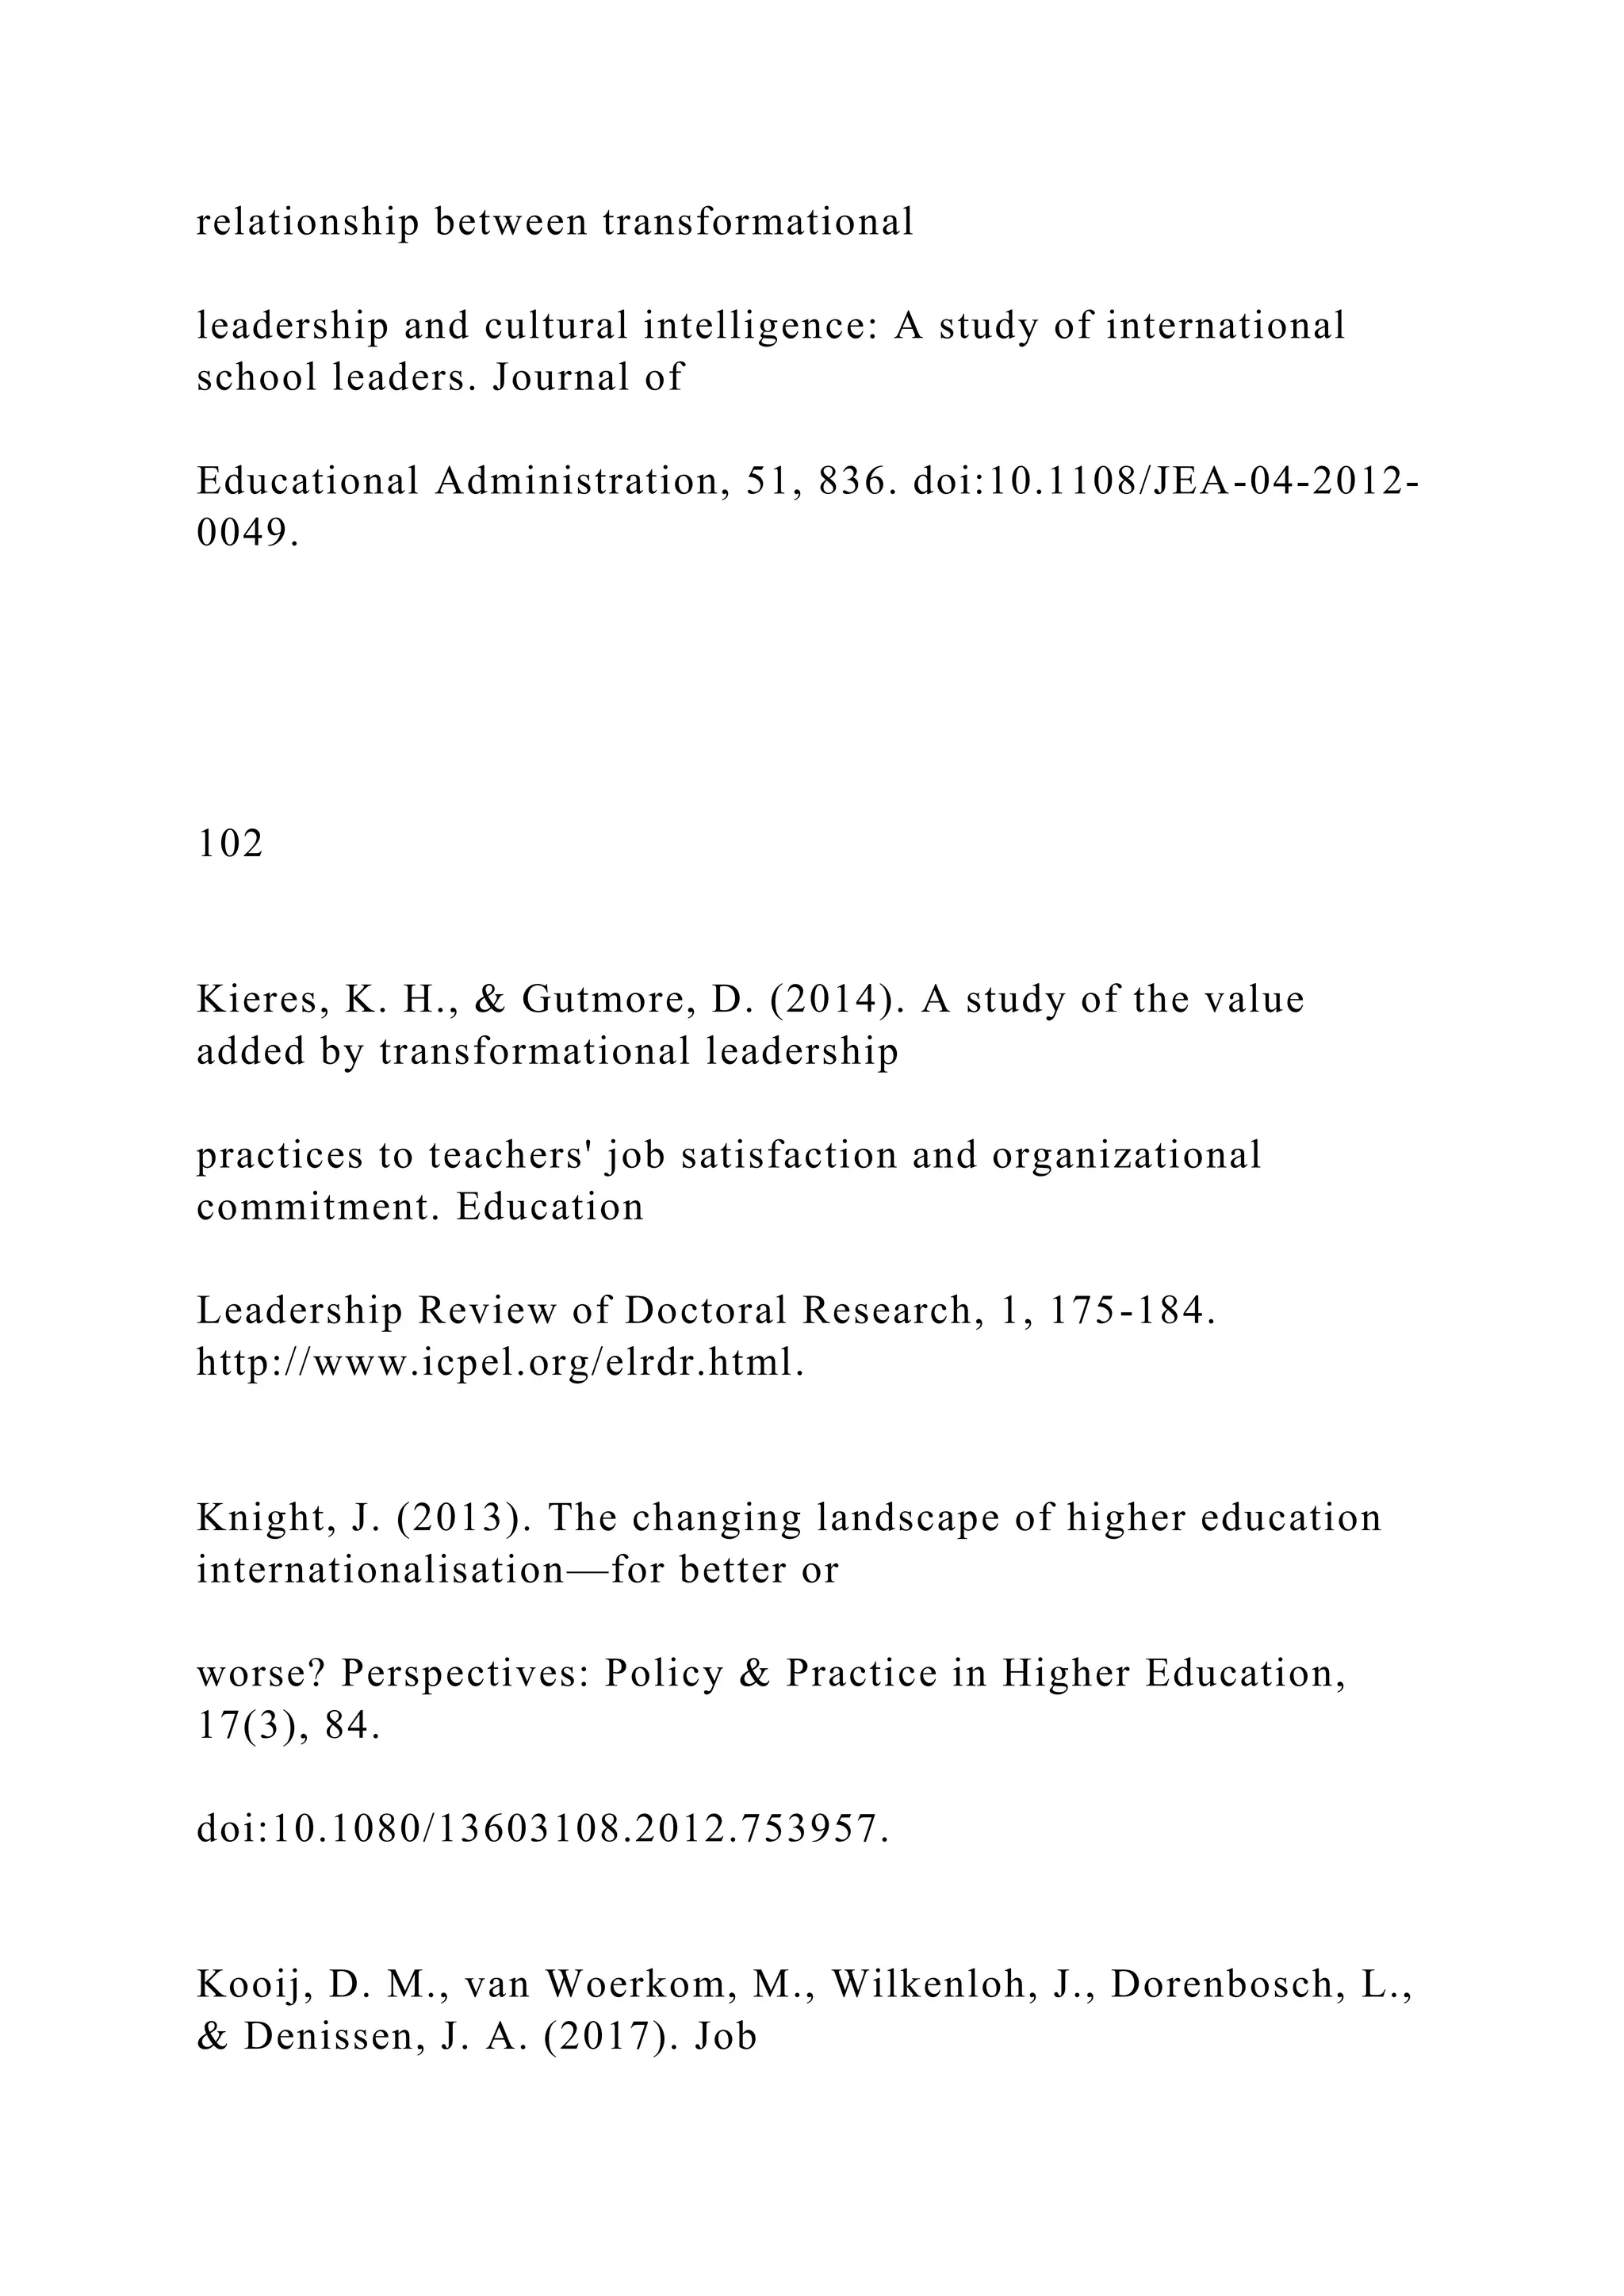
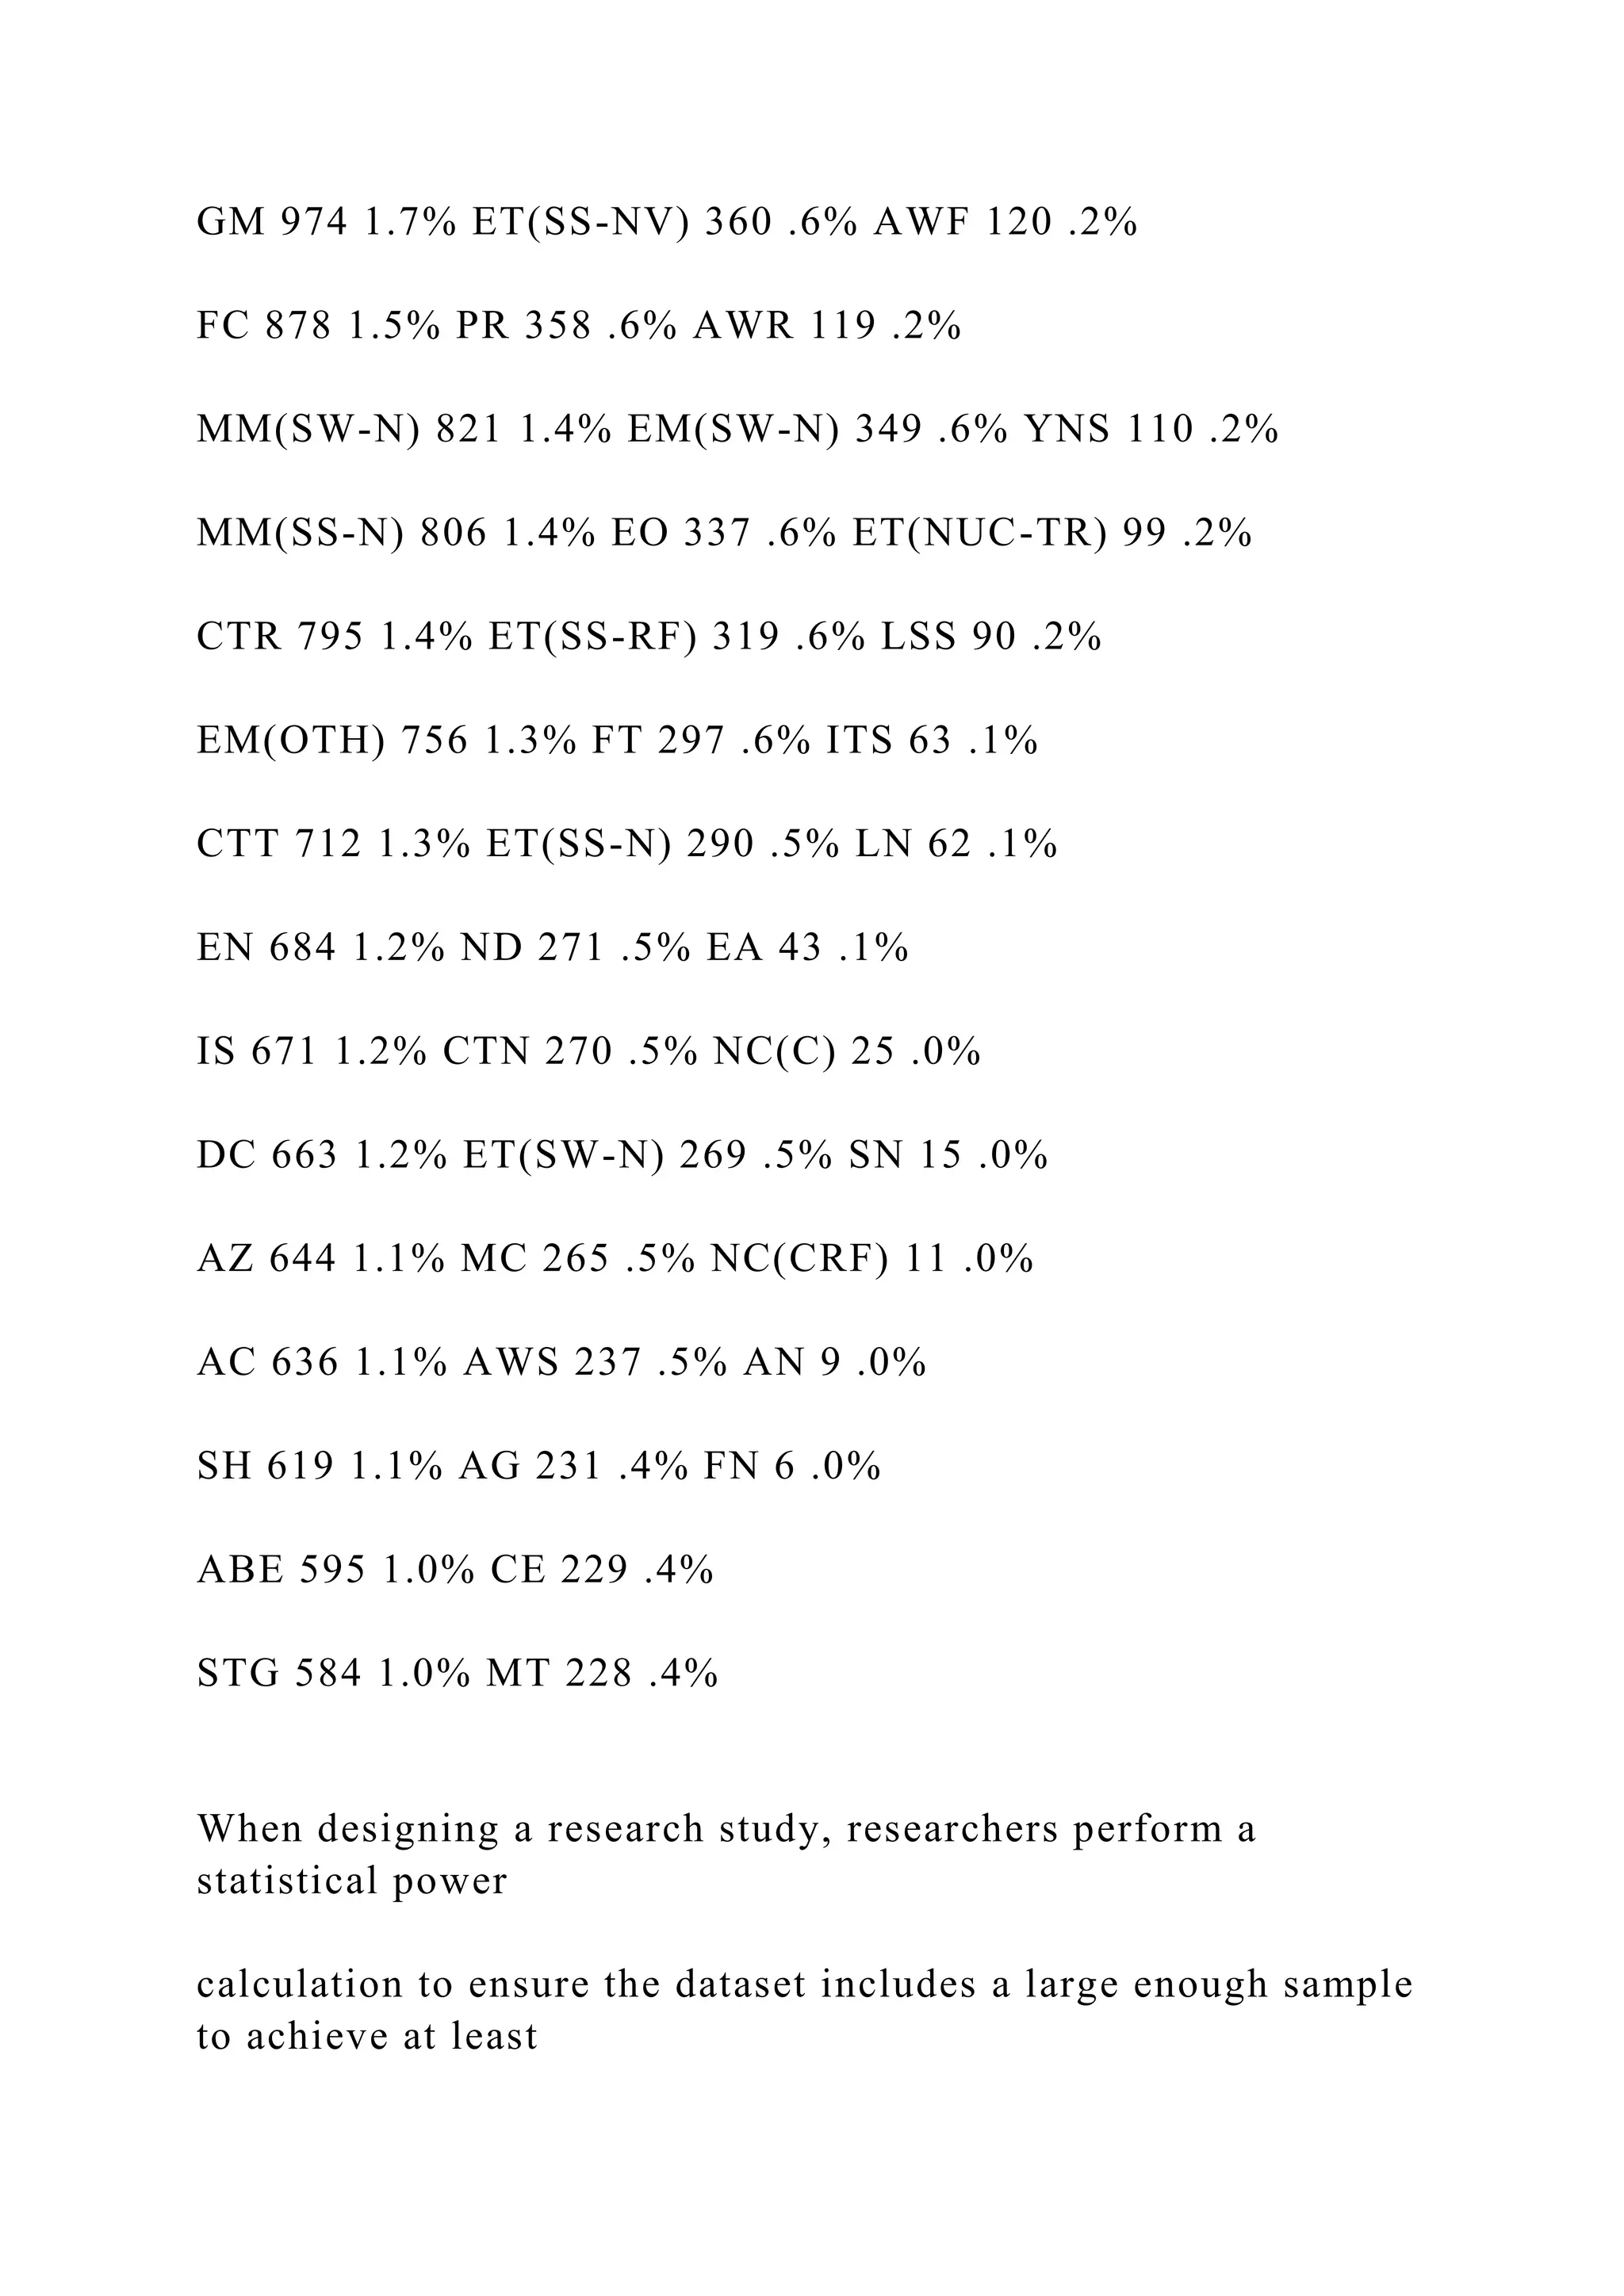
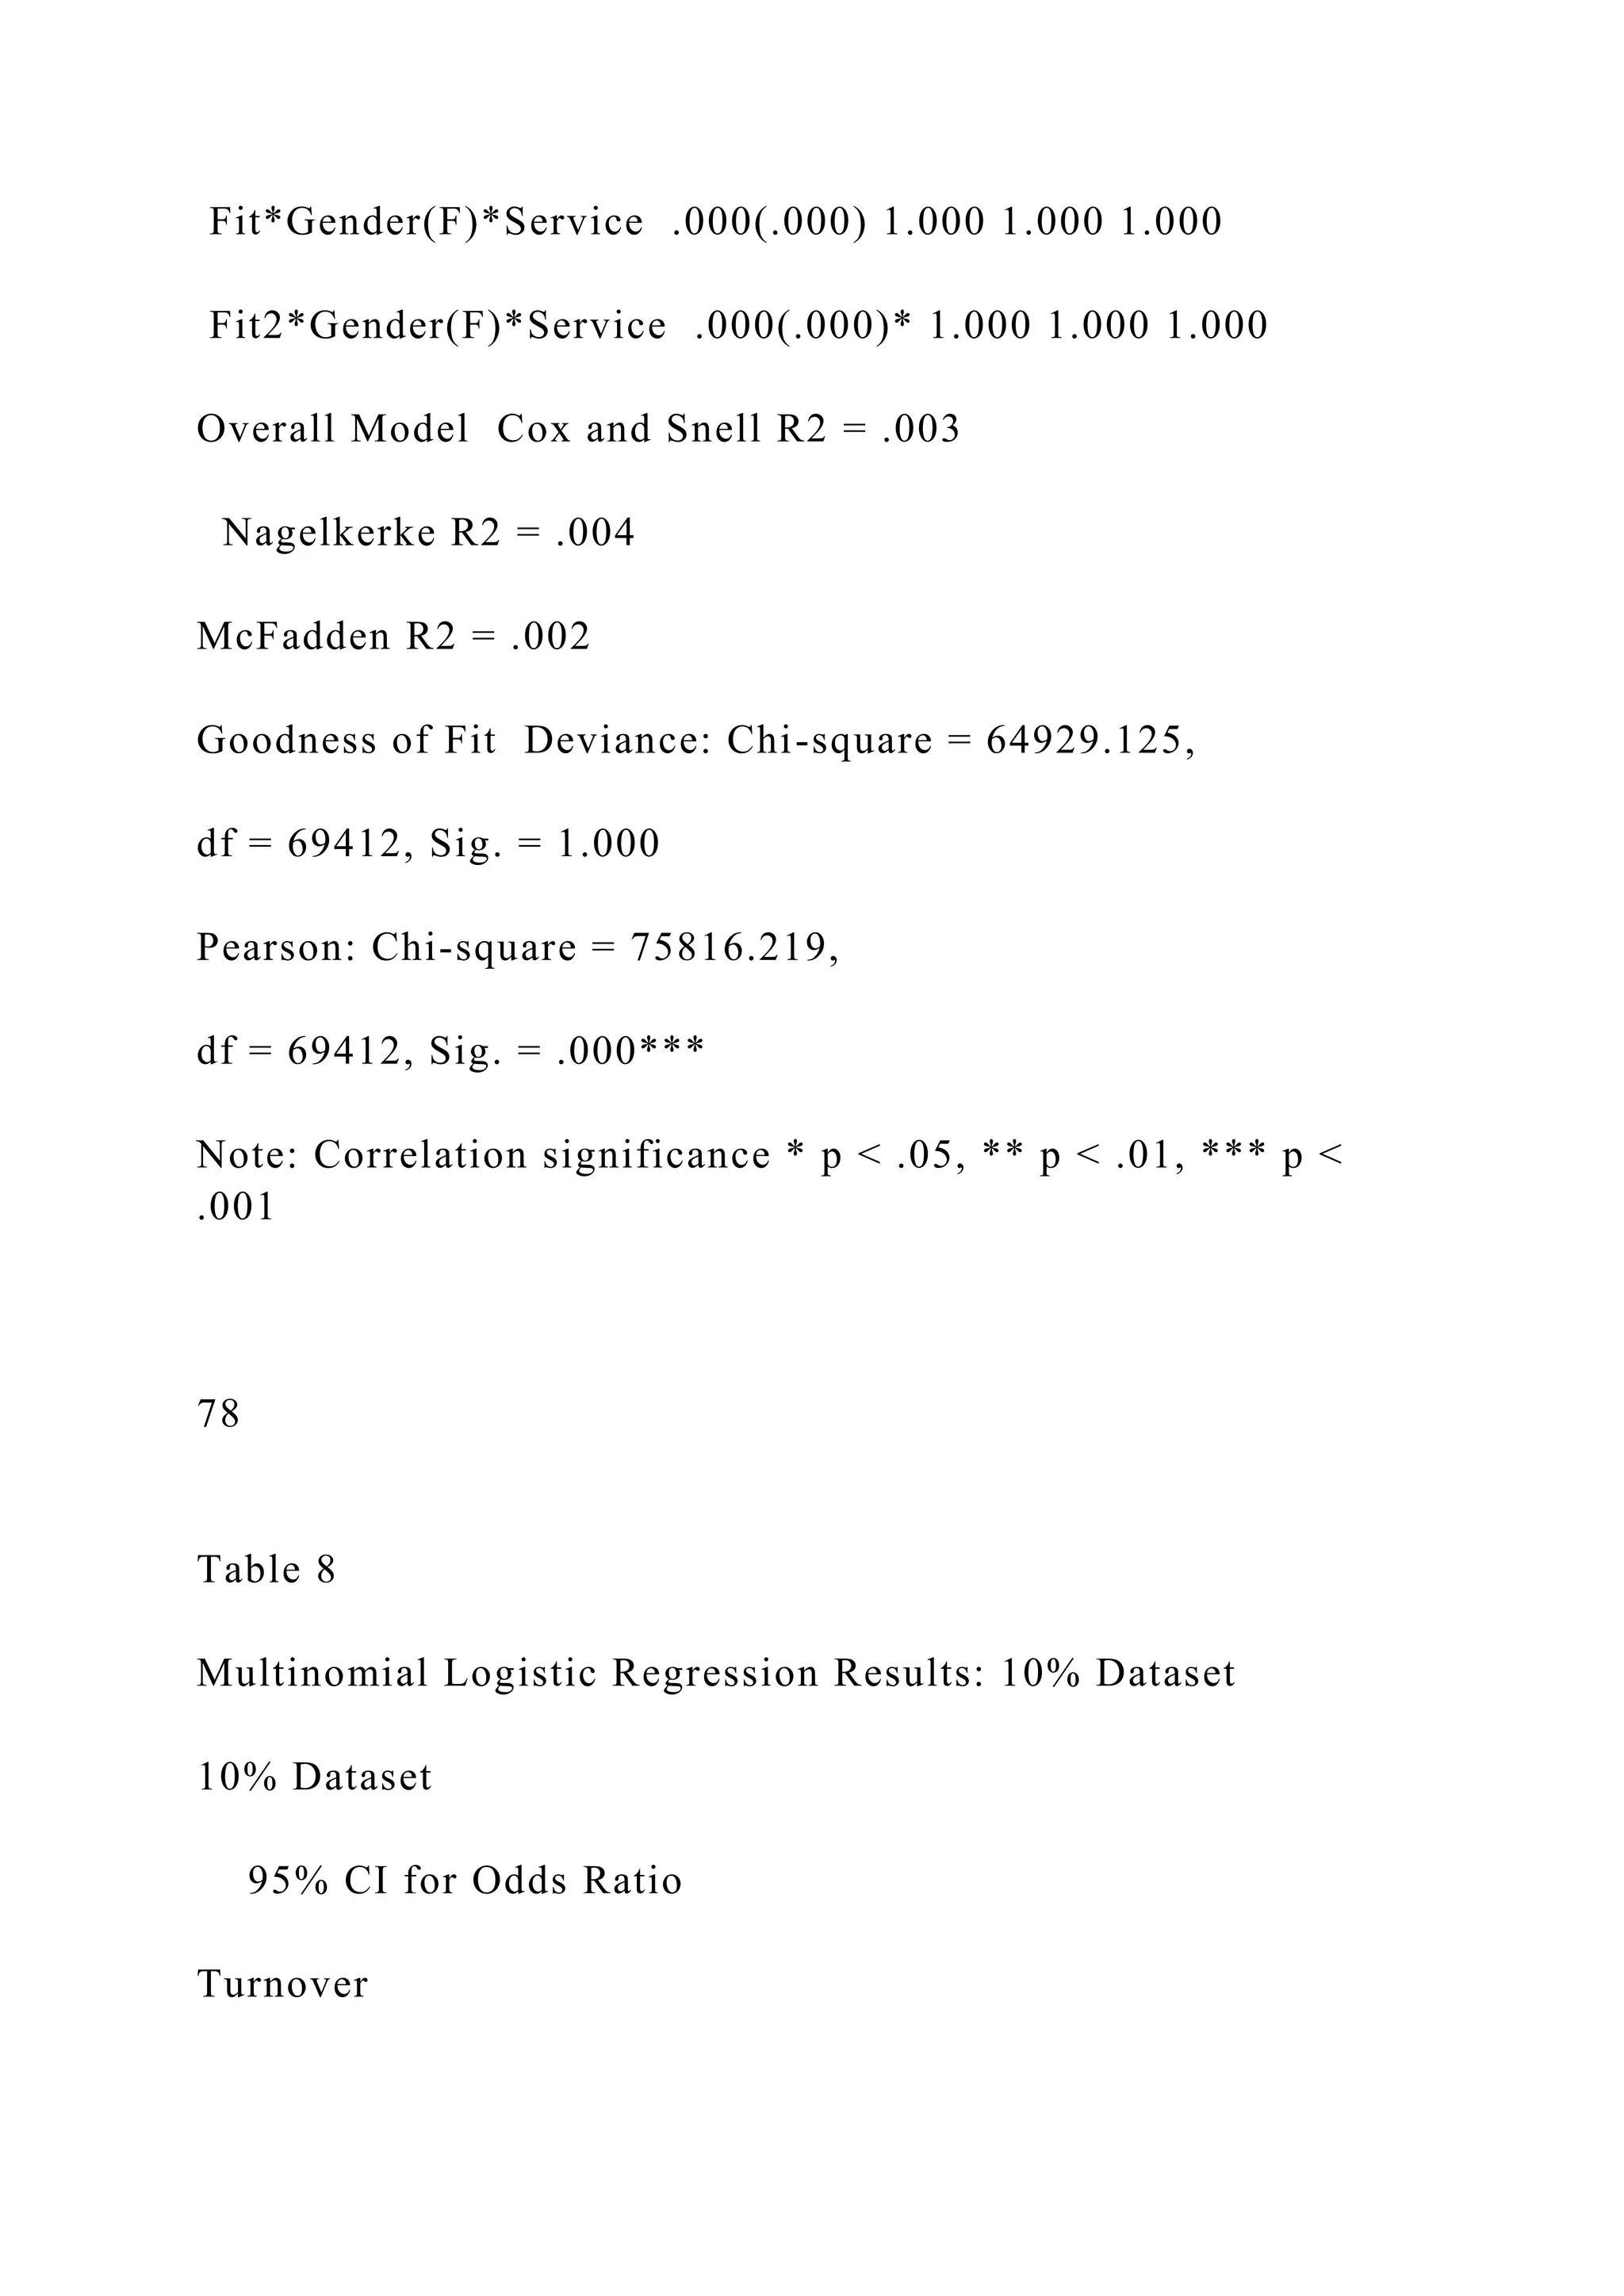
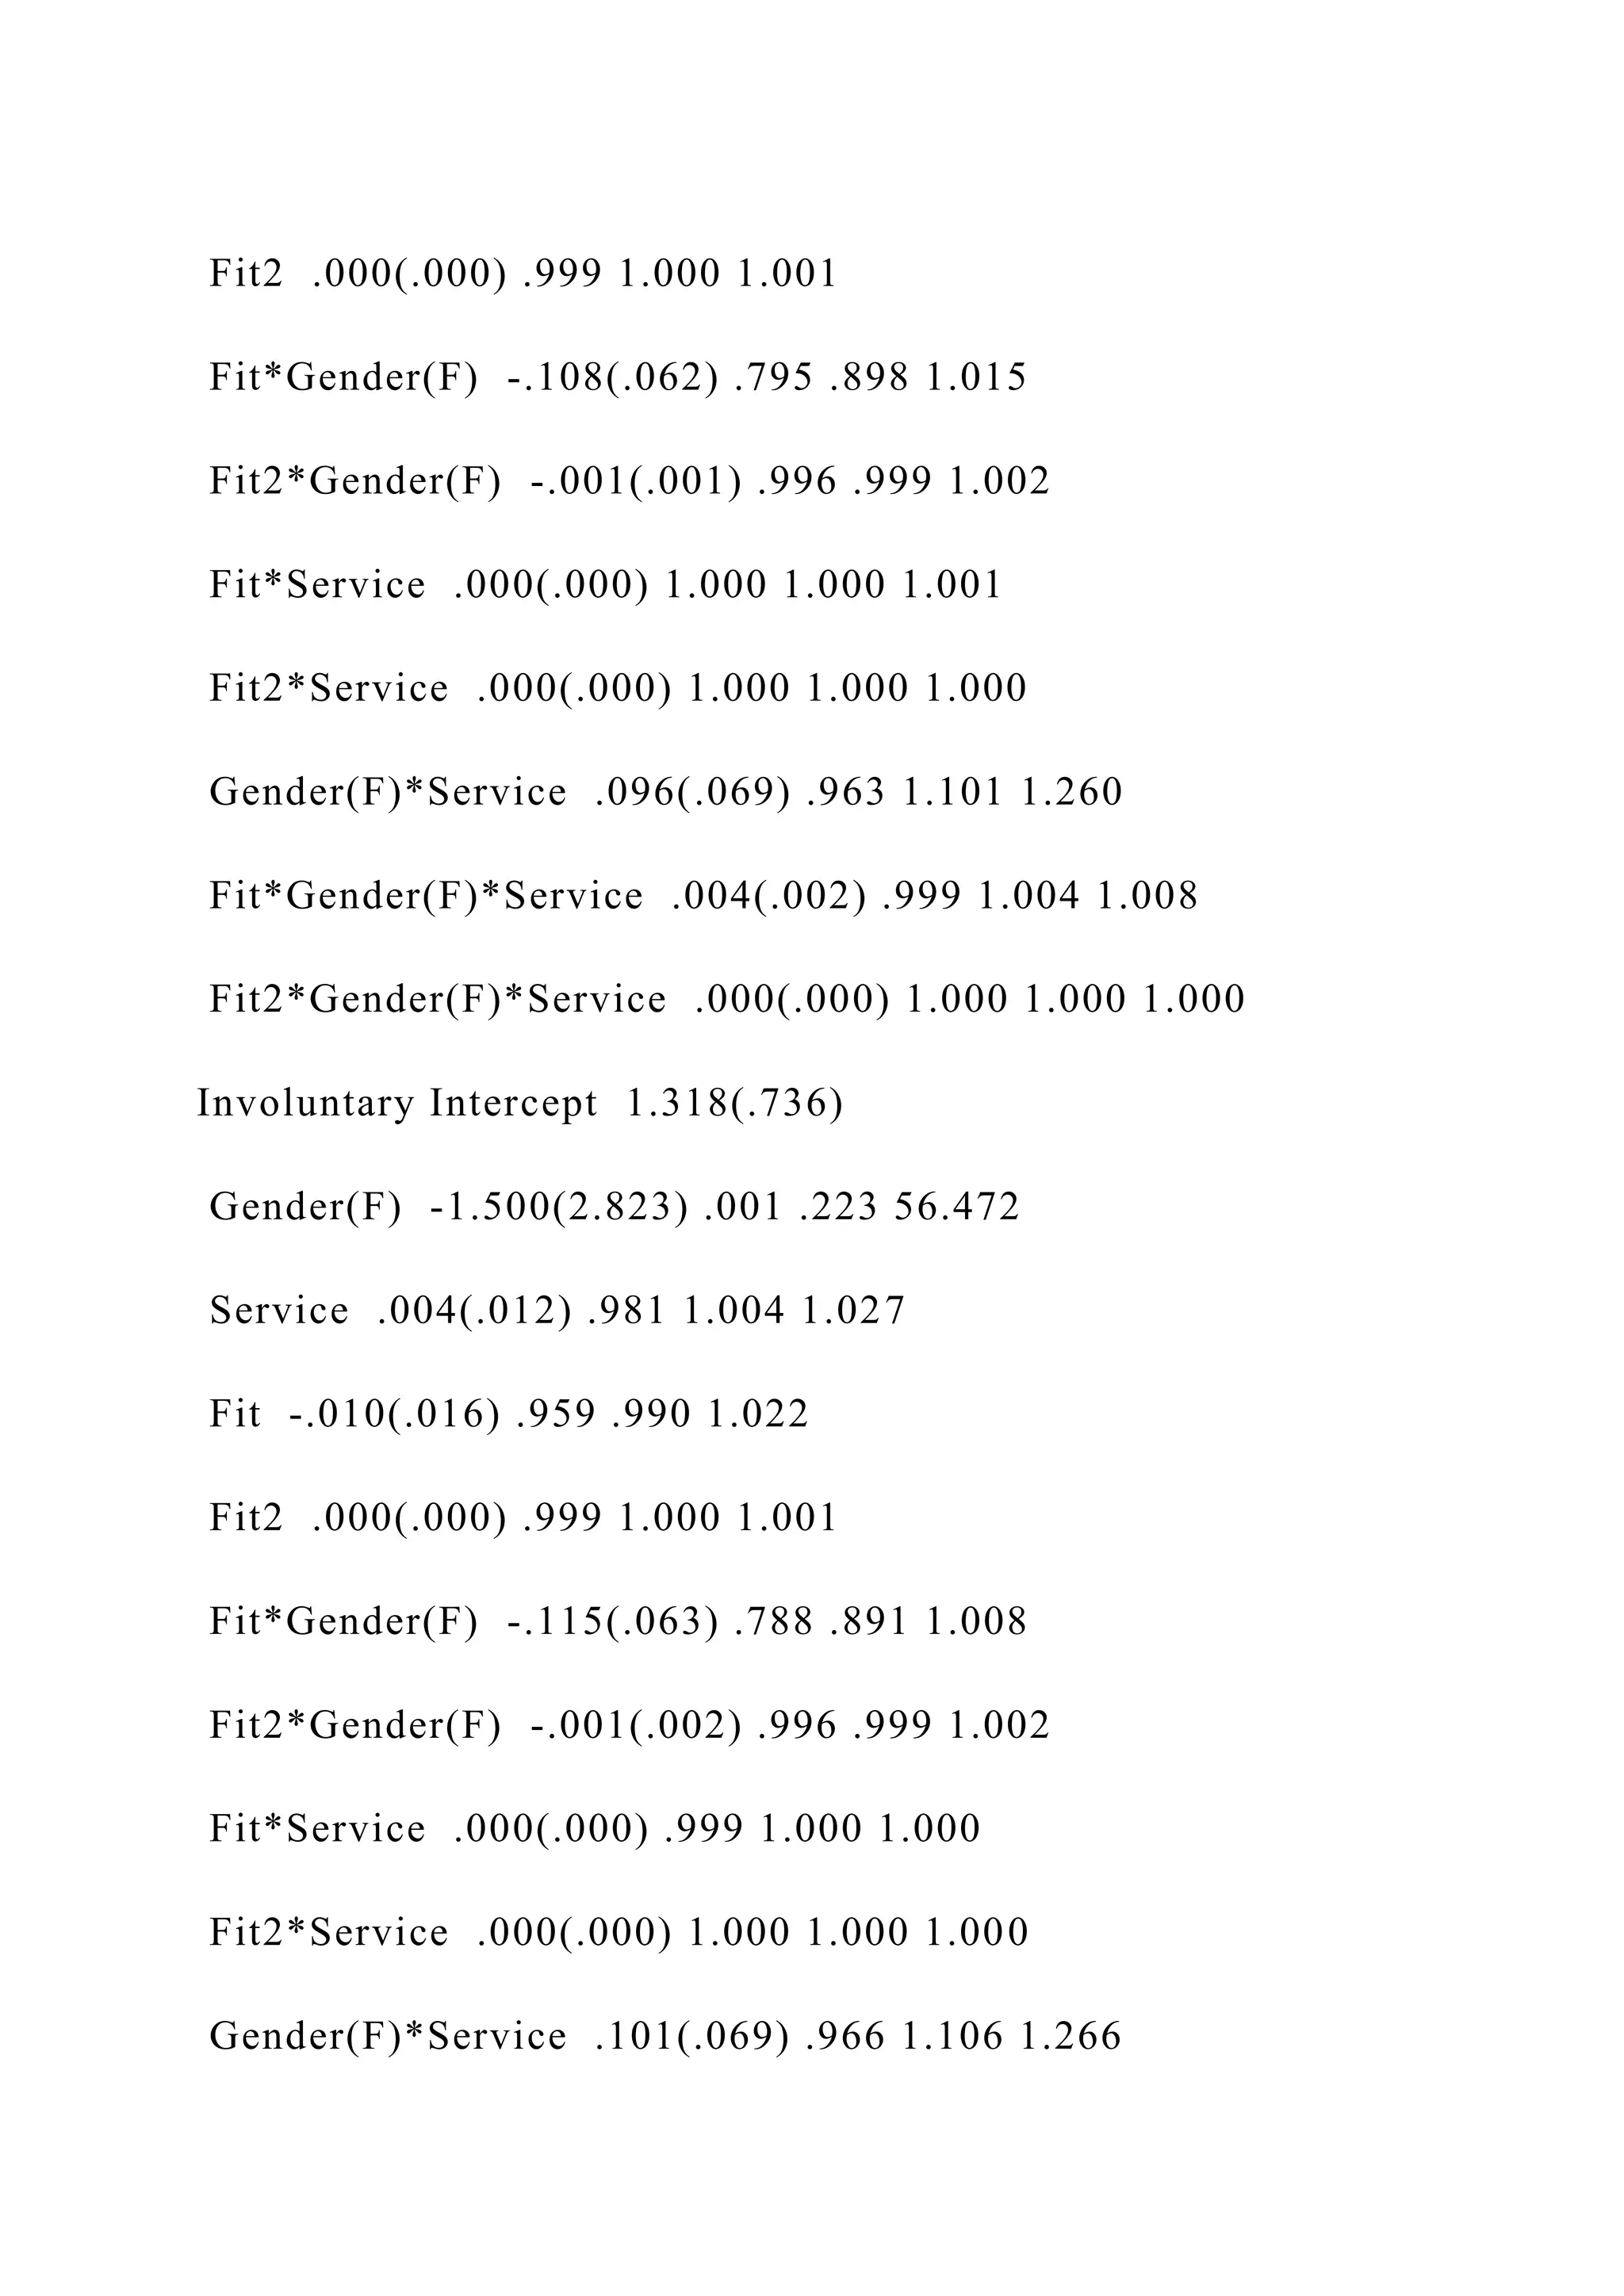
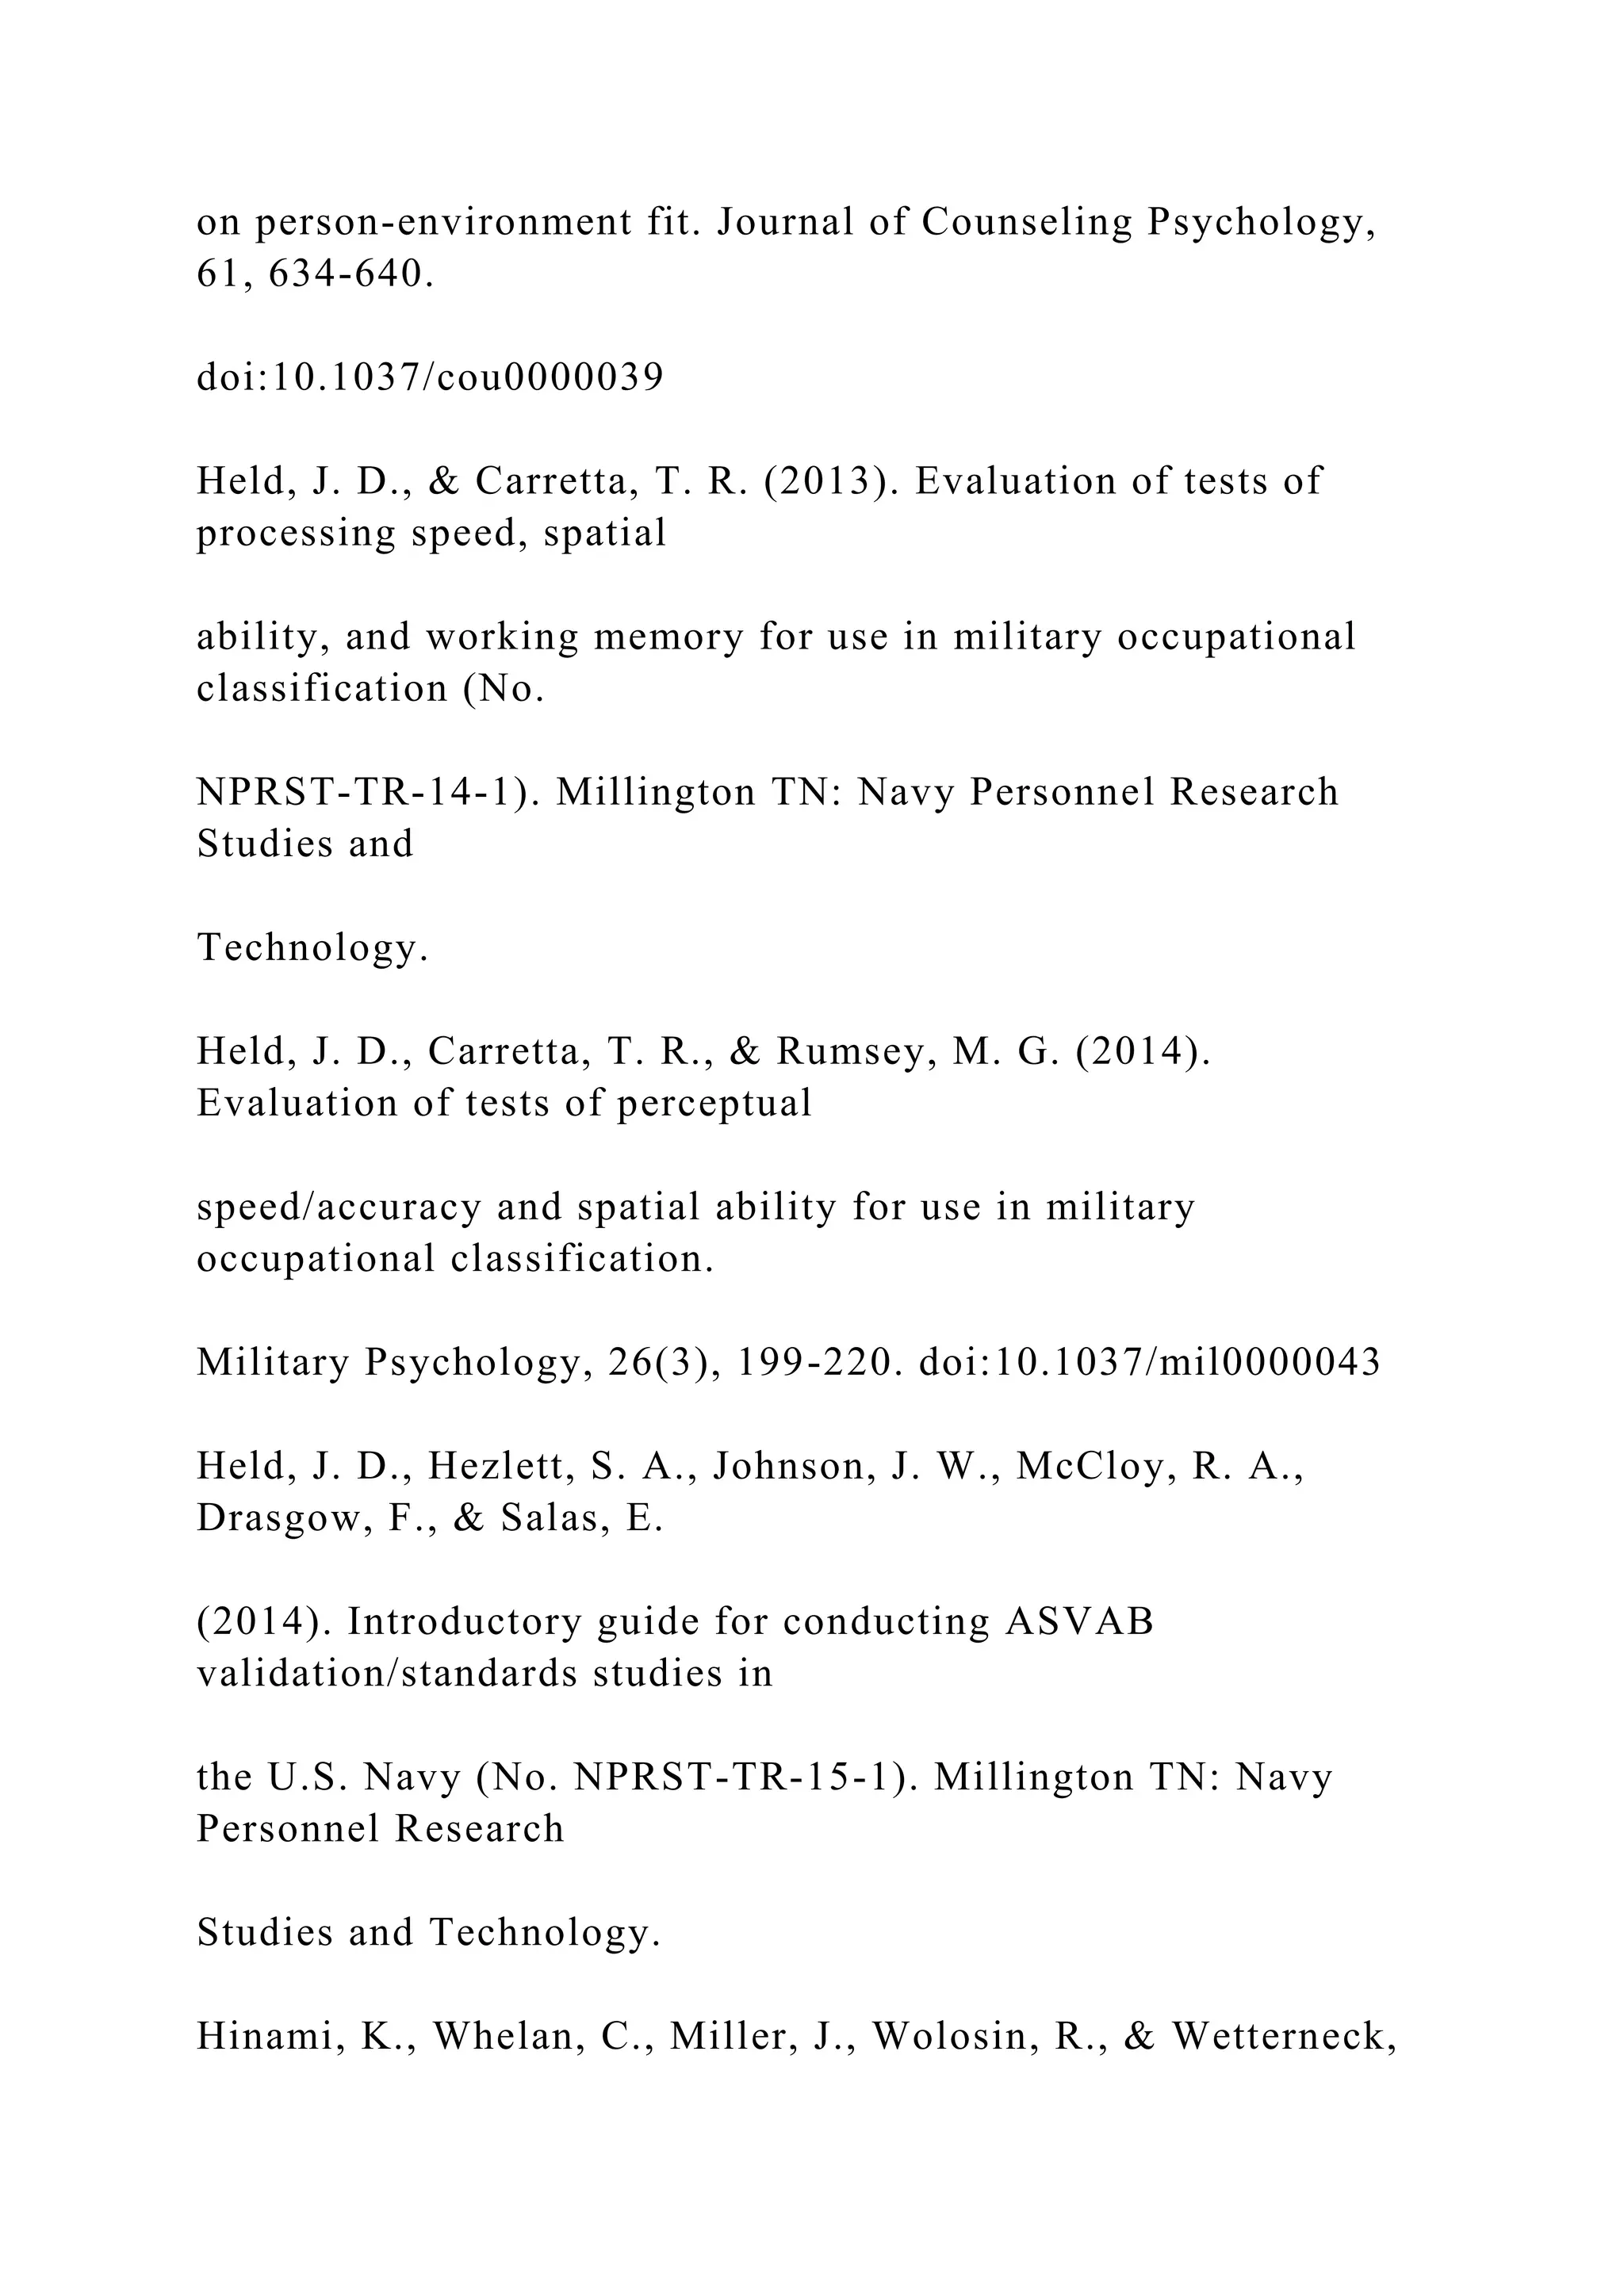
![• MIRR = {[FV(positive cash flows, reinvestment rate)/-
PV(negative cash flows, finance rate)]^(1/n)}-1.
The modified internal rate of return (MIRR) is a financial
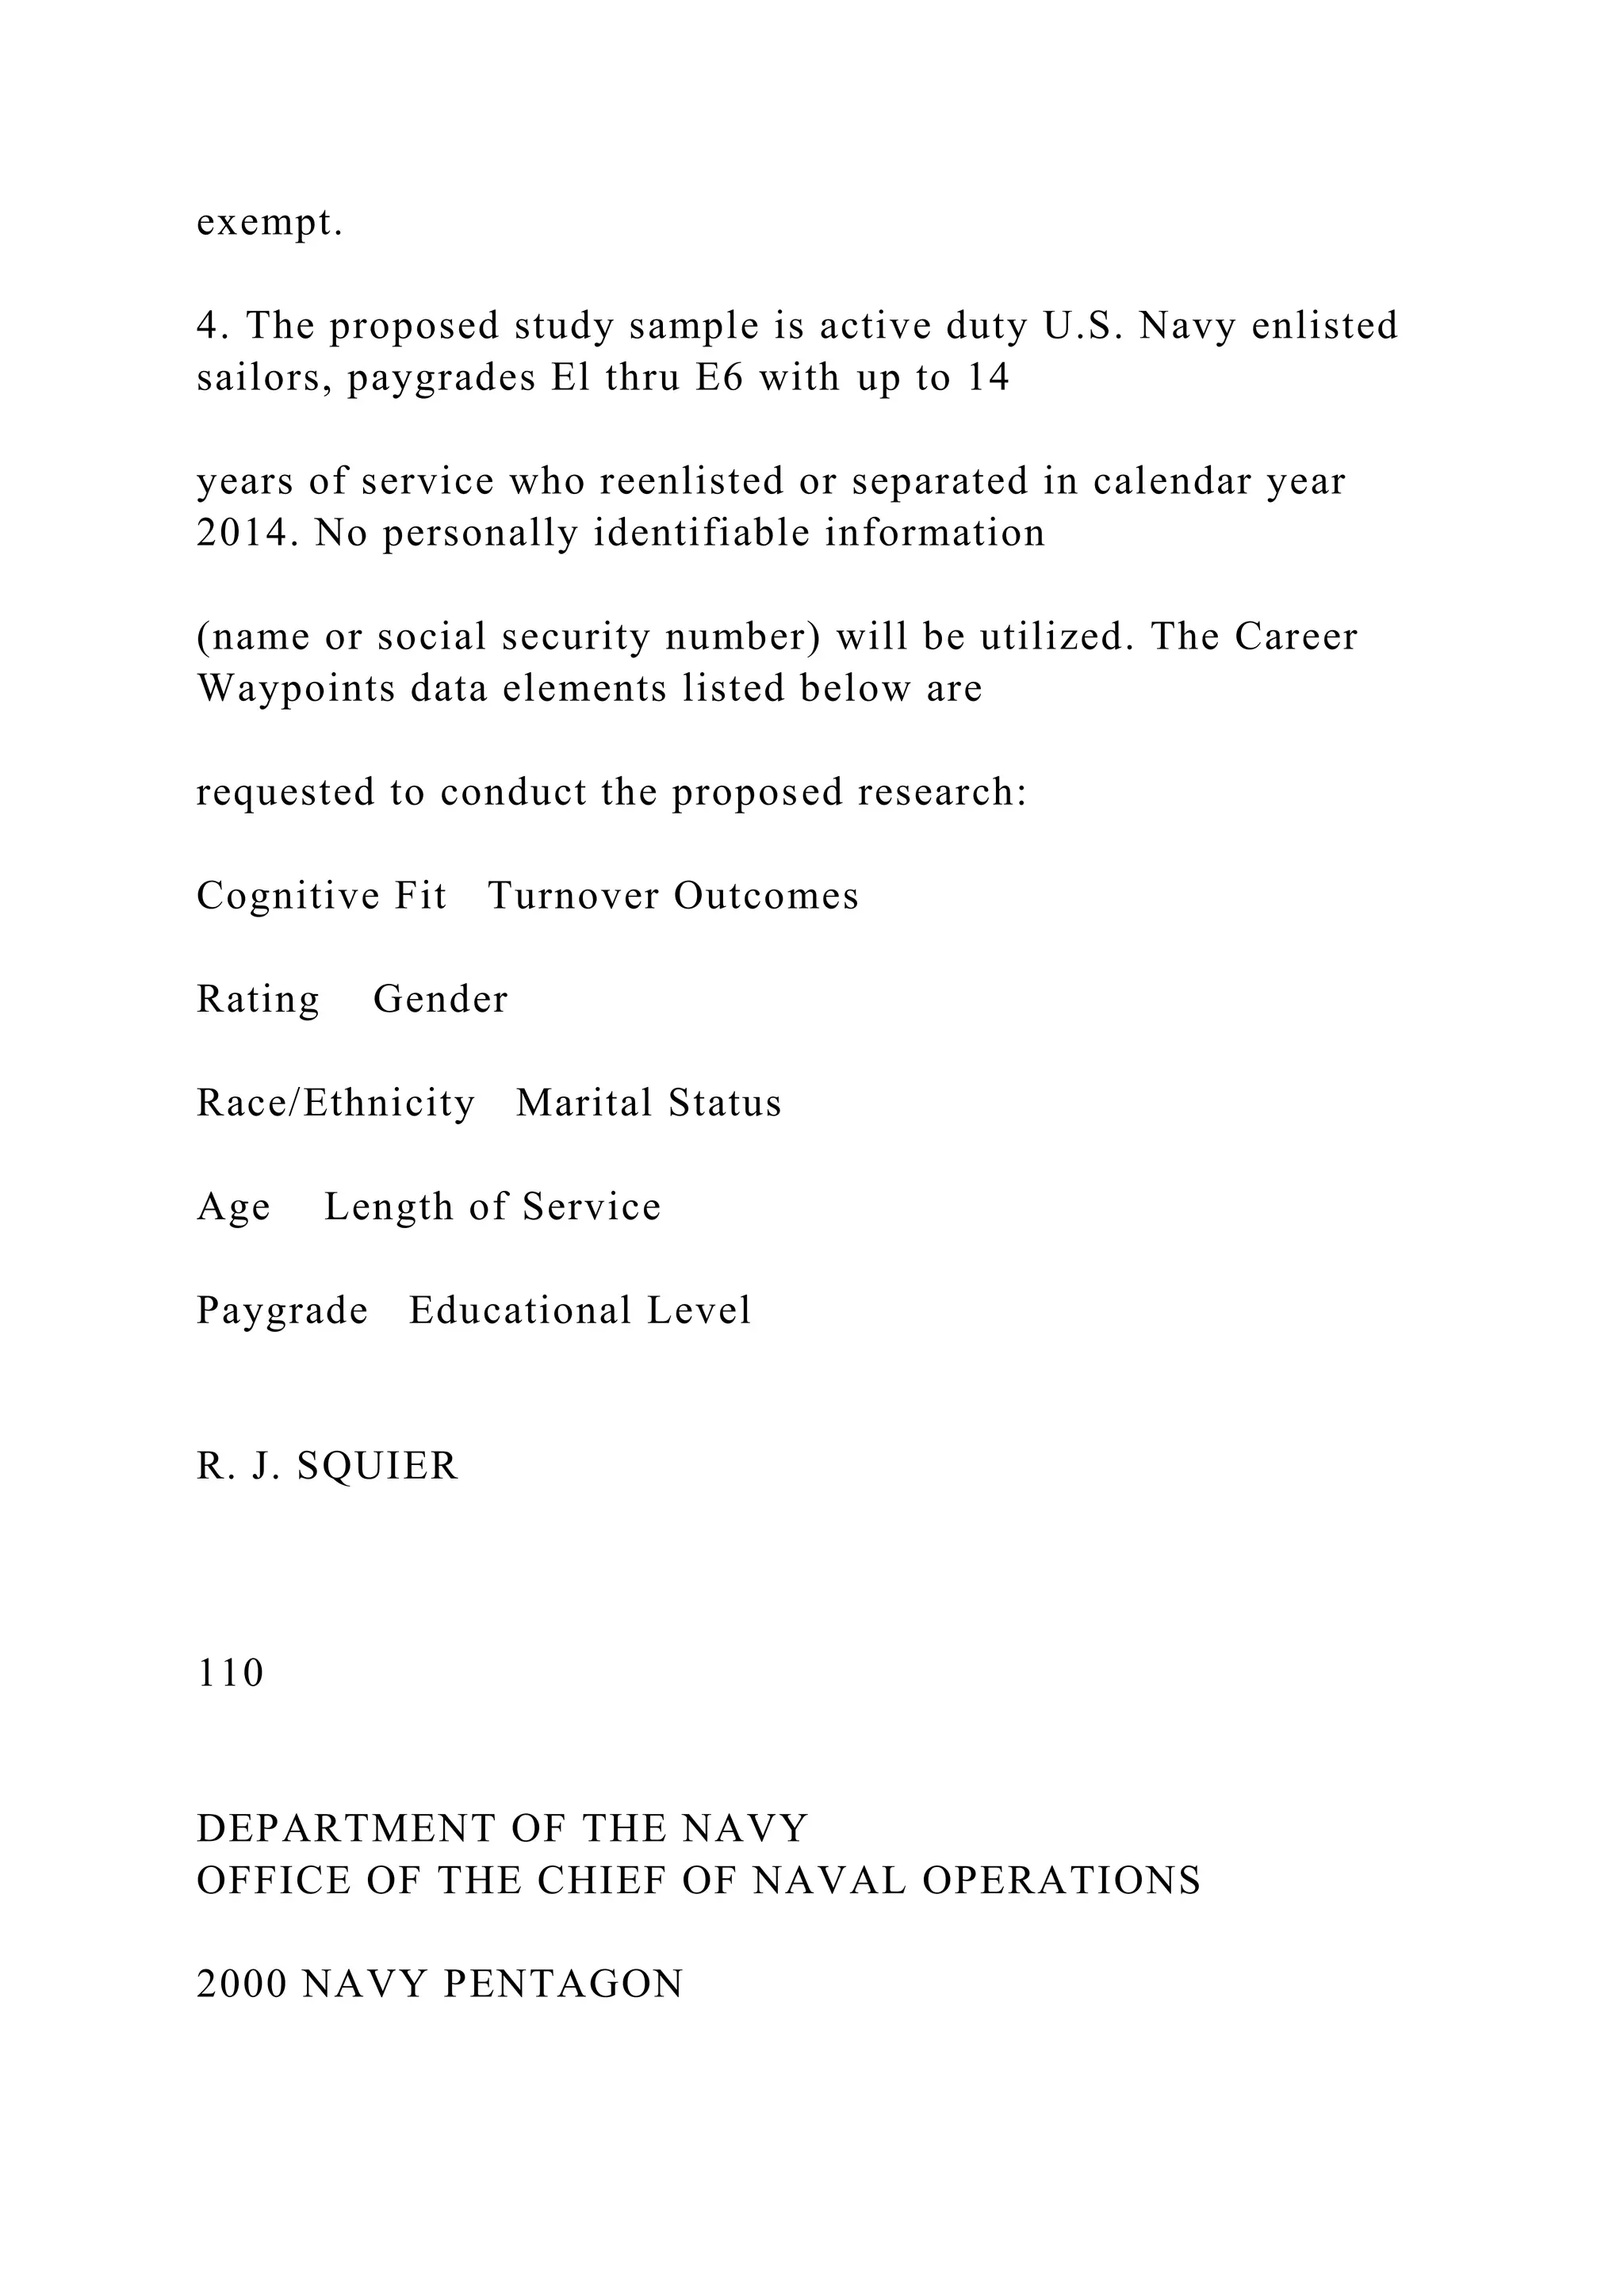
measure
of an investment's attractiveness. It is used in capital budgeting
to
rank alternative investments of equal size. As the name implies,
MIRR is a modification of the internal rate of return (IRR) and
as
such aims to resolve some problems with the IRR.
While there are several problems with the IRR, MIRR resolves
two
of them. Firstly, IRR assumes that interim positive cash flows
are
reinvested at the same rate of return as that of the project that
generated them. This is usually an unrealistic scenario and a
more
634
likely situation is that the funds will be reinvested at a rate
closer to
the firm's cost of capital. The IRR therefore often gives an
unduly
optimistic picture of the projects under study. Generally, for
comparing projects more fairly, the weighted average cost of
capital
should be used for reinvesting the interim cash flows. Secondly,
more than one IRR can be found for projects with alternating
positive and negative cash flows, which leads to confusion and
ambiguity. MIRR finds only one value.](https://image.slidesharecdn.com/chapter11capitalbudgetingfromfinancebyboundlessisus-221019024242-5b9717e7/75/Chapter-11-Capital-Budgeting-from-Finance-by-Boundless-is-us-docx-59-2048.jpg)


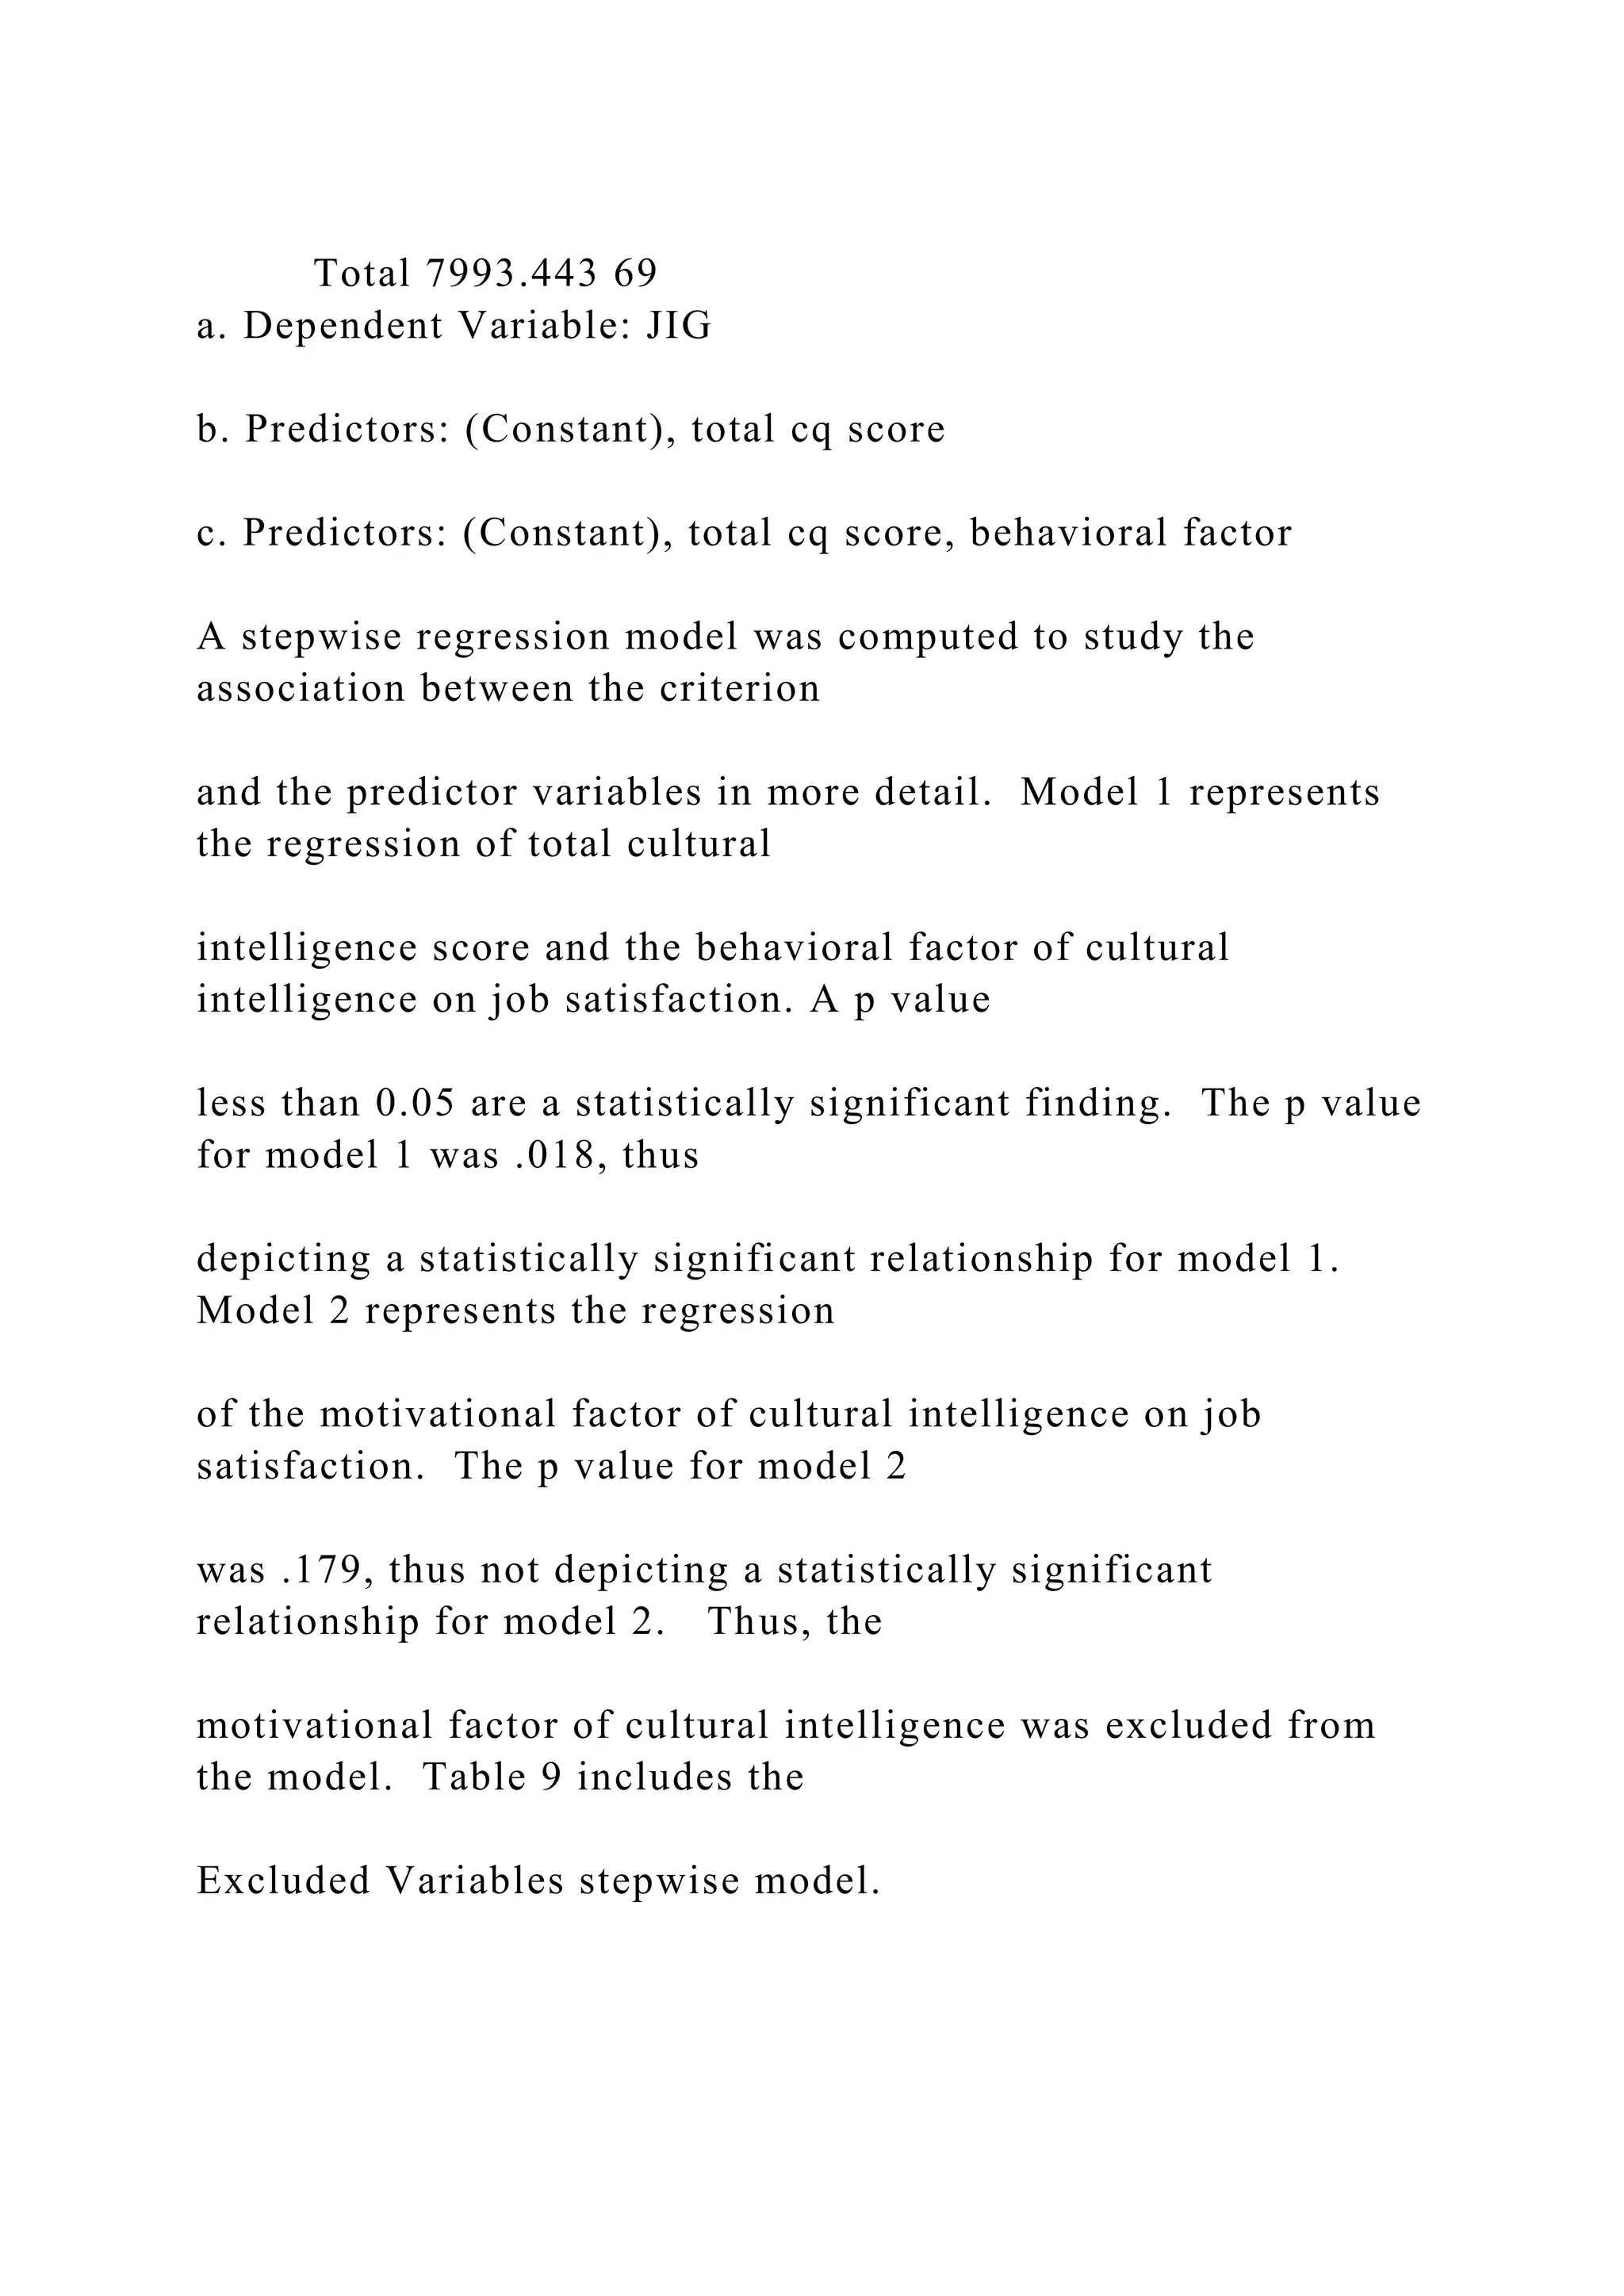


![and non-academic organizations), please send an email to
[email protected]
Part III, Job in General Survey
111
112
Appendix B: Cultural Intelligence Permission Letter
113
Appendix C: JIG Permission Letter
Chapter 1: IntroductionBackgroundStatement of the
ProblemPurpose of the StudyTheoretical FrameworkResearch](https://image.slidesharecdn.com/chapter11capitalbudgetingfromfinancebyboundlessisus-221019024242-5b9717e7/75/Chapter-11-Capital-Budgeting-from-Finance-by-Boundless-is-us-docx-351-2048.jpg)


![[email protected]
Daniel F. Wallace, PhD
Copy to:
SEA 05H - Gray
SEA 05H – Markiewicz
The SAGE Handbook for Research in
Education: Engaging Ideas and Enriching
Inquiry
The Challenge of framing a Problem: What Is Your
Burning Question?
Contributors: Susan Harter
Edited by: Clifton F. Conrad & Ronald C. Serlin
Book Title: The SAGE Handbook for Research in Education:
Engaging Ideas and Enriching Inquiry
Chapter Title: "The Challenge of framing a Problem: What Is
Your Burning Question?"
Pub. Date: 2006
Access Date: December 2, 2019](https://image.slidesharecdn.com/chapter11capitalbudgetingfromfinancebyboundlessisus-221019024242-5b9717e7/75/Chapter-11-Capital-Budgeting-from-Finance-by-Boundless-is-us-docx-590-2048.jpg)


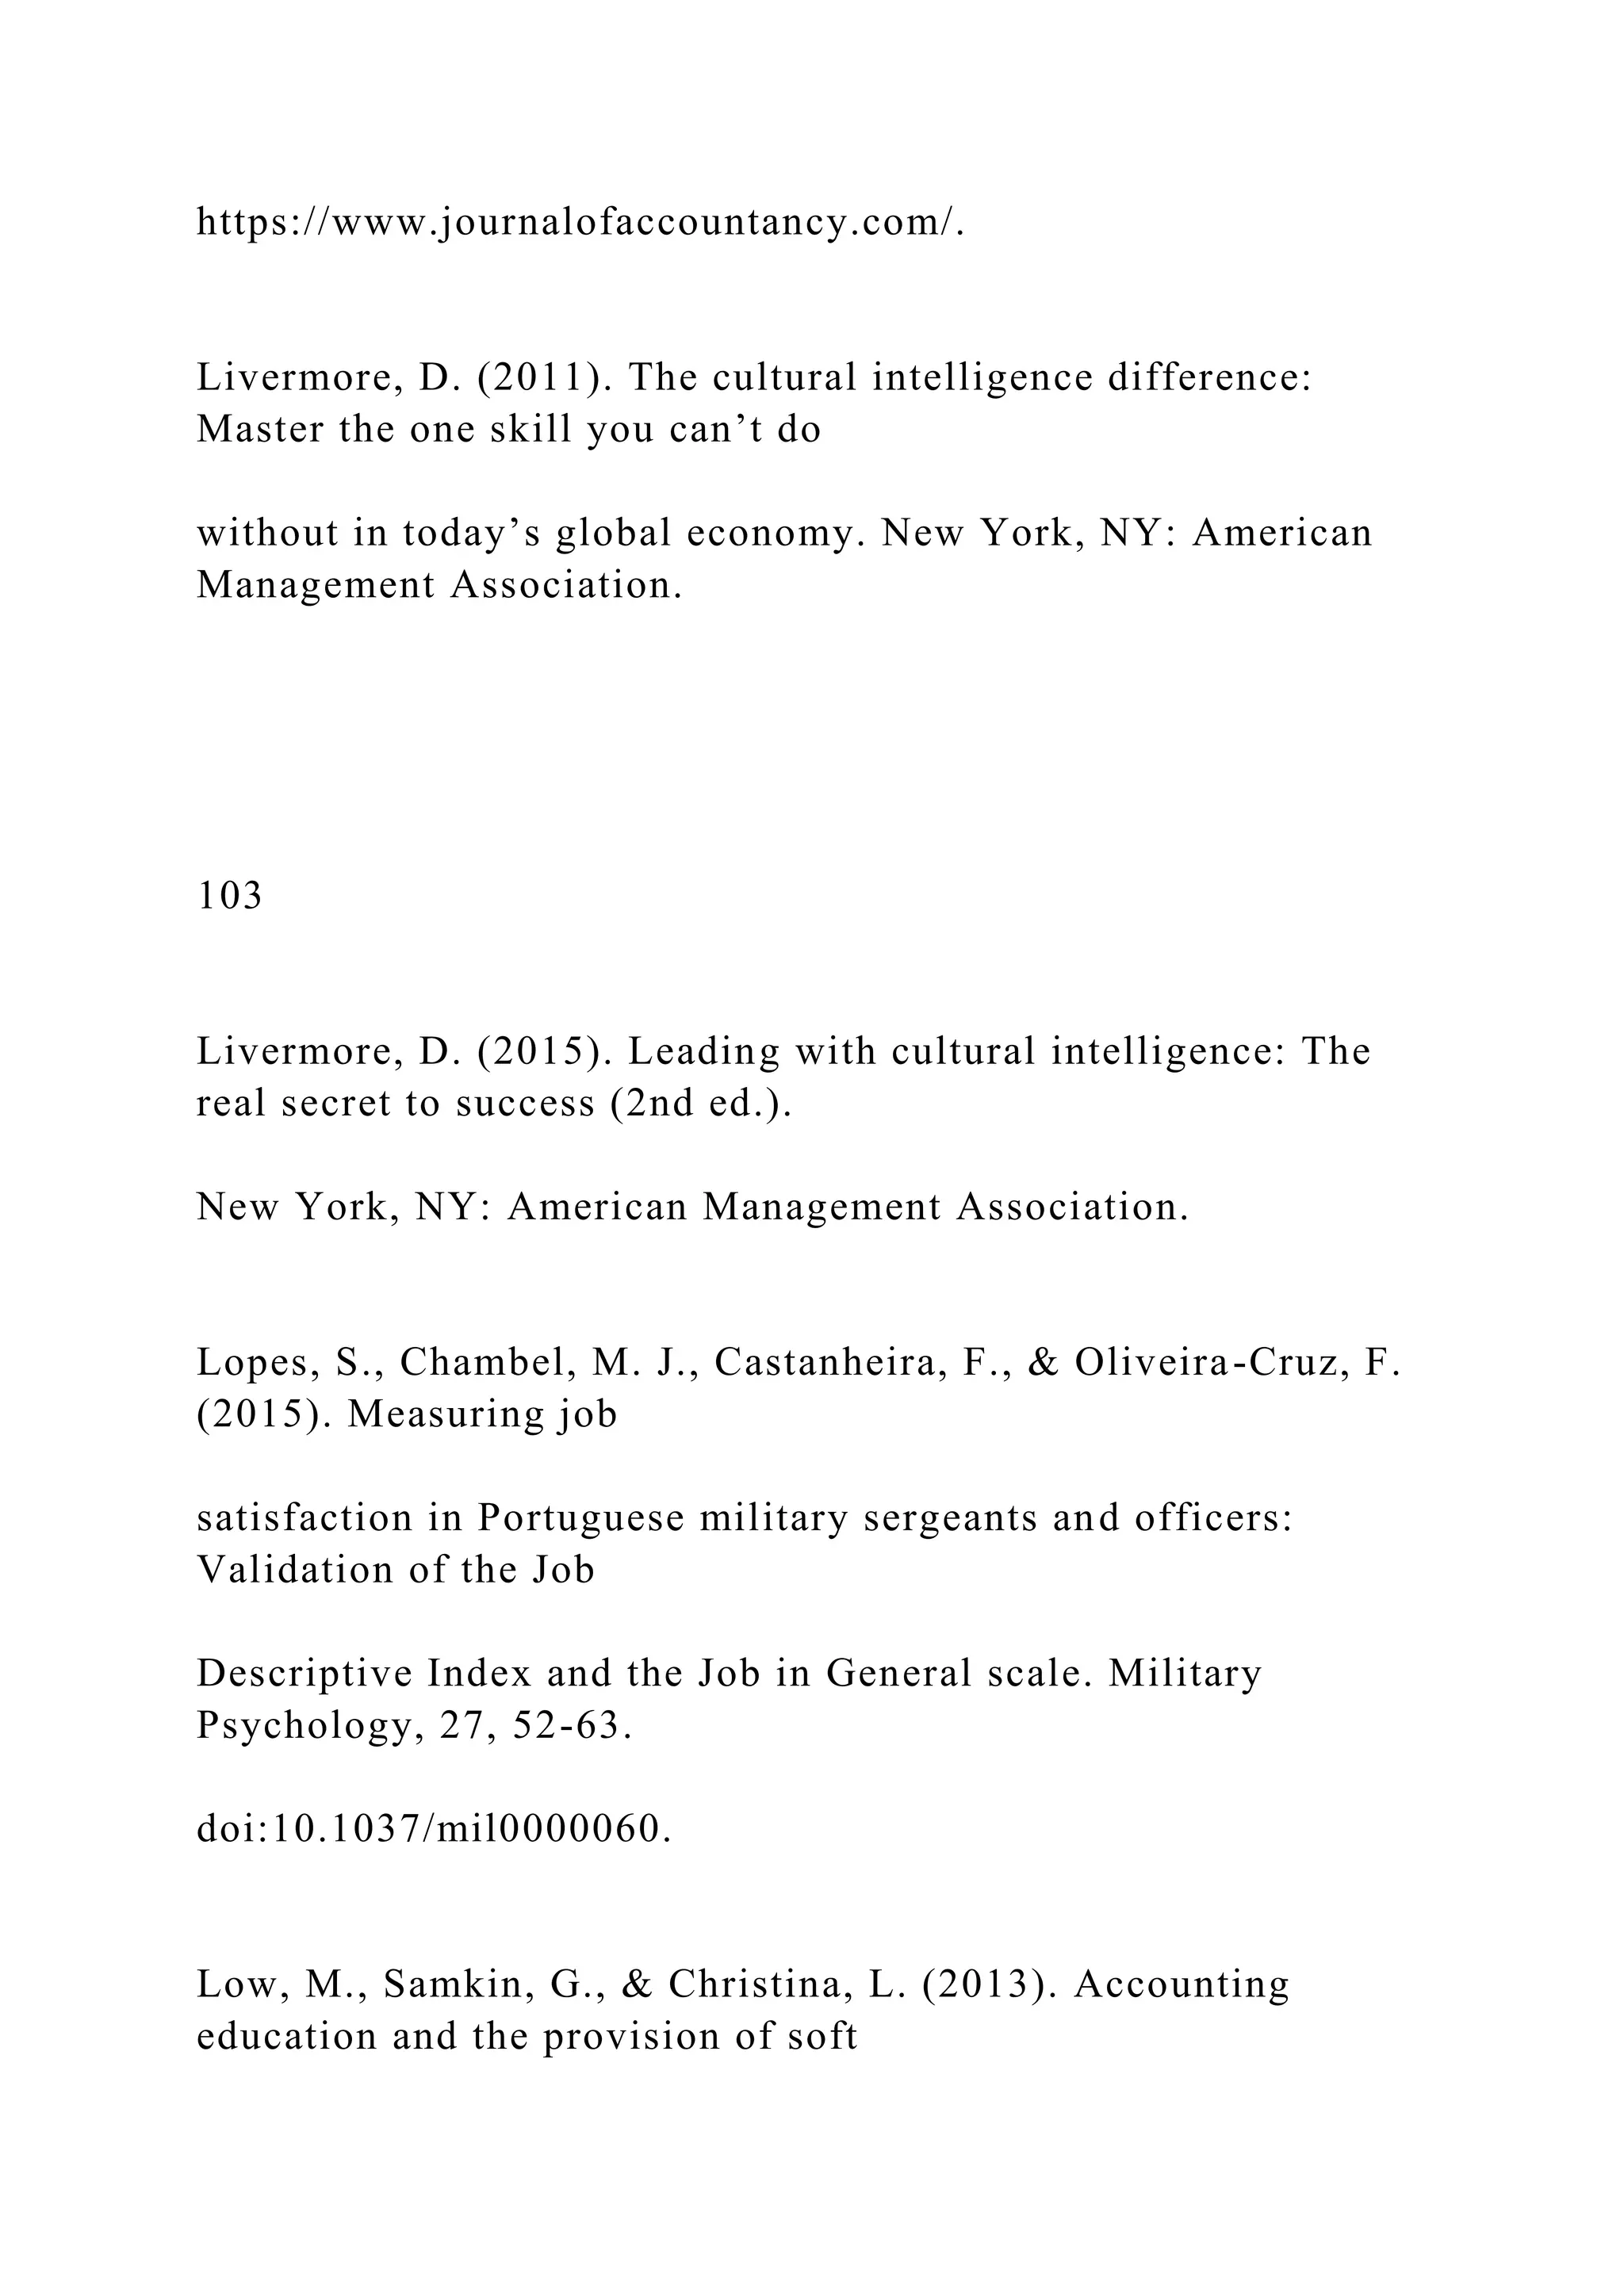
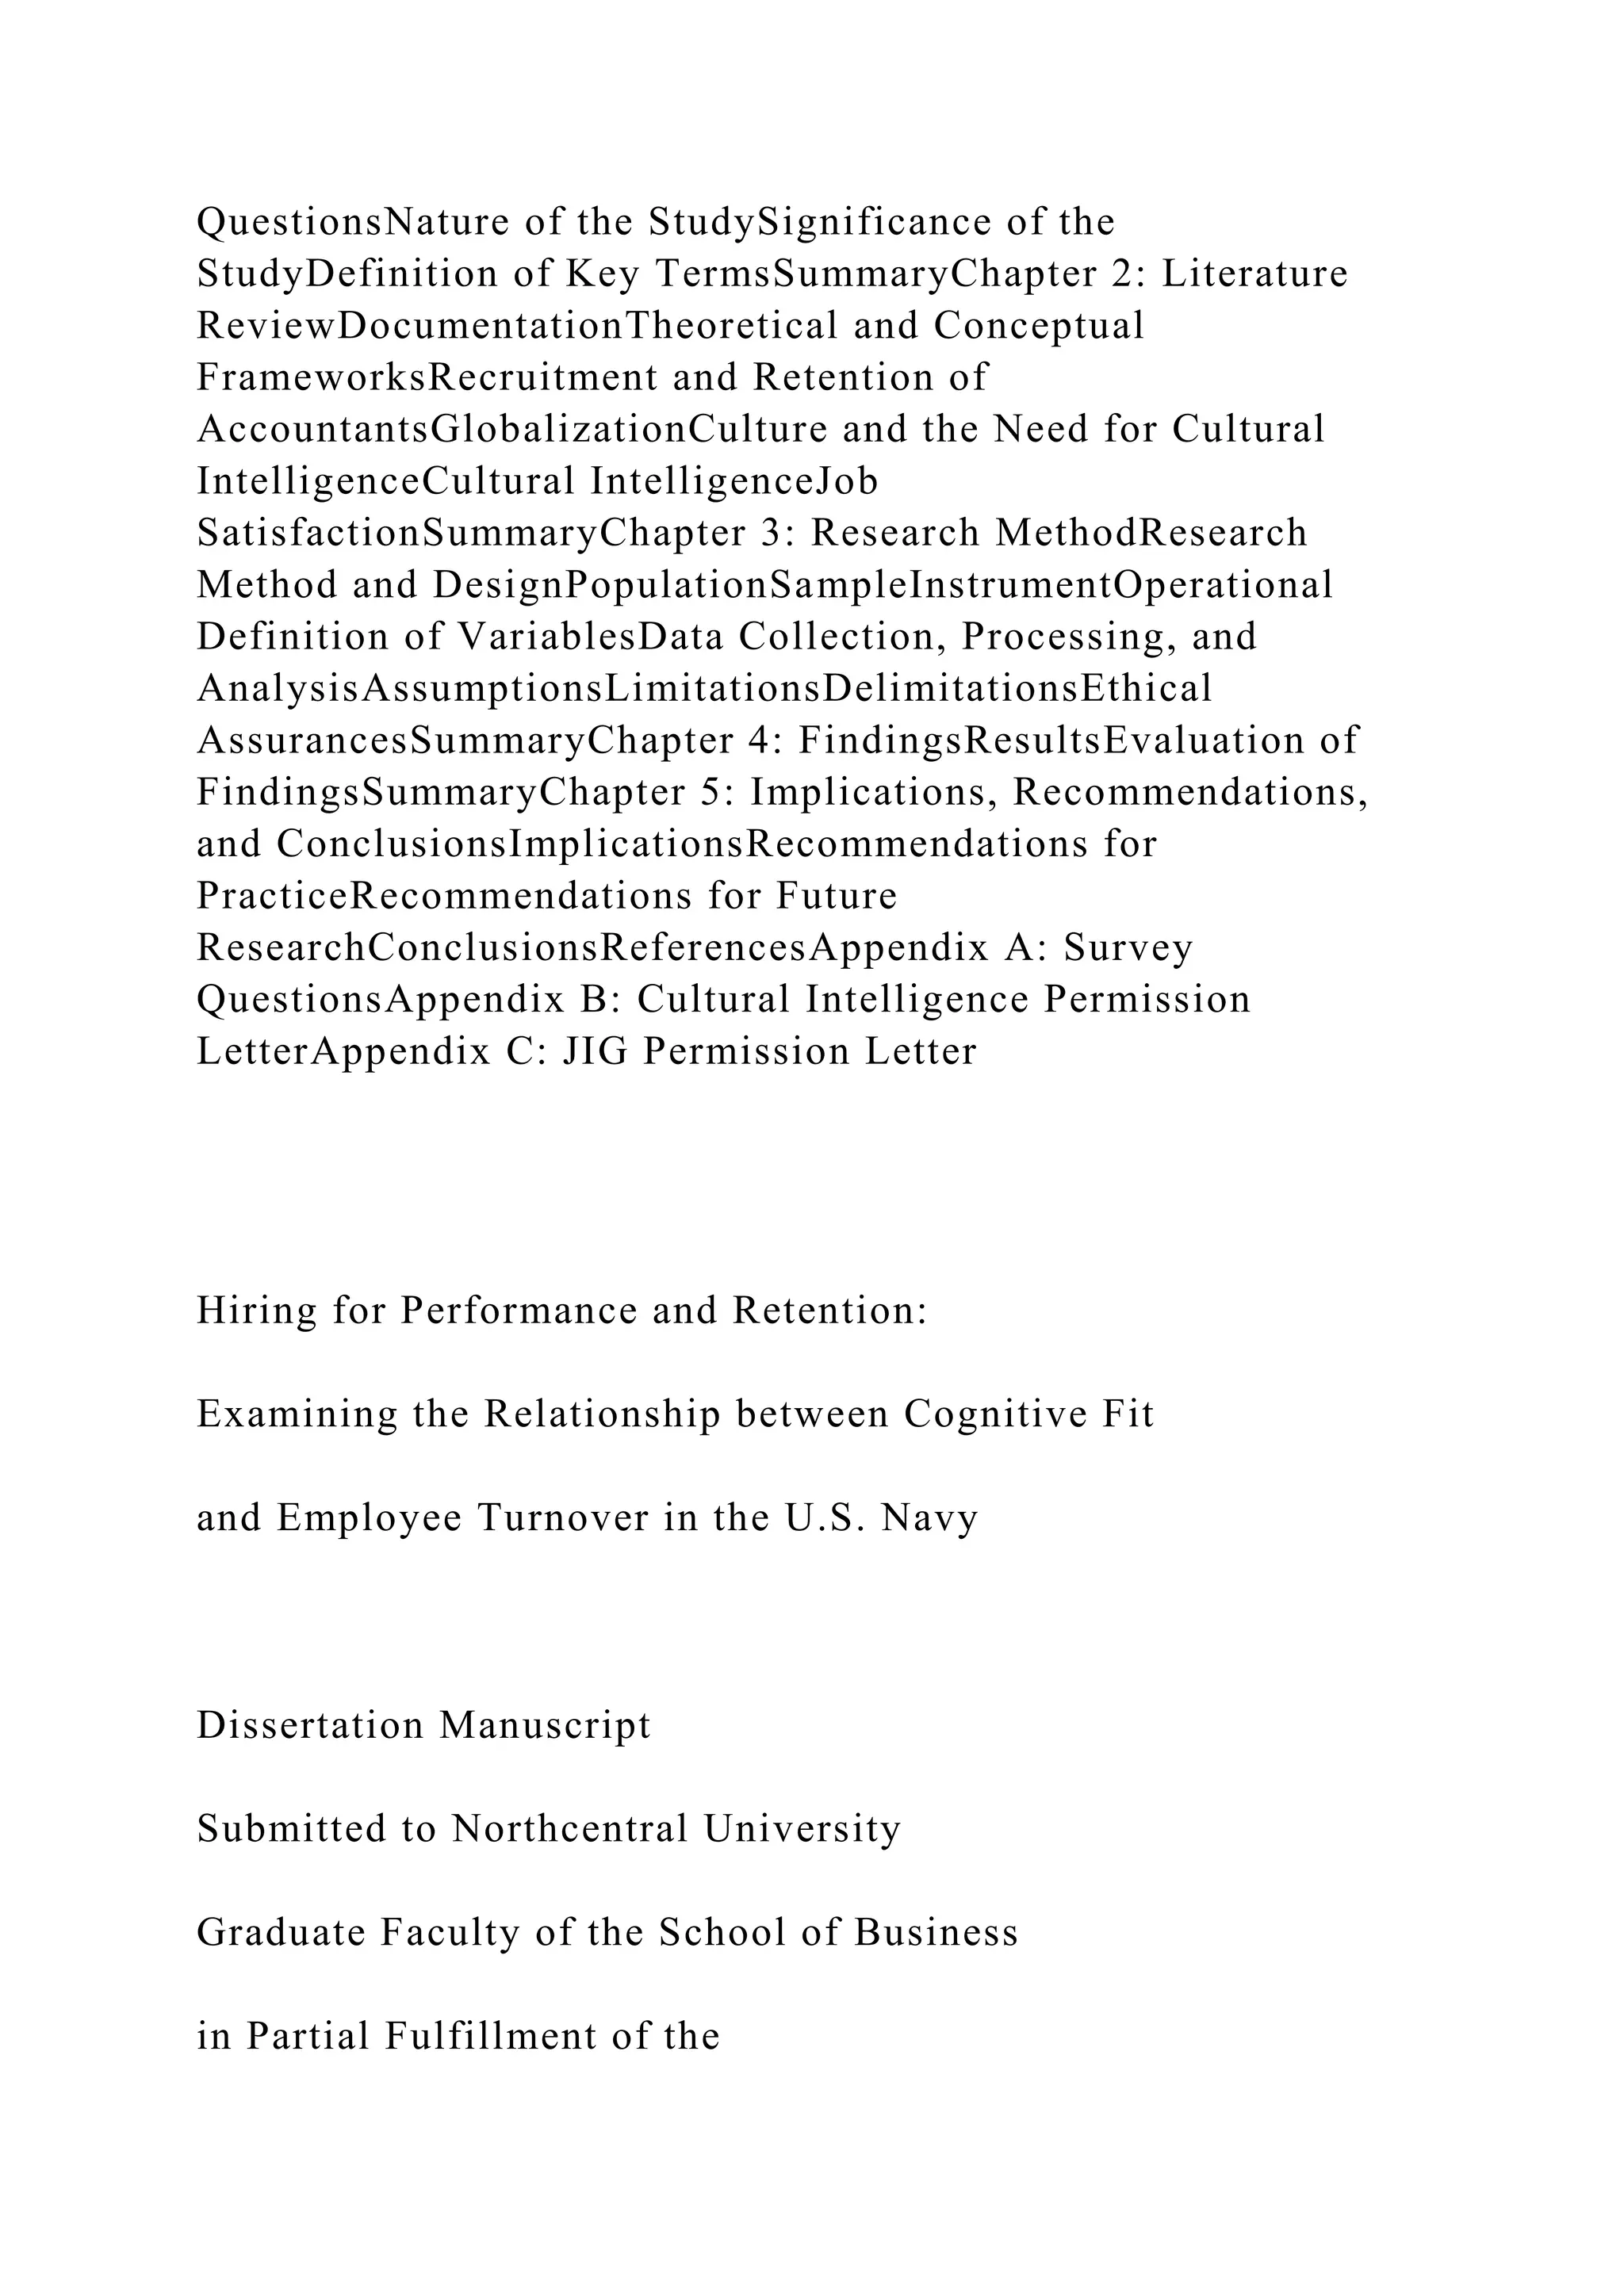
![Page 13 of 18
The SAGE Handbook for Research in Education: Engaging
Ideas and
Enriching Inquiry
able studies that never go beyond the elitist journals that are
shared only with like-minded scientists.) Others
have had the courage to identify issues of relevance, attempting
to stimulate public interest. One such goal
is to redress certain societal ills. Three such themes are
identified in closing this essay on the challenge of
framing a problem. Thus, it is critical that certain research-
minded investigators step out of their ivory towers
and challenge certain provocative claims, to do the needed
empirical research that will bring a sense of bal-
ance, accuracy, clarity, and realism.
In our own research, first, we have questioned the
generalization that there is rampant gender bias against
girls within the school system (American Association of
University Women [AAUW], 1992; Sadker & Sadker,
1994). Second, we have refined Gilligan's (1993) contention
that with the advent of adolescence, most girls
lose the ability to voice their opinions. Third, we have
challenged the claims of Baumeister, Smart, and Boden
(1996) that there is a “dark side to high self-esteem” in that it is
part of a constellation that predicts violence
toward others.
We believe that it is essential that dissemination of the results
of potentially relevant studies not result in over-
generalizations that can be misinterpreted, and therefore
misused, with regard to public policy. The opportu-](https://image.slidesharecdn.com/chapter11capitalbudgetingfromfinancebyboundlessisus-221019024242-5b9717e7/75/Chapter-11-Capital-Budgeting-from-Finance-by-Boundless-is-us-docx-627-2048.jpg)