This document discusses two damage models for predicting ductile fracture initiation: 1) the Rice and Tracey cavity growth model, which relates cavity growth rate to stress triaxiality and plastic strain increment, and predicts initiation when cavity radius reaches a critical value. 2) A damage work model, which combines plastic strain work with a term accounting for cavity growth related to hydrostatic stress, predicting initiation when damage work reaches a critical value. Finite element simulations of notched tensile specimens of two steel materials were performed to evaluate these models based on experimental crack initiation locations and steps. Both models were able to predict initiation location and step for a relatively constant critical damage value.
![156 R. Chaouadi et al.
Table 1. Chemical composition (wt-%)
C Si Mn P S Cr Mo Ni
18MND5 0.18 0.26 1.55 0.007 0.002 0.18 0.50 0.65
22NiMoCr37 0.30 0.23 0.71 0.009 0.011 0.47 0.80 0.71
Table 2. Mechanicalproperties
0.2% yield stress Tensilestrength Elongation Reduction of area
#u(MPa) ~r~(MPa) ~% A%
18MND5(20°C) 525 670 22.5 70
22NiMoCr37(100°C) 517 670 19.8 61
Furthermore, all the tests have been performed under controlled displacement at a constant
crosshead speed. The load and the crosshead displacement are continuously recorded, as well
as the diameter contraction by an LVDT.
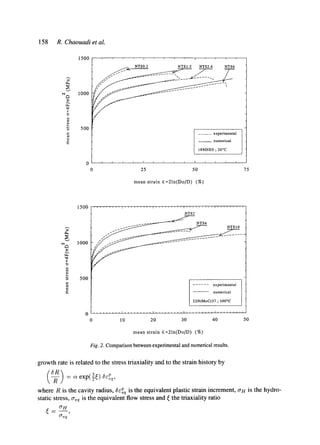
The specimens are identified by the notation NTSp for Notched Tensile Specimen followed
by the notch radius p. Typical mean strain-mean stress curves obtained from different notched
specimens are shown in Fig. 1. As can be seen, the sharpness of the notch drastically reduces
the ductility of the specimen because of the important role played by the hydrostatic component
of the stress tensor.
4. Finite element simulation
The stress-strain calculations are performed using the SYSTUS finite element code. Because
of the axial symmetry, only a quarter of the specimen is simulated using two dimension
isoparametric 8-node elements with reduced Gauss integration. The von Mises criterion for
plasticity is used with associated incremental flow rule.
The load application is simulated by a vertical displacement of the nodes situated at the
upper face. Because of the large strains and deformations, the updated Lagrangian procedure
is used. The BFGS algorithm is used to solve the constitutive equations.
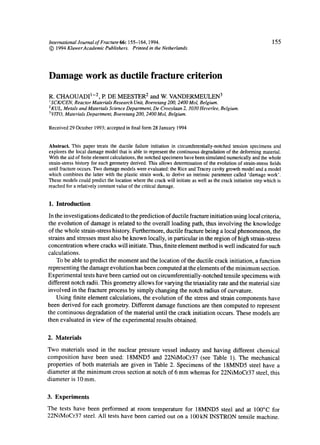
The comparison of experimental results with numerical calculations shows an overall good
agreement (Fig. 2).
The stress triaxiality ratio (O'H/O'eq),where O"n and Cr~qare respectively the hydrostatic
and equivalent stresses, at the centre of specimen calculated from the Bridgman [1] formula
is underestimated with regard to finite element calculations. However, the correlation is very
good in the early stage of loading, except the NTS 0.2 geometry (Table 3).
The triaxiality ratio is maximum at the centre of the specimen for all geometries, except
for NTS 0.2 where it is maximum in a region close to the notch (t0.5 mm from the notch).
Similarly, the crack initiates at the centre of each specimen except the NTS 0.2-specimen
where it cracks from the notch.](https://image.slidesharecdn.com/chaouadi1994-190825163016/85/Chaouadi1994-2-320.jpg)
![Damage work as ductile fracture criterion 157
II
r,
E
1500
1000
500
0
0 100
NTS0.2 NTS1.2 NTS2.4 NTS6 NTS12 NTS60
J ~ material: 18MND5
room temperature
NTSR Do=6mm
i i i I T i i i I r i i r t i r i I
25 50 75
mean strain E=21n(Do/D) (%)
Fig. 1. Strain-stress curves - influence of stress triaxiality.
Table 3. Stress triaxiality at the centre of specimen
NTS0.2 NTS1.2 NTS2.4 NTS6 NTS2 NTS4 NTS10
Bridgman 2.47 1.14 0.82 0.56 1.14 0.82 0.56
EE.M. (early stage) 1.35 1.07 0.81 0.54 1.08 0.80 0.54
EE.M. (mean) 1.28 1.39 1.12 0.86 1.37 1.07 0.80
5. Damage modelling
Physically, ductile damage is related to the nucleation, growth and coalescence of cavities. The
nucleation and coalescence phases are negligible compared to the growth phase, and therefore
are not taken into account in this model. Many authors [2-10] have shown the important role
played by the hydrostatic stress. Therefore, it is expected that this component will appear in the
damage function. In addition, because of the damage process which is a cumulative process,
the plastic strain increment will be the loading factor which represents the strain history.
5.1. CAVITY GROWTH MODEL
Rice and Tracey [11] have calculated the displacement field of a perfectly plastic material
containing a spherical cavity and subjected to remote stress and strain-rate fields. They derived
a relation between the cavity radius rate and the stress-strain field. The damage is then related
to the cavity radius, and crack initiation occurs for a critical radius of the cavity. This cavity](https://image.slidesharecdn.com/chaouadi1994-190825163016/85/Chaouadi1994-3-320.jpg)
![Damage work as ductilefracture criterion 159
a is a constant factor, and according to Rice and Tracey [11] for high triaxialities, a = 0.283.
However, this value has been corrected by Huang [12] who found a better approximation for
a = 0.427. Furthermore, Marini [13] has shown that a is actually proportional to the volume
fraction of second phase particles. Nevertheless, in this model, its value is not critical because
it appears as a proportional parameter that can be fitted experimentally.
Crack initiation occurs when R reaches its critical value Rc, which is an intrinsic property
of the material. This model has been successfully used by many authors [5, 6, 9, 10, 14].
5.2. DAMAGEWORKMODEL
Another way of characterizing the ductile damage is obtained from the expression giving the
plastic work per unit volume. Plastic strain work is given by
8WD = aij&r~j.
Using the deviatoric stress expressions, this equation can be written as
In plasticity problems, ~i = 0 to satisfy the incompressibility condition, and therefore, the
hydrostatic stress O'H does not contribute to plastic deformation. This is experimentally well
verified. However, locally, in particular for high plastic strains, this is no longer valid. Ductile
fracture is a cavitation process, and locally, the volume change should be taken into account
when evaluating the plastic strain work.
The volume change (~V/V) can be related to the cavity growth rate of Rice and Tracey by
~V 8R
V R
Therefore
(SR
~WD = Creq~CPeqq- 3(rH
R
Rearranging this equation leads to
~W~ = [1 + 3~¢ exp(3¢)] ~q~q.
As can be seen from this equation, there is a competition between plastic flow and cavity
growth. ~WD will be called 'damage work'. Fracture occurs when damage work reaches
a critical value noted WDC, characteristic of the material. The first term is related to the
dislocation creation process by plastic deformation whereas the second term is related to the
cavity creation process.
As before, the factor o~is an experimental fitting parameter. However, this factor could
be correlated to the microstructure of the material, in the sense that it will represent also the
distribution of the second phase particles in the material. So, any scattering in the data will be
reflected by a.
The damage model given here is very similar to the one proposed by Zhang et al. [15,
16]. However, the derivation is different although the conceptual idea of competition between
material flowing and cavitation is the same. Indeed, they combined the void multistage
nucleation model to the Gurson [17] potential for porous materials to derive what they called
the 'combinatory work density'.](https://image.slidesharecdn.com/chaouadi1994-190825163016/85/Chaouadi1994-5-320.jpg)
![160 R. Chaouadi et al.
Table4. Critical damage of the different specimens
eP~q(%) (R/Ro)c Wac(Jlmm3)
18MND5 --
NTS 1.2 21 1.63 1.61 (2.35)(*)
NTS2.4 37 1.74 1.67 (2.38)
NTS6 58 1.76 1.57 (2.13)
NTS0.2 64 1.80 1.61 (2.17)
22NiMoCr37
NTS2 18 1.47 1.28 (1.87)
NTS4 28 1.48 1.18 (1.67)
NTS10 50 1.59 1.30 (1.76)
* Values corresponding to ¢r --- 0.428.
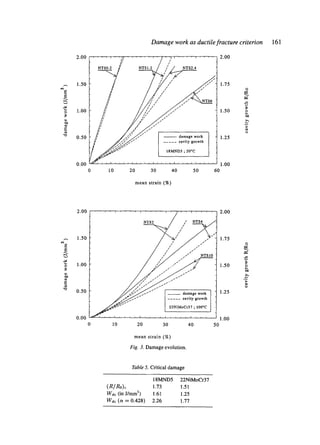
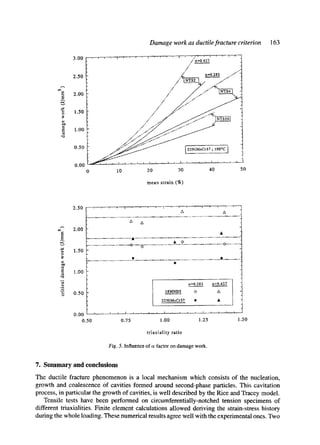
6. Results and discussion
These two damage models, i.e. Rice and Tracey cavity growth and damage work have been
calculated in the meshes of the minimum cross section of the different notched tensile spec-
imens (Fig. 3). Their evolution in the minimum section clearly shows the expected critical
region of crack initiation. Thus, the crack initates at the centre of all specimens but at the notch
for NTS 0.2-specimen, as predicted by both models. Furthermore, at crack initiation, their
critical value is relatively constant, independent from the notch sharpness. In both models, the
finite element calculations have been performed assuming avon Mises material. This means
that the damage and the constitutive relations are non-coupled, whereas in the case of the
Gurson model [17], they are coupled.
The tensile properties of both steels being very similar (see Table 2), one would expect
quite similar critical damage values. The reason could be assigned to the factor, a, proportional
to the second phase particles. So, the main inclusions present in such steels being MnS-type,
according to Franklin [18], their density can be evaluated from the chemical composition
using the relation
0.001]
fMnS(%) = 5.4 %S %MnJ '
where, %S and %Mn are the weight-% of sulphur and manganese, respectively, and fMnSis the
volume fraction of MnS-inclusions. This relation agrees well with experimental measurements
for ferritic steels [6]. Given both compositions of the steels under consideration, this relation
gives fMnS = 0.007% for 18MND5 and fMnS = 0.05% for 22NiMoCr37. Therefore, the
factor ~ for 22NiMoCr37 should be higher than for 18MND5. Another possible reason for
the difference of critical damage values between these steels is the specimen size effect, as
suggested by Marini [13]. The critical cavity growth ratio and the critical damage work for
each material and geometry have been deduced and are given in Table 4. These values have
been obtained by integrating the damage functions from zero to the mean strain corresponding
to crack initiation derived from the experimental tests.
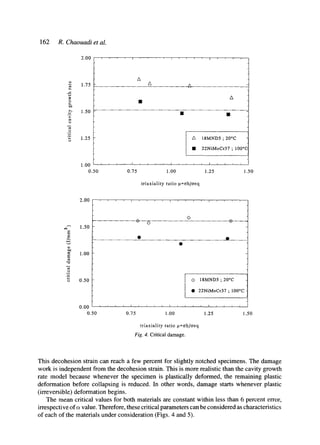
This table shows that (R/Ro)c increases with local plastic strain. Beremin [2, 3] showed
that this model should take into account the decohesion strain necessary to initiate a cavity.](https://image.slidesharecdn.com/chaouadi1994-190825163016/85/Chaouadi1994-6-320.jpg)