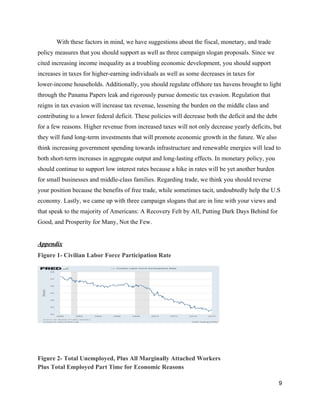
The document analyzes the current state of the US economy and argues that while GDP and unemployment rates show recovery, income inequality has increased. It summarizes that GDP and unemployment have improved significantly since the recession but wages have grown slowly, many workers are underemployed or dropped from the labor force, and gains have disproportionately benefited the wealthy while median income has declined.
The document discusses whether the US economy has truly recovered from the Great Recession. While GDP and corporate profits have increased since the recession, the author argues that the quality of life for most Americans, especially the bottom 99%, has not significantly improved or has deteriorated. Unemployment rates only consider those actively looking for work and do not account for discouraged workers, and labor participation is at a 38-year low. The author believes inequality has increased and many Americans remain unemployed or underemployed, indicating the economy has not fully recovered for most.
The document provides an economics report summarizing key events in July 2012. It discusses positive gains in stock markets in Australia and the US despite ongoing concerns around a double-dip recession, slowing growth in China, and debt issues in Europe. While the US economy shows continued slow growth, China's GDP growth slowed further. Later in the month, the ECB president signaled a strong commitment to preserve the Euro. Domestically, inflation in Australia remains low and another interest rate cut is unlikely in the near future. The report maintains its end-year forecast for the ASX200 index.
The document analyzes potential unemployment scenarios in the United States over the next decade. It first examines current unemployment data and trends, finding the unemployment rate at 10% with 17.3% underemployment. It then presents three scenarios: 1) unemployment peaking in late 2010 and returning to pre-recession levels by 2013, based on historical patterns; 2) unemployment declining more slowly due to factors like declining consumer credit, part-time work, and low labor participation; 3) unemployment remaining elevated for years due to challenges across many industries in creating sufficient new jobs.
This document summarizes key economic indicators in the United States from 2005 to 2015. It discusses components of GDP like consumption, investment, government spending and net exports. It also analyzes unemployment rates, inflation, oil prices and consumer confidence. The economy recovered from the Great Recession, with GDP and consumption increasing steadily in recent years. However, inflation remains low and unemployment higher than pre-recession levels, suggesting more room for improvement. Falling oil prices could boost growth but also pose deflation risks if price declines continue.
Our major goal is to help you achieve your academic goals. We are commited to helping you get top grades in your academic papers.We desire to help you come up with great essays that meet your lecturer's expectations.Contact us now at http://www.premiumessays.net/
The document provides an overview of recent economic and financial market developments globally. Key points include:
- The euro area and Japan ("QE markets") saw strong returns while other markets were more subdued. Strong US jobs data increased rate hike concerns.
- The ECB increased its euro area growth forecast and expects its inflation target to not be reached until 2017, keeping monetary policy easy. Greek debt issues remain unresolved.
- US jobs growth was very strong in February, raising debate around the timing of interest rate increases. ISM surveys signal continued growth.
- The Bank of England increased its UK growth forecast but expects low inflation until 2017 due to lower energy prices. It forecasts a first rate hike in
As expected, the Federal Open Market Committee has embarked on another round of planned asset purchases. In its November 3 policy statement, the FOMC wrote that it expects to buy another $600 billion in long-term Treasuries by the end of 2Q11 ($75 billion per month), in addition to the $35 billion per month in reinvested principal payments from its portfolio of mortgage-backed securities. There has been much criticism of the move in the financial press. Certainly, there are risks in the Fed’s strategy. However, it’s hardly reckless or ill-advised.
The document discusses several challenges facing the US economy that contradict the view that it can decouple from global economic trends. It argues that the Federal Reserve's quantitative easing policies had less impact on interest rates than commonly believed, and that interest rates were destined to fall due to a global capital glut. It also argues that the US employment situation indicates long-term problems like declining labor force participation and increasing low-wage jobs. Additionally, it states that household debt remains high and deflation is a global issue impacting the US through factors like a strong dollar.
The document outlines three possible economic scenarios for 2014: a recession, dull growth under 2.5%, or stronger recovery over 3%. It analyzes factors that will influence the path of the economy such as employment, consumer spending, business confidence, and the tapering of monetary policy by the Federal Reserve. Overall it presents an optimistic outlook, finding signs of an improving job market, rebounding housing sector, and expanding manufacturing and service industry activity to support continued economic expansion.
1) The document analyzes the 2016-2017 budget summaries from the State of California. It finds that while the state is claiming to have balanced its budget, this is likely temporary due to reliance on volatile income tax revenues.
2) A major reason for the balanced budget was paying down debt, including $1.3 billion in pension obligations. However, overall spending increased by 6% and education/housing spending are slated to rise further.
3) The governor acknowledges the budget will be difficult to balance long-term given past patterns of short surplus periods followed by large deficits. The document concludes another recession will likely cause a major debt crisis for California in the next decade.
http://pwc.to/1cpYR81
En octobre, les décideurs de partout dans le monde se sont réunis à Washington DC pour faire le bilan des perspectives économiques mondiales. Pour la première fois depuis 2010, le pronostic d’une reprise soutenue pour les économies développées devrait être positif.
ABOUT THIS PUBLICATION
This Overview is based on ESADE’s Economic Report, January 2014, produced by the Department of Economics. This article was written by Prof. Josep M. Comajuncosa. The original document was produced with the support of Banc de
Sabadell.
This document discusses how governments can overcome inflation through monetary and fiscal policies. It explains that monetary policy uses interest rates and open market operations to control the money supply. Through open market operations, the central bank sells securities to lower bank reserves and restrict lending. Reserve requirements can also tighten the money supply by requiring banks to hold more reserves. Fiscal policy involves increasing taxes or reducing government spending to decrease spending in the economy. These contractionary policies aim to slow economic growth and reduce inflation.
« Market Perspectives » est notre revue mensuelle des marchés. Elle présente de la façon la plus synthétique possible :
- notre analyse des principaux faits marquants et indicateurs macro susceptibles de dessiner les marchés sur le mois.
- notre vision sur les différentes classes d’actifs
Cette revue sera continument enrichie avec nos indicateurs quantitatifs.
La plupart de nos analyses sont disponibles sur www.finlightresearch.com
Our monthly publication “Market Perspectives” presents a synthetic view of all the asset classes we cover.
The report is composed of six sections covering Macro, Equities, FI & credit, FX, Commodities and Alternatives.
Each section is preceded by a summary of our views on the related asset class.
Most of our publications are available on our web site www.finlightresearch.com
The document discusses key economic goals of governments which include full employment, steady annual growth in output without overheating, and stable prices with low inflation. It then provides guidance on writing about key economic indicators such as GDP, CPI, unemployment rates. It notes important details to focus on for each indicator and potential issues to be aware of.
If U.S. politics do not derail the recovery, pent-up demand can drive faster economic growth. Fixed-income outflows appear likely to continue, pushing rates higher.
The document provides an analysis of recent U.S. economic indicators and recommendations for Precision Castparts. It finds that key indicators point to slow growth in 2016 but prepare for a possible contraction in 2017. The ISM manufacturing index improved but remains neutral, and the Fed is expected to raise rates in June to curb inflation. Declines in consumer confidence and new home sales may lead to a self-fulfilling recession. It recommends Precision Castparts hedge risks through workforce training, process improvements, and inventory and expense management to gain an advantage in a potential late-cycle contraction.
This document provides an overview of government economic policy tools used by central banks and finance ministries. It discusses fiscal policy tools like taxation and government spending and how they can be used to stimulate or contract the economy. It also explains monetary policy tools controlled by central banks, including interest rates, required reserve ratios, and open market operations to influence money supply and achieve goals of steady growth and low inflation. Specific policy examples from the US, UK, Japan, and Europe are also mentioned.
The document discusses Japan entering a recession with declining GDP growth and calls from opposition party leader Shinzo Abe for "unlimited monetary policy easing" and "endless money printing" if elected. It notes many companies have been hurt by Japan's strong currency, the yen, and that increased monetary policy would weaken the currency. It also discusses Japan's decades of deflation and calls to increase the Bank of Japan's inflation target. The challenges of generating economic growth solely through monetary policy are highlighted based on Japan's experience over past decades.
1) The global investment landscape may realign in 2016 as major central banks change course, with the US expected to raise rates, Japan potentially tapering QE, and China's reforms promoting growth.
2) China has successfully rebalanced its economy away from heavy industry and towards services, accounting for half of GDP, but headlines still focus on declines in manufacturing.
3) Infrastructure investment in China has stabilized and signs point to a potential cyclical upswing in housing, which could drive broader economic growth and commodity demand in the coming year.
The stock market has rallied recently even as the economy remains weak, similar to walking up a downward-moving escalator. Some signs suggest parts of the economy may be stabilizing, like improvements in manufacturing and services sectors. While employment and GDP numbers remain poor, consumer spending increased in the first quarter. Inventories fell sharply but this may help future growth. Other positive signs include rising consumer confidence and stabilizing housing. Many companies exceeded low earnings estimates, and rapid responses from corporations, consumers, and governments may help lead to eventual recovery.
This document provides a 3-paragraph summary of the U.S. economic outlook by Mike Lathigee, Chairman and CEO of Alliance Investment Solutions:
1) Government stimulus money is fading and budget cuts at the federal and state/local levels could further hamper economic growth. Consumer spending rose less than expected and state/local budget cuts reduced spending. Additionally, rising oil prices and inflation pose risks to the recovery.
2) Economic growth needs to be stronger to significantly reduce the 9% unemployment rate, yet budget cuts could constrain growth. A showdown in Congress over the budget threatens a government shutdown, adding uncertainty.
3) Inflation rose 1.6% overall and 0.2%
Do you or your users need information on the South's unemployment, housing and more? We’ll share strategies to enhance expertise with finding essential resources about these timely topics. (Sponsored by GLA GIIG.) Presented at GaCOMO12 by Patricia Kenly and Bette Finn.
The document discusses the challenges governments face in withdrawing fiscal and monetary stimulus programs as economic recovery takes hold. It notes that withdrawing support too soon could undermine the recovery, but waiting too long risks unsustainable debt levels and inflation. Most developed nations will likely pursue a gradual tightening over the next year or two. Asia is already beginning to tighten policies as some countries see strong growth return. Overall recovery in 2010 may slow as liquidity declines, but the foundations for rising asset prices remain in place, leaving the author cautiously optimistic.
The Labor department reported initial jobless claims increased by 31,000 to 113,000 in the week ending Feb. 21, 2015. The four-week moving average was 294,500. The January employment report stated nonfarm payrolls rose by 257,000 and the U.S. unemployment rate increased to 5.7% on higher participation in the labor force, staying below the 50-year average of 6.1%.
This document provides information about purchasing a CCI DUP-850-2 duplexer from Launch 3 Telecom. It describes payment and shipping options, same-day shipping availability, warranty and return policies, and additional services offered like repairs, de-installation, and asset recovery. Launch 3 Telecom is an experienced telecom supplier that can meet all telecom equipment needs.
Sanjeev Mandhani has over 11 years of experience in manufacturing and supply chain management. He has expertise in warehouse management, inventory control, logistics, and production planning and control. Most recently, he worked as Assistant Manager - Supply Chain for Pernod Ricard India, where he managed supply chain operations across Bihar, Jharkhand, and Odisha, including overseeing warehouses, transportation, and introducing local production units. He has a strong track record of cost savings initiatives and achieving business targets through efficient supply chain operations.
HAMARATA Integrated Services is an oil and gas services company established in 2014 that specializes in controls/instrumentation, general maintenance, and supply of downhole production tools. It has operational bases in Eket, Bonny, and Port Harcourt with a vision to be the best in its sector through providing world-class services. The company has 28 employees including 4 professional managers and focuses on quality, health, safety, security, and environmental standards in its service delivery.
Patricia Wright is seeking a remote position involving auditing, consulting, and education in the fields of compliance and correct coding practices. She has over 20 years of experience in healthcare, specializing in coding, auditing, and educating staff. Her current role involves reviewing records to ensure coding accuracy and providing education on documentation.
The document discusses a project thesis submitted by two students, Jariwala Jenil and Joshi Riddhi, to the Department of Biotechnology at V.V.P. Engineering College in fulfillment of the requirements for a Bachelor of Engineering degree. The thesis examines the biodegradation of an oil contaminated site through isolation of microorganisms from contaminated soil and analyzing their ability to degrade various types of oil through growth measurements and degradation calculations. The students conducted the work under the supervision of Dr. Krishna Joshi to fulfill their degree requirements.
La Biblioteca Pública El Tintal Manuel Zapata Olivella cumple 15 años desde su apertura al público el 29 de junio de 2001. Fue construida sobre las bases de una antigua planta de transferencia de basuras y rinde homenaje al escritor afrocolombiano Manuel Zapata Olivella. La biblioteca ofrece programas y servicios como actualización y capacitación en informática para adultos mayores, actividades recreativas para niños, talleres educativos para jóvenes, y eventos como cine, conferencias y actividades de integra
El documento trata sobre los signos lingüísticos. Explica que un signo es un objeto que representa algo distinto a sí mismo y que las palabras son signos que usamos para comunicarnos. Distingue entre signos primarios cuyo propósito es comunicar y signos secundarios que se producen intencionalmente con ese fin. Además, describe que Saussure concibió el signo lingüístico como la asociación de un significante (imagen acústica) y un significado (imagen mental). Finalmente, señala que el signo lingüístico
Competences for democratic culture - Living together as equals in culturally ...Council of Europe (CoE)
Contemporary societies within Europe face many challenges, including declining levels of voter turnout in elections, increased distrust of politicians, high levels of hate crime, intolerance and prejudice towards minority ethnic and religious groups, and increasing levels of support for violent extremism. These challenges threaten the legitimacy of democratic institutions and peaceful co-existence within Europe.
Formal education is a vital tool that can be used to tackle these challenges. Appropriate educational input and practices can boost democratic engagement, reduce intolerance and prejudice, and decrease support for violent extremism. However, to achieve these goals, educationists need a clear understanding of the democratic competences that should be targeted by the curriculum.
The Council of Europe has produced a new conceptual model of the competences which citizens require to participate in democratic culture and live peacefully together with others in culturally diverse societies.
This brochure contains the executive summary of Competences for Democratic Culture for quick and easy reference. The full text is available in Council of Europe publication ISBN 978-92-871-8237-1.
La secuencia didáctica tiene como meta lograr que el alumno analice y busque diferentes formas para su mejor comprensión. Comienza con preguntas para evaluar los conocimientos previos de los estudiantes y mostrar un video. Luego, los estudiantes trabajarán en equipos identificando planetas de un modelo del sistema solar y respondiendo preguntas sobre el video para evaluar su comprensión.
El documento describe la arquitectura y el arte paleocristiano, incluyendo las basílicas, catacumbas, mausoleos y símbolos cristianos primitivos como El Buen Pastor. Se analizan ejemplos arquitectónicos como la Basílica de Santa Sabina y San Juan de Letrán en Roma, así como sarcófagos paleocristianos con escenas bíblicas.
Análisis de la progresiva recuperación de los mercados internacionales de la perspectiva del empleo, la económica y el nivel de productividad de las empresas.
- Real average wage growth globally has remained far below pre-crisis levels and turned negative in developed economies, although it remained significant in emerging economies.
- There are major geographic differences in wage growth trends, with wages suffering double-dips in developed economies but remaining positive in Latin America and Asia.
- A smaller share of national income is going to workers as falling labour shares have resulted in a gap between increasing productivity and stagnant wages, hurting household consumption and demand.
The document discusses increasing unemployment rates and reasons for unemployment. It notes private sector employment has been negative for 10 years, with 8 million jobs lost during the recession. Unemployment duration and rates are at record highs. Reducing unemployment will require stimulating all three engines of the economy - consumers, businesses, and government - as each are currently struggling. The document proposes a non-profit jobs program as a potential "fourth engine" to reduce unemployment.
This document discusses the relationship between economic growth and unemployment rates. It finds that a persistently high unemployment rate remains a concern for Congress. While the unemployment rate has declined since peaking in 2009 and 2010, it remains elevated by historical standards. The key driver of unemployment over the long run is the rate of economic growth compared to potential growth. For unemployment to significantly decline, growth needs to outpace the combined growth of the labor force and productivity. Recent recoveries, including from the 2007-2009 recession, have seen slow declines in unemployment, described as "jobless recoveries."
15Introduction The economy of the United State.docxhallettfaustina
1
5
Introduction
The economy of the United States is the world’s largest national economy in nominal terms and the second in terms of purchasing power parity globally. The economy’s currency the US dollar is used to settle most international transactions. The US economy is a mixed one. Its major trading partners are United Kingdom, Canada, Mexico, South Korea and Japan.
The United States’ economy is one of the high industrialized and diversified economies in the world. Its major industries include; energy, transport, healthcare, and agriculture. It is a leading exporter of innovation goods, arms, petroleum products, and electronics.
The Unites states is a consumption economy where most of the goods and services are consumed locally rather than for export promotion. Although the US is one world’s largest exporters of technology goods it imports heavily from Asian economies like China. Its main export markets are the European Union, Canada, China, and Mexico.
The US economy is still recovering from the 2008 global financial crisis. It is also grappling with plummeting oil prices and is greatly concerned about China growing exports into the economy (Potomac, 2010). Lastly, the economy is in a transition because of regime change.
Production output performance analysis
Real GDP
The real GDP is an inflation-adjusted macroeconomic measure of the value of all goods and services that are produced in an economy in a given year. In simple terms, it measures everything that a country produces in a particular year. It is usually expressed in constant prices which enable it to capture economic growth more accurately as compared to the nominal GDP (Feldstein, 1988). From the graph, we can deduce that the GDP of the US was initially rising from the year 2006 up to the year 2008. During this phase the economy was experiencing a boom and was healthy, employment rates were high and consumption was high. However, the economy slides into a recession in the year 2008. During this period the 2008 global financial crises happened. This led to a decline in US GDP, where it hit its lowest point in the last decade. This scenario persisted up to the year 2010. From 2010 the US economy is seen to be in a recovery where the GDP is increasing significantly over the years.
Real GDP Growth Rate
The real GDP growth rate is a measure of economic expansion in relation to real GDP from one financial year to another. It measures how fast the country’s economy is growing. It is largely driven by net exports, personal consumption, and government expenditure and business investment (Feldstein, 1988). From the graphical representation of the real GDP growth rate of US, we are starting with a positive figure which indicates that the economy is expanding healthy. If the economy is growing then by implication so is employment, personal incomes, and business. During the 2008-2009 global financial the economy went into recession and it can be seen that the real GDP growth ra ...
This white paper proposes tax reforms to promote economic growth and equity in the United States. It summarizes that the current US economic situation features high unemployment, stagnating incomes, and extreme inequality. The author argues corporate and personal income tax reforms could help address these issues by raising revenues to invest in the economy while reducing inequality. The paper outlines principles for tax reform and specific proposals, including increasing taxes on corporations and high incomes, closing loopholes, reforming estate taxes, and implementing environmental taxes. The goal is for taxation reforms to strengthen the economy, improve distribution, and encourage socially beneficial behavior.
The document discusses the Great Recession that occurred from late-2007 to mid-2009. It led to major job losses and declines in income and education levels. Despite government efforts, the labor market was hit hardest and unemployment was the worst in three decades. The recession was caused by factors like unemployment, declining incomes, lack of education, and inflation. Employers had to let go of less skilled workers due to rising costs.
This document summarizes a report analyzing increases in poverty in New Jersey from 2009 to 2013, during the economic recovery. It finds that while unemployment decreased, poverty actually increased, especially childhood poverty. This is unusual compared to previous recoveries. The report estimates the relationship between unemployment and poverty, and finds that given decreases in unemployment, poverty should have decreased, but did not. It argues that cuts to New Jersey's Earned Income Tax Credit and decreases in the minimum wage's value likely explain why poverty increased despite job growth. Counties with larger losses of EITC benefits saw greater increases in poverty than predicted based on unemployment changes alone.
This document provides an executive summary and analysis of the anticipated performance of the U.S. construction industry in 2015. It finds that while the construction industry rebounded in 2014, growth outpaced GDP and private sector growth continues, public sector construction is also showing signs of improvement. The U.S. economy is growing steadily but corporate profits are high while wages are still low. Inflation remains below targets due to falling energy prices, and the Federal Reserve is expected to raise interest rates in 2015 to address inflation, which will impact some industries. Overall, 2015 is forecast to be a strong growth year for construction.
2015 State of the Construction Industry Lisa Dehner
This document provides an executive summary and analysis of the anticipated performance of the U.S. construction industry in 2015. It finds that while the construction industry rebounded in 2014, growth outpaced GDP and private sector growth continues, public sector construction is also showing signs of improvement. The U.S. economy is growing steadily but corporate profits are high while wages are still low. Inflation remains below targets due to falling energy prices, and the Federal Reserve is expected to raise interest rates in 2015 to address inflation, which will impact some industries. Overall, 2015 is forecast to be a strong growth year for construction.
This document summarizes John Williams' speech about the current economic conditions and outlook for monetary policy. Some key points:
1) The economy has strengthened, with GDP and job growth picking up. However, unemployment remains above typical estimates of its natural rate and inflation below the Fed's 2% target.
2) The Fed has begun tapering its asset purchase program but monetary policy remains highly accommodative. Interest rates will stay near zero until unemployment falls further.
3) The Fed has tools like interest on reserves and reverse repos to manage the large balance sheet and control interest rates during normalization of policy. Any rate increases will be gradual and clearly communicated.
Rakip Bebo provides a macroeconomic forecast for the US economy in 2015. Based on analysis from multiple sources, Bebo predicts that GDP growth will be 3% in Q3 and 2.8% in Q4 of 2015. Unemployment is expected to drop to 5.3% in both quarters. While the economy is improving, productivity and labor force participation remain sluggish. Underemployment, especially among young college graduates, also poses a problem. Wage growth has been slow to recover despite falling unemployment, restraining consumer spending and full economic capacity.
Degroof Petercam Asset Management's chief economist and asset allocator look into whether the reflation trade is for real and inflation is back in the cards.
Surname 1
Surname 13
Students Name
Institutional Affiliation
Date
Fixing Youth Unemployment
The Bureau Labor of Statistics (BLS) produces a monthly report concerning unemployment, and it indicates the state and strength of the economy. In October this year, the unemployment rate increased to 3.6% from 3.5% in the previous month (Tradingeconomics.com para 1). America has one of the most prolonged economic recoveries in its history, and despite the continual effort by the government to create jobs, full employment levels have not been reached. Unemployment has adverse consequences on the overall economy, and there is a loss of significant consumer spending. When unemployment levels rise, it can be financially destructive to an economy. Over two million youths are unemployed, and most have given up having permanent employment (Bls.gov para 8-9). Failure to have a stable job in early adulthood can have a significant impact on the lives of individuals. Young people complete college, begin searching for employment, and if they cannot find, they ultimately give up on being employed. Constant rejection and the state of the economy contributes to many unemployed youths in a country. It is, therefore, important for an economy to analyze the root causes of unemployment and fix the problem.
Understanding Youth Unemployment and its Causes
Unemployed people are those who do not have a job, have actively searched for work in the past four weeks, and are currently available for employment (Amadeo, para 1). BLS uses household surveys known as current population surveys to measure unemployment. It is a practice that has been conducted since 1940 when the government was responding to the Great Depression. The survey results help to understand the unemployment rates for different people in society like youths and adults. The unemployment rate among youths refers to the number of unemployed youths between the ages of 15-24 years when it is expressed as a percentage of the youth labor force. Figure 1 shows the fluctuating rates of unemployment from October 2018 to October 2019. In the US from April to June 2019, the unemployment rate rose by 615,000, and this increase was similar to the rise for the same period in 2018 (Bls.gov para 9). In July 2019, the number of unemployed youths was 2.1 million. Thus the government needs to identify causes and solutions to create employment opportunities such that all the youths contribute to the growth of the economy.
Figure 1: Monthly Youth (16-24) unemployment rate in the US from October 2018 to October 2019.
Source: Bureau Labor of Statistics
The graph shows the unemployment rates every month for youths across the US. It shows seasonally adjusted rates, which is a statistical approach to remove the seasonal component of a time series integrated with the analysis of non-seasonal tren ...
Global Economic Update & Strategic Investment Outlook Q2 2014Cohen and Company
An informative overview of the current state of the global economy and the many factors that impact investment strategies, and a look at domestic economic indicators that may impact them.
This document summarizes New Zealand's business cycles since the global financial crisis of 2008-2009. It discusses 4 main business cycles: 1) the global financial crisis, 2) a green shoot recovery from 2009-2010, 3) a period of domestic caution and global uncertainty from 2012-2012, and 4) a time of persistently low inflation from 2014 to present day. During each cycle, the document outlines changes in economic indicators like GDP, inflation, interest rates, and immigration. It also describes the monetary and fiscal policy responses used in New Zealand to address challenges in each economic period.
This document summarizes research analyzing the determinants of unemployment rate recoveries in Latin America following recessions from 1990 to 2010. It finds that while GDP growth is linked to falling unemployment per Okun's Law, GDP alone does not fully explain differences between countries. Four additional variables are examined: size of government, share of agriculture/rural population, employment rigidity/firing costs, and exchange rate/openness levels. The research uses panel data from 12 Latin American countries to analyze how unemployment is affected by GDP and these four factors both collectively for Latin America and individually for each country.
Numerous indicators indicate that no double-dip recession is to be feared. An analysis of US tax receipts correlation with stock markets is of particular interest.
PAD 510 WEEK 10 ASSIGNMENT 4 POWER POINTUsing Assignments 1, 2, .docxmosyrettcc
PAD 510 WEEK 10 ASSIGNMENT 4 POWER POINT
Using Assignments 1, 2, and 3, create a 6–8-slide PowerPoint presentation in which you:
Provide a historical perspective of the policy from Assignment 1.
Describe the official and unofficial actors of the policy from Assignment 2.
Present both of the positions of the policy from Assignment 3.
Persuade the audience that the position you have chosen is worthy of the policy being implemented.
Include at least four peer-reviewed references (no more than five years old) from material outside the textbook. Note: Appropriate peer-reviewed references include scholarly articles and governmental websites. Wikipedia, other wikis, and any other websites ending in anything other than “.gov” do not qualify as peer-reviewed. Use Basic Search: Strayer University Online Library to identify references.
Your assignment must include:
Title slide with the name of the policy, your name, and date.
Reference slide with at least four peer-reviewed references, formatted according to the Strayer Writing Standards.
6–8 slides (the title slide and reference slide are not included in this number).
Icampus.strater.edu
Login: LC9468652853
Password: [email protected]
If Need Be!
Running Head: BUSH TAX CUTS 1
BUSH TAX CUTS 6
Bush Tax Cuts
Delores Blango
Strayer University
Dr. Timothy Smith
PAD 510
May 29, 2020
Bush Tax Cuts
Position in favor of the Policy:
The 2001 and 2003 tax cuts policy was meant to reduce marginal income tax rates and capital gains and dividends. All taxpayers got a reduction in their tax rates depending on their income thresholds. Additionally, the estate tax was completely phased out until 2010. These changes provided significant benefits to the middle class, who got their tax rates reduced by a margin of 3 to 5 percent. This fact means that people in the middle class got to keep a larger share of their salaries and improve their livelihoods. Additionally, all American citizens benefit from a child credit tax rising from $500 to $1000 per child. This change made it easier for low-income families to support their children adequately by providing for their basic needs. Further, there was a marriage penalty relief provision that resulted in the doubling of the basic standard deduction for couples that jointly owned property.
The stated changes lessened the financial burden placed on American citizens. Before the policy, low-income households had to pay a 15 percent tax rate to the government. This condition left a majority of low-income families struggling to meet their financial needs. The Bush tax cuts lowered their tax returns to 10 percent, allowing these families to comfortably budget their overall income (Hungerford, 2010). Additionally, the child credit tax made it easier for parents to meet the basic needs of their children. In the American commun.
PAD 510 WEEK 10 ASSIGNMENT 4 POWER POINTUsing Assignments 1, 2, .docxsmile790243
PAD 510 WEEK 10 ASSIGNMENT 4 POWER POINT
Using Assignments 1, 2, and 3, create a 6–8-slide PowerPoint presentation in which you:
Provide a historical perspective of the policy from Assignment 1.
Describe the official and unofficial actors of the policy from Assignment 2.
Present both of the positions of the policy from Assignment 3.
Persuade the audience that the position you have chosen is worthy of the policy being implemented.
Include at least four peer-reviewed references (no more than five years old) from material outside the textbook. Note: Appropriate peer-reviewed references include scholarly articles and governmental websites. Wikipedia, other wikis, and any other websites ending in anything other than “.gov” do not qualify as peer-reviewed. Use Basic Search: Strayer University Online Library to identify references.
Your assignment must include:
Title slide with the name of the policy, your name, and date.
Reference slide with at least four peer-reviewed references, formatted according to the Strayer Writing Standards.
6–8 slides (the title slide and reference slide are not included in this number).
Icampus.strater.edu
Login: LC9468652853
Password: [email protected]
If Need Be!
Running Head: BUSH TAX CUTS 1
BUSH TAX CUTS 6
Bush Tax Cuts
Delores Blango
Strayer University
Dr. Timothy Smith
PAD 510
May 29, 2020
Bush Tax Cuts
Position in favor of the Policy:
The 2001 and 2003 tax cuts policy was meant to reduce marginal income tax rates and capital gains and dividends. All taxpayers got a reduction in their tax rates depending on their income thresholds. Additionally, the estate tax was completely phased out until 2010. These changes provided significant benefits to the middle class, who got their tax rates reduced by a margin of 3 to 5 percent. This fact means that people in the middle class got to keep a larger share of their salaries and improve their livelihoods. Additionally, all American citizens benefit from a child credit tax rising from $500 to $1000 per child. This change made it easier for low-income families to support their children adequately by providing for their basic needs. Further, there was a marriage penalty relief provision that resulted in the doubling of the basic standard deduction for couples that jointly owned property.
The stated changes lessened the financial burden placed on American citizens. Before the policy, low-income households had to pay a 15 percent tax rate to the government. This condition left a majority of low-income families struggling to meet their financial needs. The Bush tax cuts lowered their tax returns to 10 percent, allowing these families to comfortably budget their overall income (Hungerford, 2010). Additionally, the child credit tax made it easier for parents to meet the basic needs of their children. In the American commun.
Similar to CopyofProject3FinalAnalysisofUSEconomy (20)
2. Six and a half years since the Great Recession, the U.S economy appears to be
prosperous once again. After six consecutive quarters of decline from the third quarter of 2008 to
the fourth quarter of 2009, real GDP has increased in every quarter since then and, as of March
2016, is at a high of $16.4 trillion (BEA). Additionally, the unemployment rate has fallen below
5.0% for the first time since November 2007. This is encouraging because the natural rate of
long term unemployment is 4.9%, suggesting that the economy is now at full potential output. It
is also a far cry from the 10.0% unemployment in October 2009 (BLS). Furthermore, inflation has
been consistently low. After reaching an average of 3.0% in 2011, the percentage change in
prices has been slowly growing at a rate of 1.2% for the past four years (BLS). According to the
Federal Reserve, consistent inflation leads to a) the public making accurate, long term economic
decisions and b) avoiding deflation, which is “a phenomenon associated with very weak
economic conditions.” Lastly, the stock market has surged: the Dow Jones Industrial Average
increased nearly threefold from March 2009 to July 2015 while other markets have also seen
similar gains (BEA). In short, all these figures suggest that the economy has made a complete
recovery.
The National Bureau of Economic Research (NBER) concluded that the recession ended
in June 2009. Based on the information above, we agree with their conclusion. However, because
the NBER’s conclusion depends substantially on GDP growth, it overlooks problems that still
persist for many households. We know that the unemployment rate, often cited as the holy grail
of economic recovery, has improved vastly. However, this figure is misleading for a few reasons.
Since the recession, many workers have given up trying to find a job. The civilian labor force
participation rate in December of 2008 was 66.0% (BLS). As of March 2016, this figure measured
63.0% (see Figure 1). Additionally, if one accounts for workers employed parttime for
economic reasons in addition to the unemployed, the recovery does not appear as convincing.
Data from December 2007 show the unemployed and underemployed population at 7.8% (BLS).
Almost nine years later, this number remains stubbornly high at 10.5% suggesting that there are
still many households who have not felt the recovery (see Figure 2). For many who have taken
part in the recovery and regained their fulltime jobs, they have returned to find that real income
and wages are growing at an abnormally slow pace. In 2007, wages increased at an annualized
rate of 4.0%; since then, the rate has slowed from 3.0% in 2008 to a near halt at 1.5% in 2012
and only barely picked up to 2.1% 2015 (BLS). The first months of 2016 show promise, with
wage growth increasing to 2.3%, but this is still far from prerecession levels.
1
3. Economic theory suggests that as the economy approaches the natural rate of
unemployment, employers must increase wages to attract the scarcer supply of workers.
However, this does not seem to be happening. It could be in part because there are more
parttime workers in the economy, who may ask for more hours before they ask for a raise.
Adding to this mess, state and local governments have cut the number of public sector workers.
Since the recession, even accounting for public sector hiring, there are 375,000 fewer public
sector employees. While we agree with the NBER’s conclusion that the Great Recession ended
in June 2009, many fulltime, highpaying positions have been eliminated and have been
replaced by parttime jobs. For those who remain fulltime, wages are growing much slower than
in the past. So, while the economy has recovered, it has also fundamentally changed, leaving
millions of Americans worse off than they were in 2007.
The result of this changing economy is that wealth inequality has increased, skewing
most of the economic gains to the wealthy. Since the end of 2008, corporate profits after tax have
nearly tripled from $671 billion in 2009 to $1.8 trillion in 2015, mirroring the gains made in the
stock market (see Figure 3). At the same time, real median household income in the U.S
decreased from $55,313 in 2008 to $53,657 in 2014 (the most recent figures available see
Figure 4). A truly healthy recovery is one in which a majority of the population sees gains, and
this is clearly not the case. Compare the unemployment figures for minority populations to that
of Whites and it is even more clear that the gains from the recovery have not been equal. While
unemployment rates for Whites have almost returned to prerecession levels, those of Black and
Hispanic populations remain nearly two percentage points higher (see Figure 5). It appears that
the dramatic increase in wealth inequality since the recession has impacted minority groups even
more.
To understand why income inequality has increased in the U.S, we must analyze the
monetary and fiscal policy decisions enacted during the recession. Additionally, we will analyze
the impact of these decisions on the national deficit and debt as well as current trade policies.
Specifically, we are interested in how effective these decisions were in ending the recession and
whether or not they contributed to the increased wealth inequality we see today.
Monetary Policy
The Federal Reserve combated the financial crisis by implementing a series of
expansionary monetary policies. According to the Fed, the goal of these reforms was to support
2