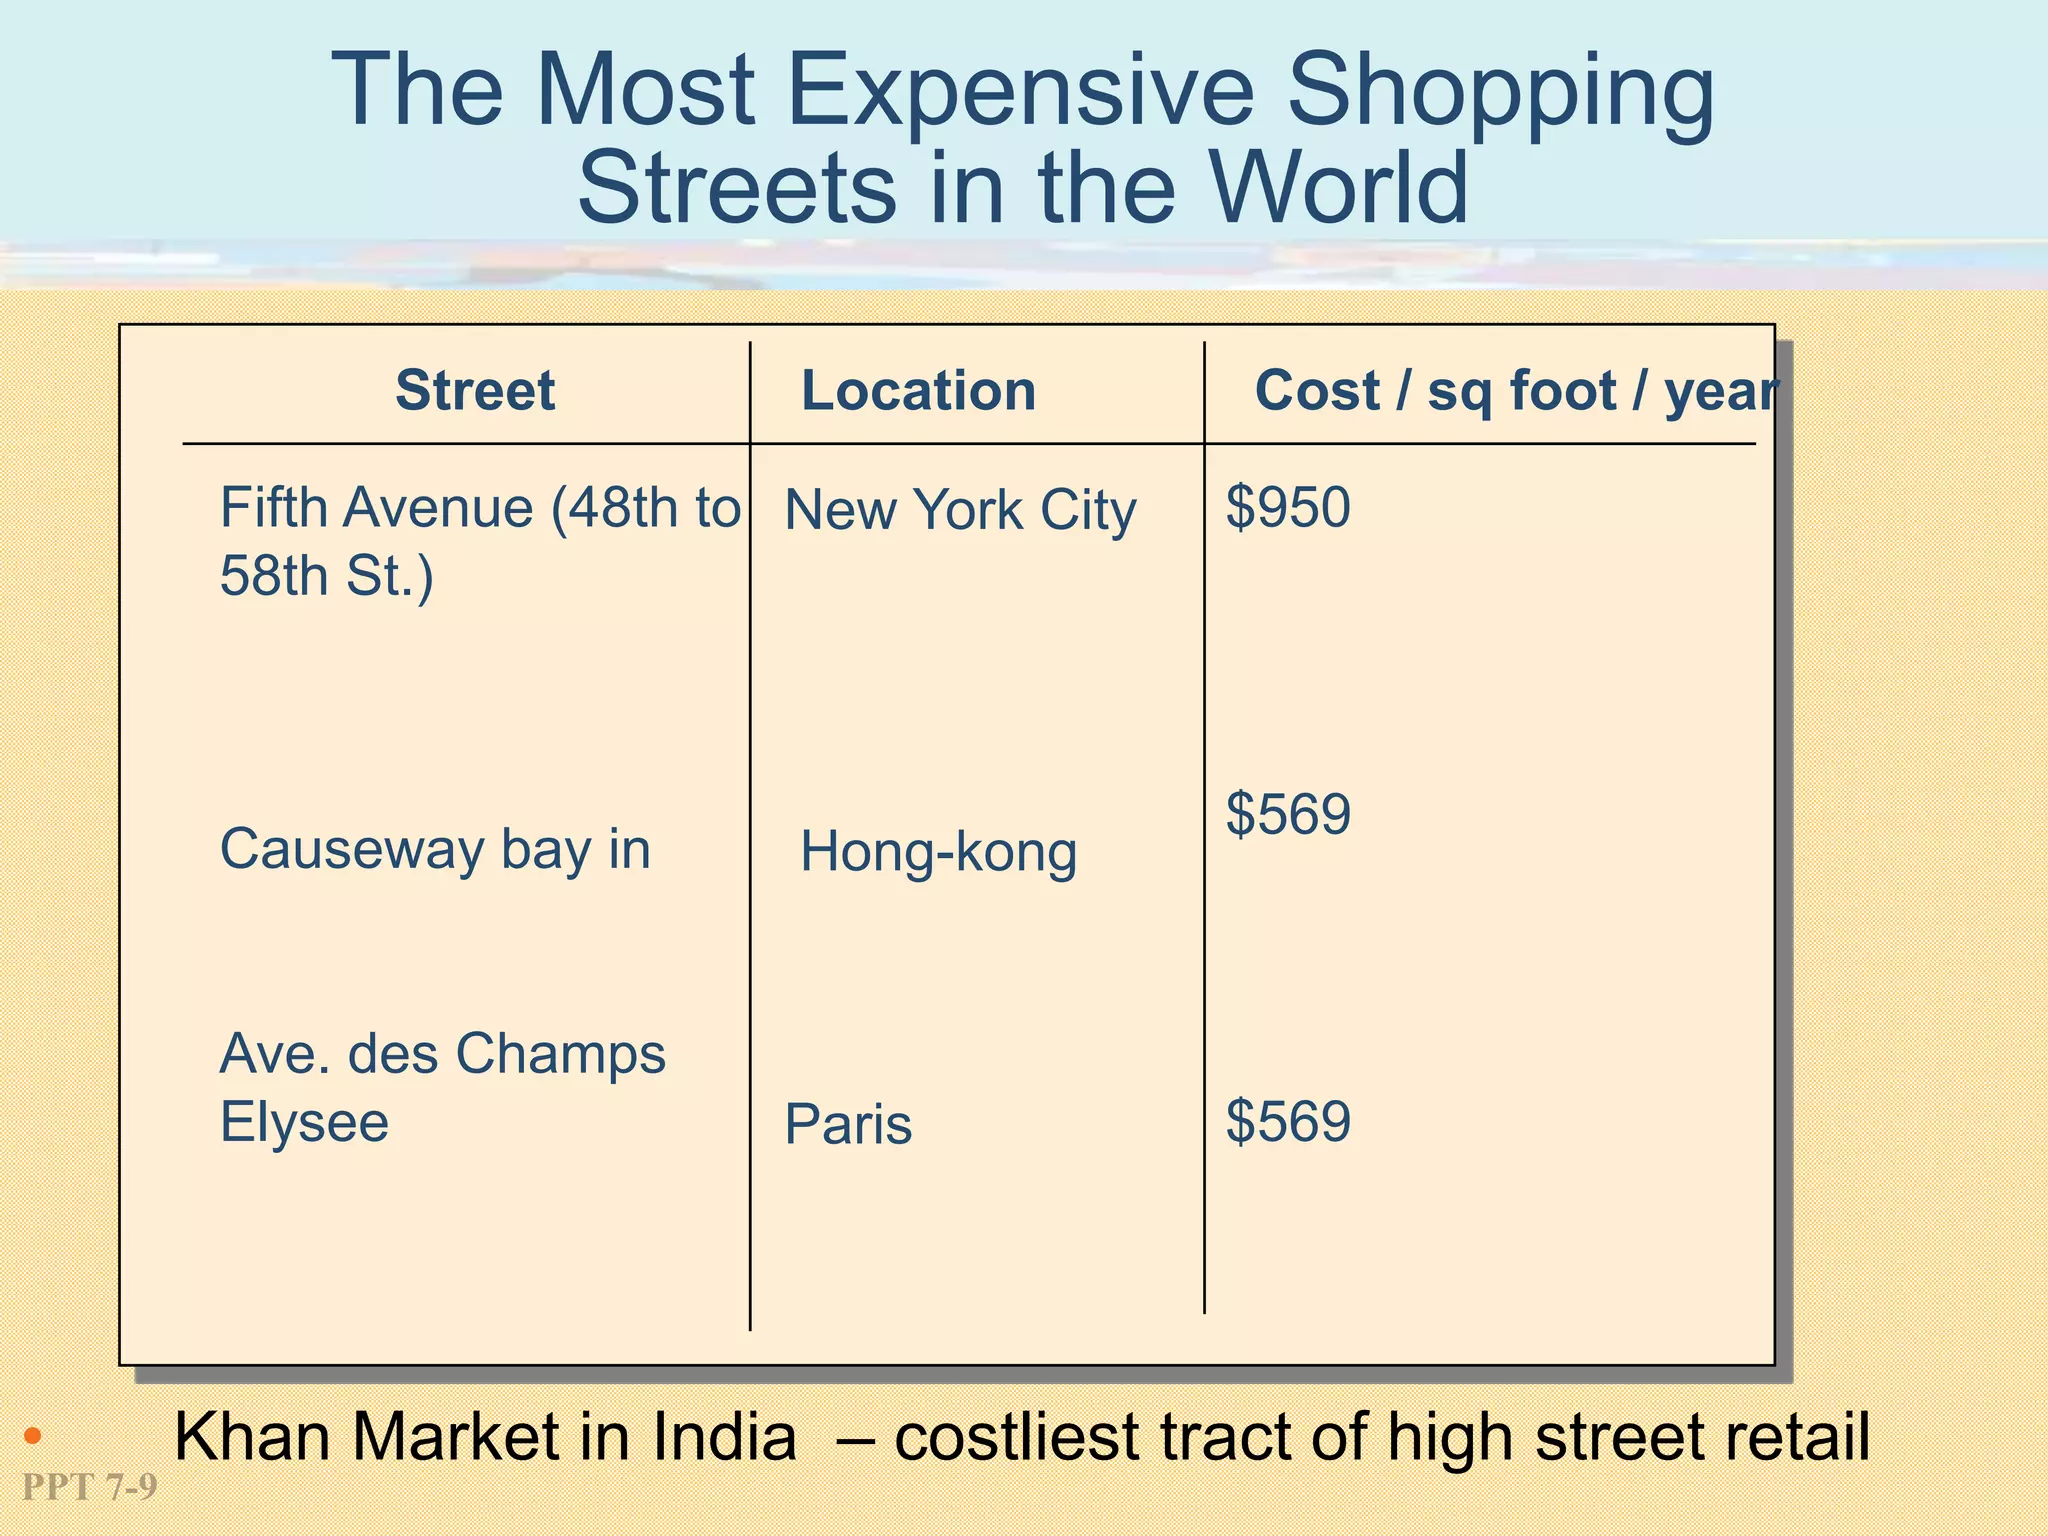
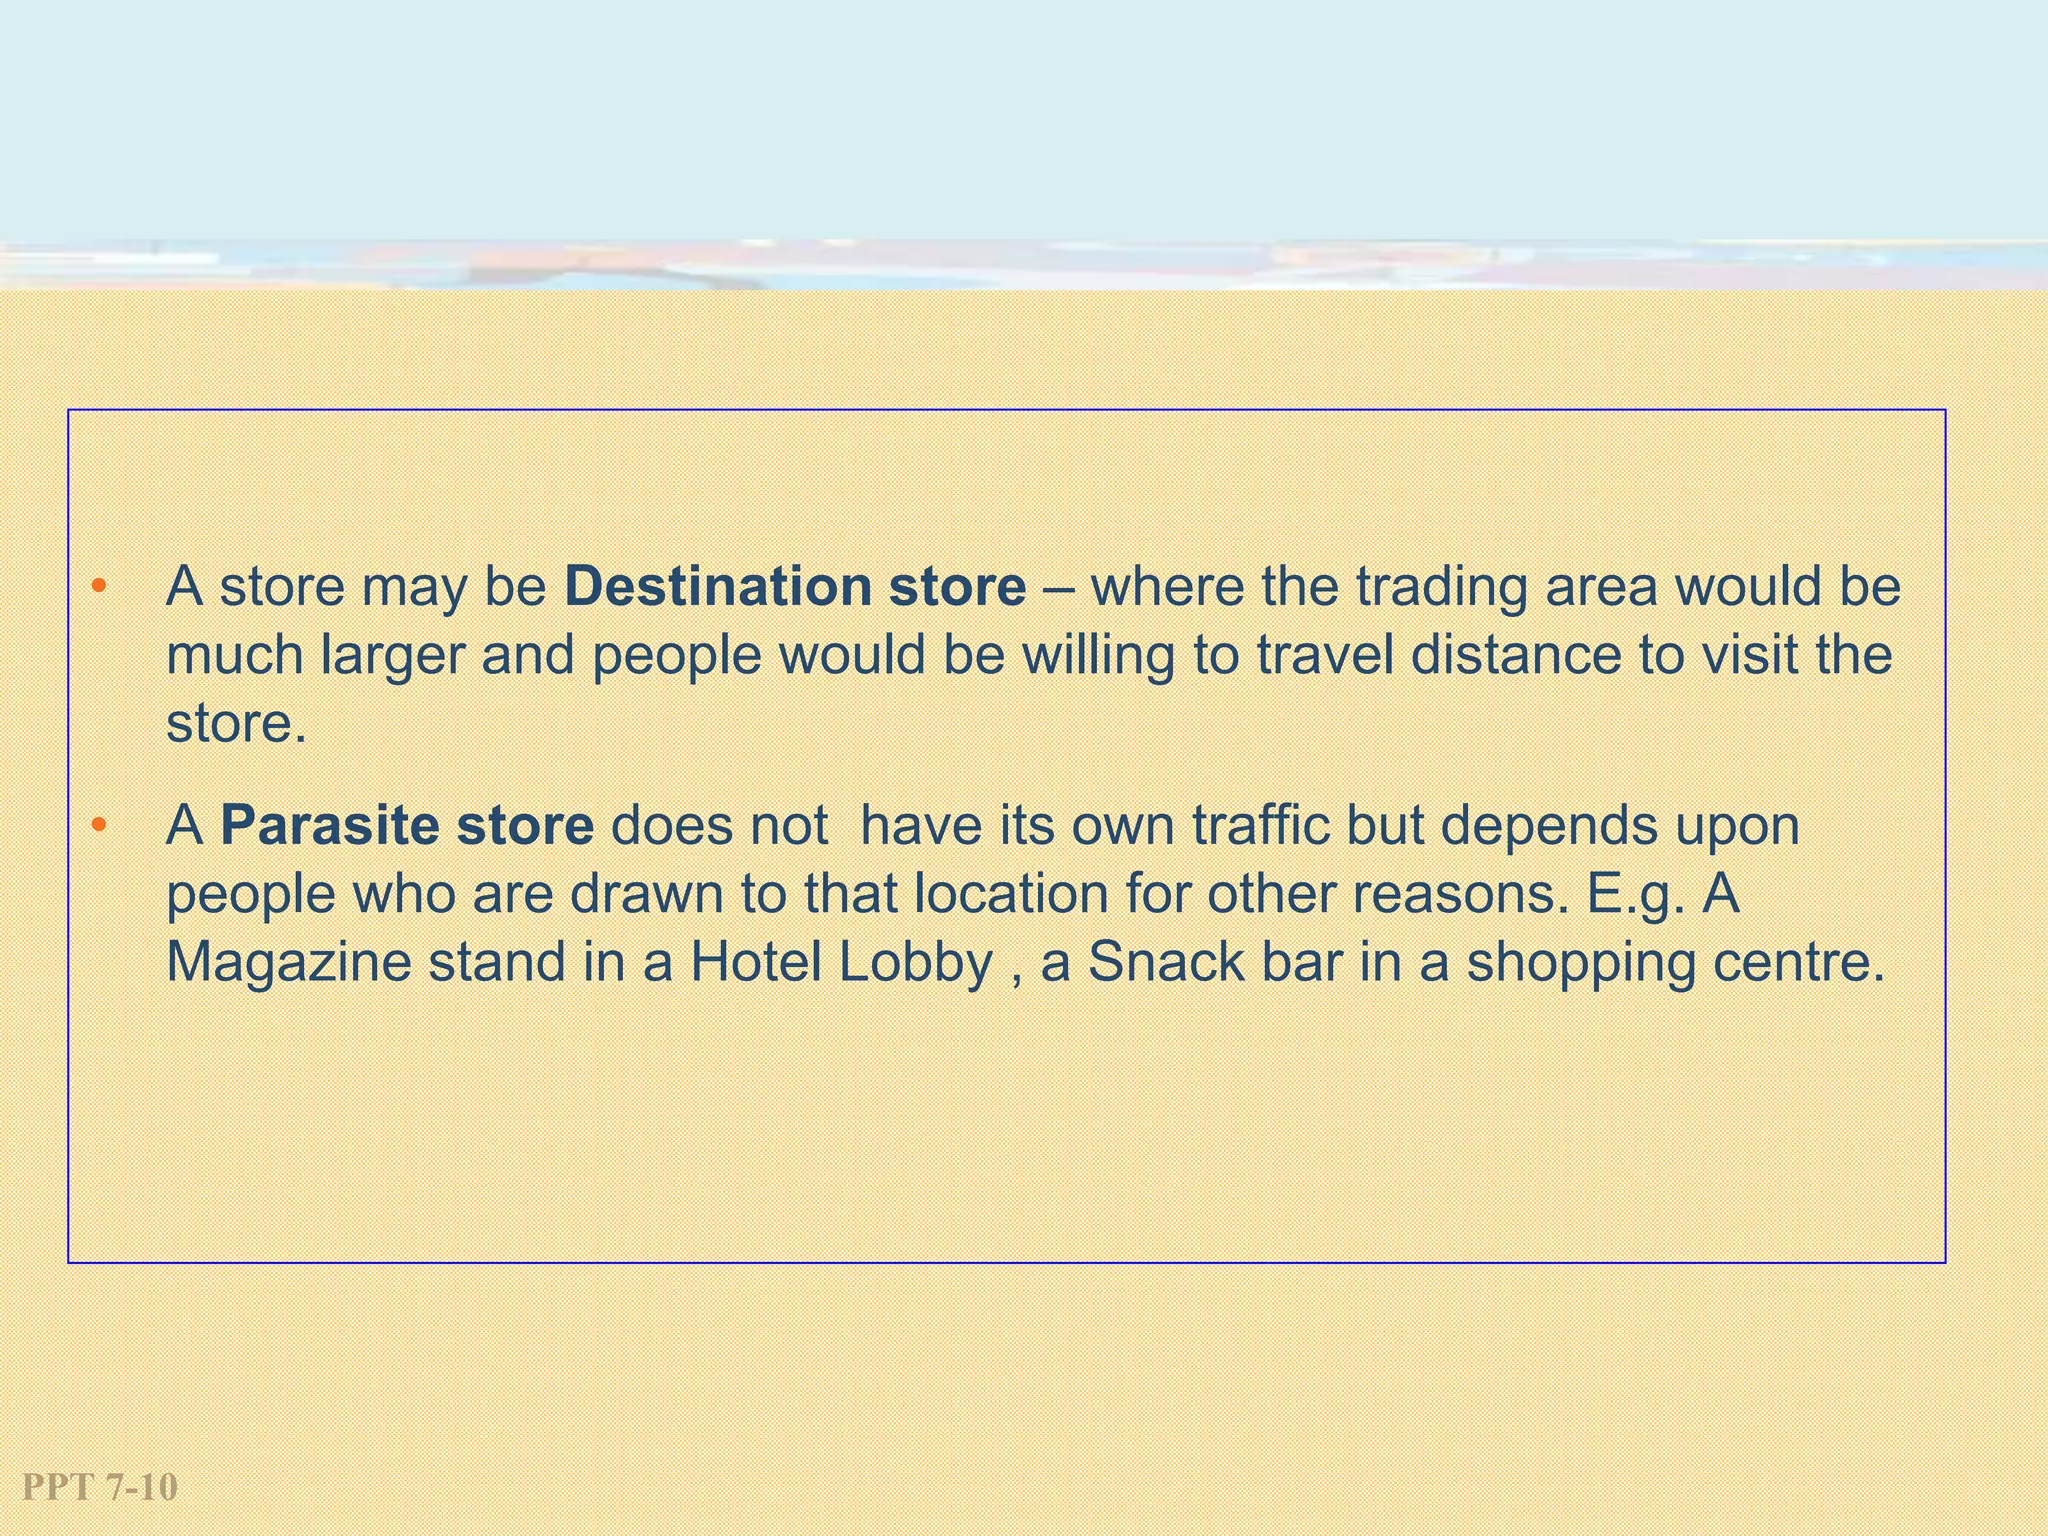
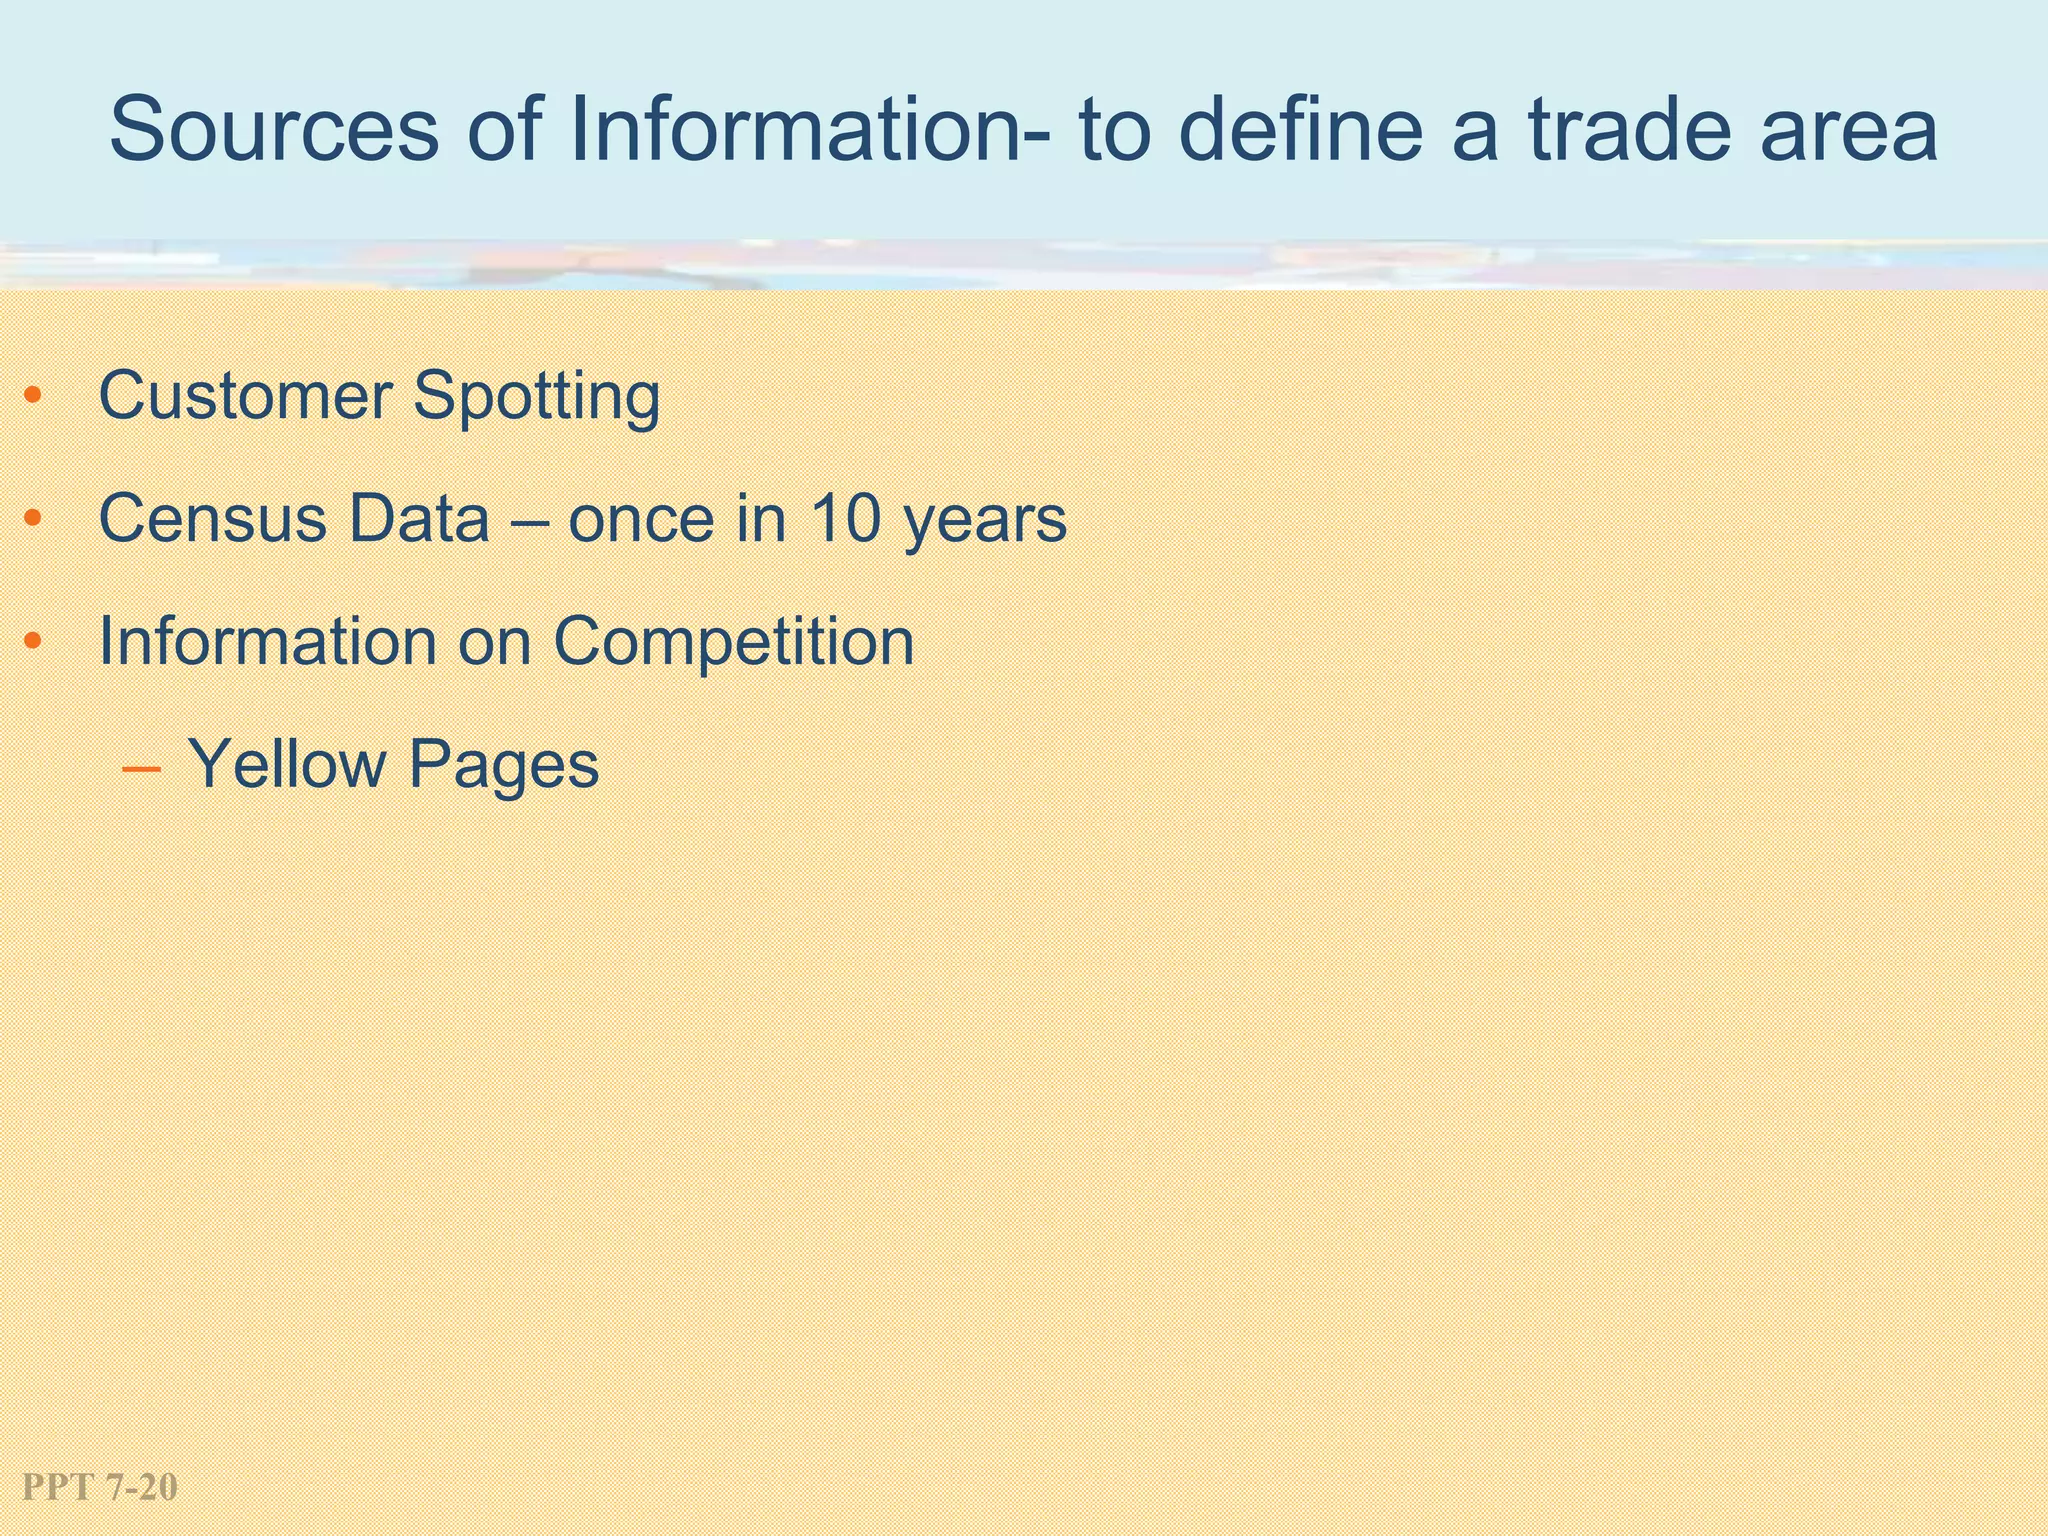
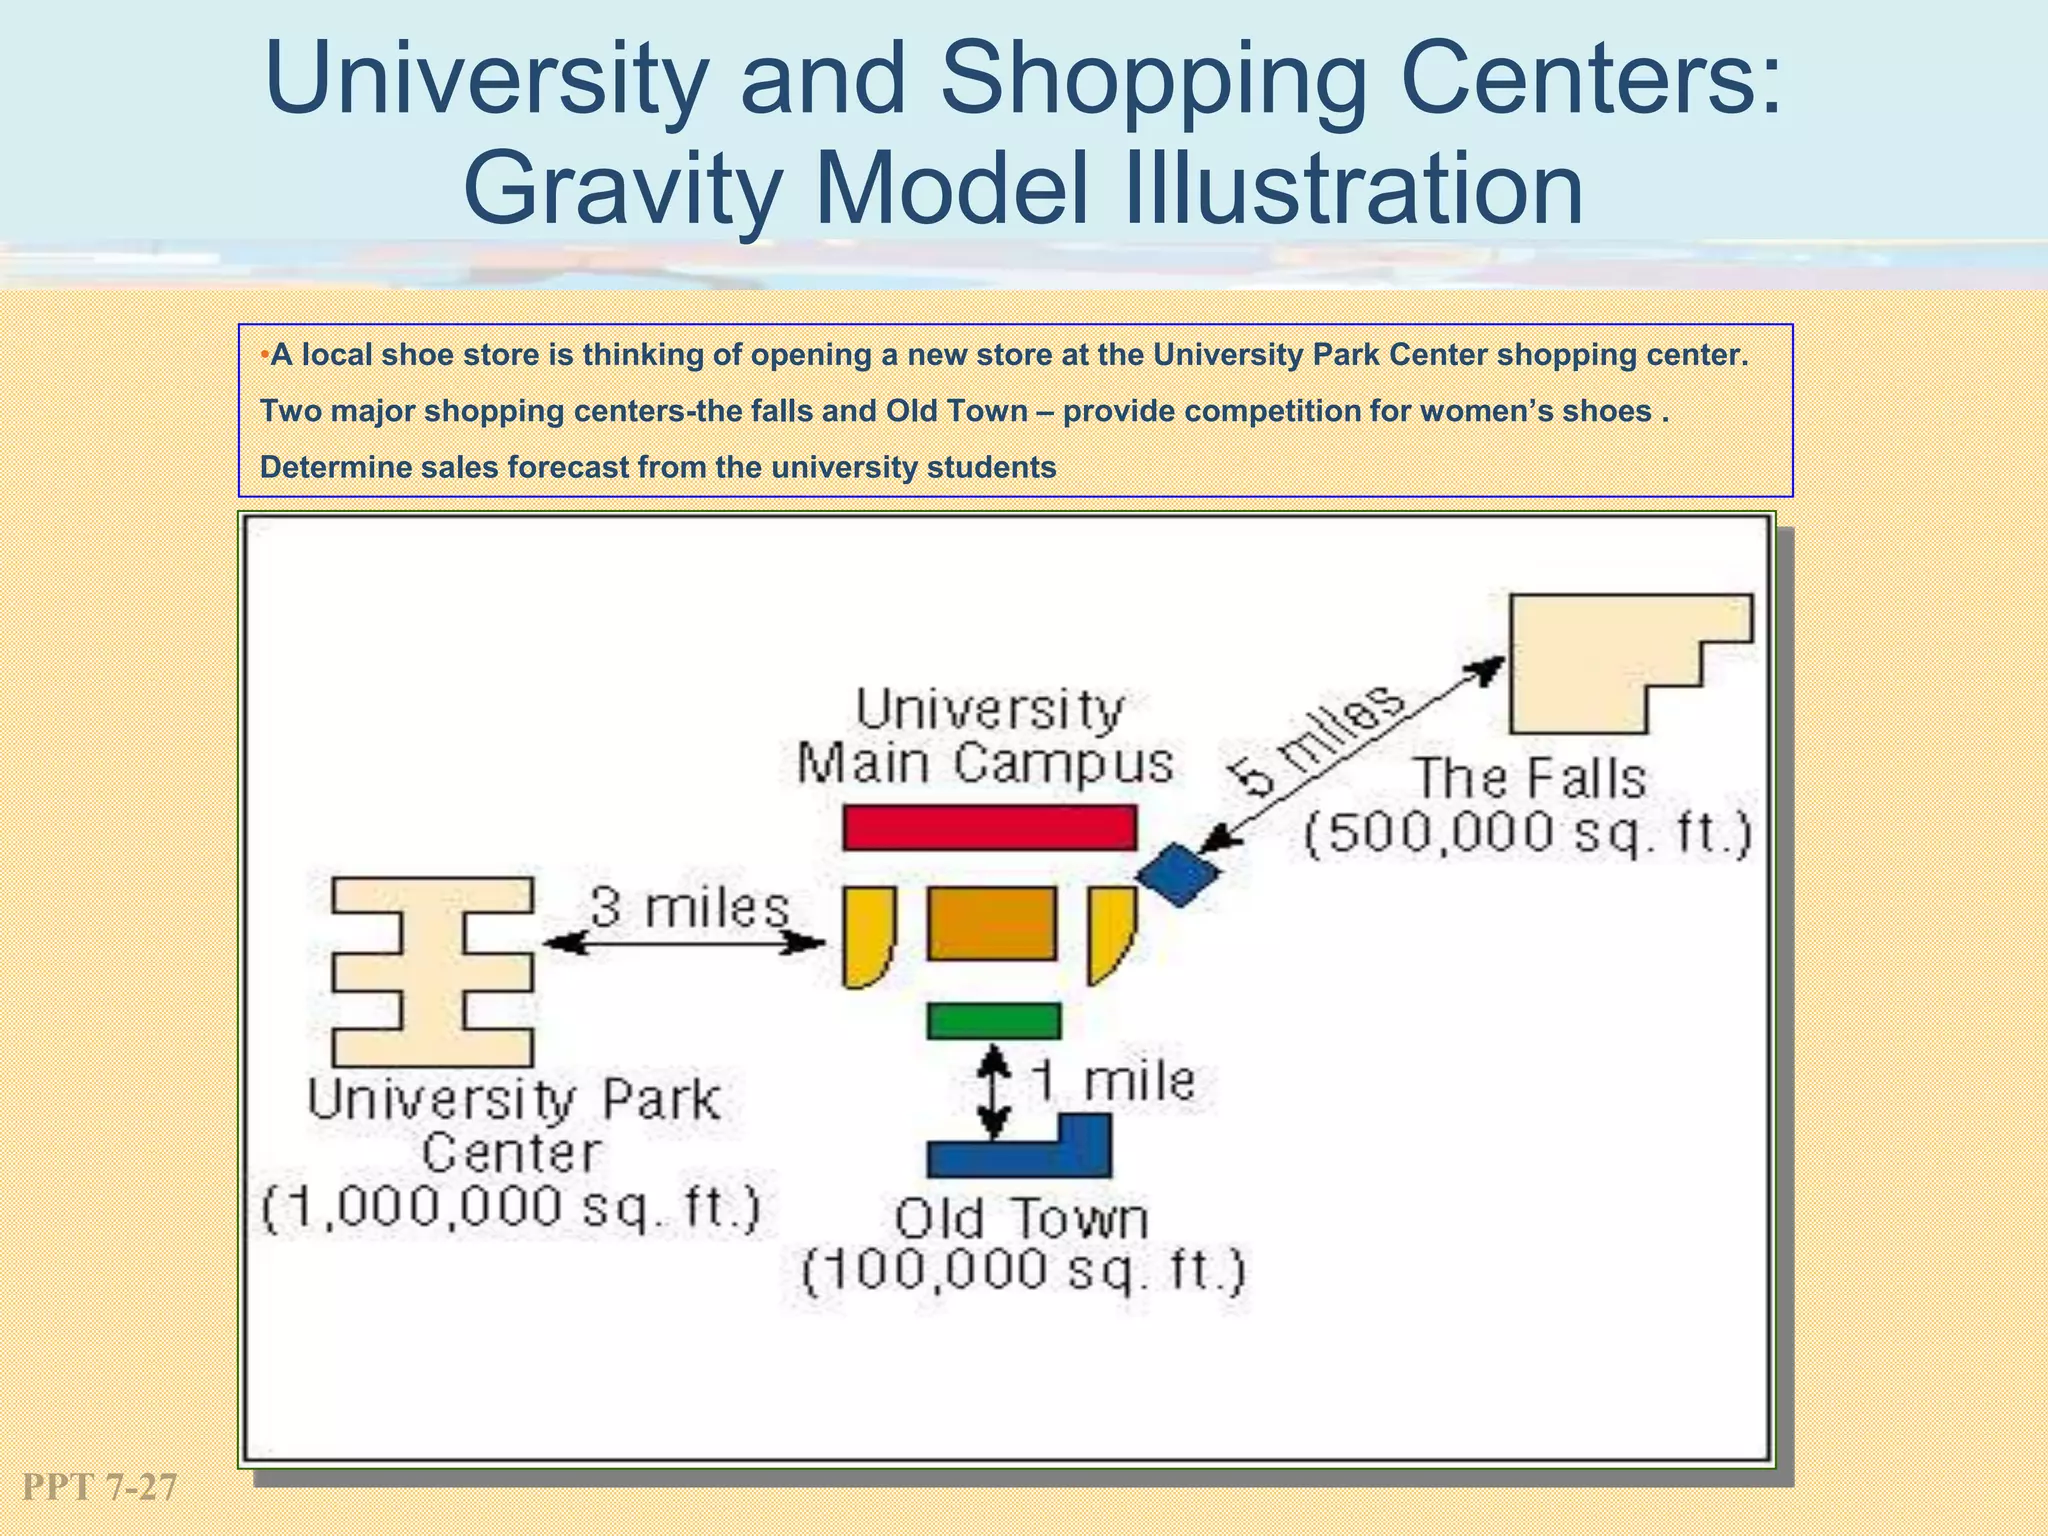
PPT 7-1
Topic
Store Locations
McGraw-Hill/Irwin
Levy/Weitz: Retailing Management, 5/e Copyright © 2004 by The McGraw-Hill Companies, Inc. All rights reserved.
PPT 7-2
What Are the
Three Most Important Things in Retailing?
PPT 7-3
What Are the
Three Most Important Things in Retailing?
Location! Location! Location!
PPT 7-4
Retail Mix
Retail Strategy
Customer
Service
Location
Merchandise
Assortment
Pricing
Communication
Mix
Store Design
And Display
PPT 7-5
Store Location
• The most important “p” in retailing
• If the retail store was located in the right place,
it was considered to be adequate assurance for
success .
PPT 7-6
Shopping behavior for location
• Convenience Shopping – Grocery and impulse items
• Comparison Shopping - purchased infrequently with high unit
price
 more intensive selling effort by store owner e.g. automobiles ,
furniture , men’s suits
• Specialty shopping – products with high unit price
 which are bought infrequently
 which require a special effort on the part of customer to make a
purchase
 for which no substitutes are considered
 which are sold in exclusive franchise outlets . e.g. expensive
Jewellery, expensive perfumes etc.
PPT 7-7
Type of Store Locations
Shopping Centers
– Strip Shopping Centers
– Shopping Malls
City or Town Locations
– Inner City
– Main Street
Free Standing Sites
CBD- a place of commerce – CP, Sadar
Market in Gurgaon
SBD -Lajpat Nagar , Karol bagh ,Kamla Nagar
PPT 7-8
Other Retail Location Opportunities
Mixed Use Developments
Airports
Resorts
Hospitals
Store within a Store
PPT 7-9
The Most Expensive Shopping
Streets in the World
Street Location Cost / sq foot / year
Fifth Avenue (48th to
58th St.)
Causeway bay in
Ave. des Champs
Elysee
New York City
Hong-kong
Paris
$950
$569
$569
• Khan Market in India – costliest tract of high street retail
PPT 7-10
• A store may be Destination store – where the trading area would be
much larger and people would be willing to travel distance to visit the
store.
• A Parasite store does not have its own traffic but depends upon
people who are drawn to that location for other reasons. E.g. A
Magazine stand in a Hotel Lobby , a Snack bar in a shopping centre.
PPT 7-11
Tradeoff Between Locations
Rent
Traffic
There are relative advantages
and disadvantages to consider
with each location.
PPT 7-12
literacy education,
Characteristics of the households in
the area-average household
income, employment levels
• Factors affecting the choice of market
• various permissions which are
needed, the hours in which the
store can operate, minimum
wages to be offered, holidays
required
• no. of potential customers that may
patronize the store.
• Trading area will shrink or grow
depending upon the products sold
PPT 7-13
Factors Affecting the
Attractiveness of a Site
• How Attractive Is the Site to the Retailer’s Target
Market?
– Match Between Trade Area Demographics and Retailer’s
Target Market –
– Likelihood of Customers Coming to Location
• Other Attractive Retailers At Location
Principle of cumulative attraction - a cluster of similar and
complementary retailing activities will have greater drawing power.
• Cost of operating the store
PPT 7-14
Convenience of Going to Site
Accessibility
• Road pattern and condition
• Natural and artificial barriers
• Visibility
•Adjacent Tenants
• Traffic flow
• Parking
• Congestion
• Ingress/egress
PPT 7-15
• In High Traffic Areas
•Near Anchor
•Center of Shopping Area
• Near Stores Selling Complementary Merchandise
Mobile Phones and its accessories, Lifestyle stores – Red riding
Scarves, Perfume shops, make up products
Food stores – Ice creams , Hospitals – Chemist,
Better locations cost more
Preferred Location within centers
PPT 7-16
Shopper’s Stop Retail Mix
Enclosed
malls/
Standing
stores
Customer
Service
Merchandise
Assortment
Pricing
Communication
Mix
Store Display
And Design
Location Strategy
PPT 7-17
Measuring the trade area for Retail site
• The next step is to collect information about the trade area
that can be used to forecast sales for a store located at a
site .
• A trade area is the geographic area from which a store
generates the majority of its customers. This often is the
geographic area that represents 75-percent of current
customers.
PPT 7-18
Trade Area Analysis
• Insight into the people in the trade area
• Allow consumer demand for product and
services to be calculated.
• Help in demographic and life-style information
to be gathered from variety of public and private
sources
PPT 7-19
Trade Area Analysis
• Secondary trading area – additional
• 15-20% store’s customers
• Tertiary area/the fringe – covers the
• balance customers
• Primary trading area – 50-80% store’s
• customer
• Retail store
• Retail
store
• Primary trading area
• Secondary Trading area
• Tertiary trading area
• Inputs to retailer for promotion and communication strategies to be adopted by the firm
• Helps in determining the no. of stores that can be located in the area.
PPT 7-20
Sources of Information- to define a trade area
• Customer Spotting
• Census Data – once in 10 years
• Information on Competition
– Yellow Pages
PPT 7-21
Customer Spotting-how many people are in trade area
and where they live ?
Purpose: to spot, or locate, the residences of
customers for a store or shopping center.
How to obtain data:
• Credit card
• Customer surveys
• Customer loyalty programs
• Manually as part of the checkout process
• Automobile license plates and tracing them to owners by
purchasing the information from state Govt. or private
research companies
PPT 7-22
Census Data-potential customer
.
Only once in 10 years.
Each household in the country is
counted to determine the number
of persons per household,
household relationships, sex, race
age and marital status.
• Demographic data vendors specialize in
repackaging and updating census-type data.
PPT 7-23
Measuring Competition
• Calculate total square footage of retail
space devoted to a type of store per
household
• Higher ratios will indicate higher levels
of competition
• Personal visits to store to assess
competition
Information on competition
• The Internet - lists current
locations and future sites.
• Yellow Pages
• Other Sources: Directories
published by trade associations,
chambers of commerce, Chain Store
Guide, International Council of
Shopping Centers, Urban Land
Institute, local newspaper advertising
departments, municipal and county
governments, specialized trade
magazines, list brokers
PPT 7-24
Methods of estimating Potential sales
1. The Analog Approach
1. Current trade area is determined by using the
customer spotting technique.
2. Based on the density of customers from the store, the
primary, secondary and tertiary trade area zones are
defined.
3. Match the characteristics of the current store with the
potential new stores’ locations to determine the best
site.
3 Steps:
PPT 7-25
Methods of estimating Demand
2. Huff’s Gravity Model
It is based on the premise that the probability that
a given customer will shop in a particular store
or shopping center becomes larger as the size
of store or center grows and distance or
travel time from customer shrinks
The objective of Huff’s model is to determine the
probability that a customer residing in a particular
area will shop at a particular store or shopping centre
PPT 7-26
Huff’s Model Formula
trips
shopping
of
kinds
different
on
time
travel
of
effect
the
reflects
that
o
exponent t
An
center
shopping
point to
starting
s
customer'
from
distance
or
time
Travel
center
shopping
of
Size
center
shopping
particular
a
to
traveling
origin
of
point
given
a
at
customer
a
of
y
Probabilit
Where
ij
T
b
ij
T
j
j
S
j
i
ij
P
n
1
j
b
ij
T
j
S
b
ij
T
j
S
ij
P









• The value of b is determined through surveys of shopping patterns or
from previous experience
• Larger value of b is assigned if the store or shopping center being
studies specializes in convenience goods rather than shopping goods
• as travel time is more important with convenience goods than with
shopping goods
PPT 7-27
University and Shopping Centers:
Gravity Model Illustration
•A local shoe store is thinking of opening a new store at the University Park Center shopping center.
Two major shopping centers-the falls and Old Town – provide competition for women’s shoes .
Determine sales forecast from the university students
PPT 7-28
Huff’s Model: The Solution
Pij = 1000  32
(1000  32) + (500  52) + (100  12)
Probability = .48
No. of students =.48 x 12,000 students = 5,760 customers
Sales forecast = 5,760 customers x $150 = $864,000
• The university population represents only one geographic sector
• Repeat steps 1 to 3 for the remaining areas and then sum them.
PPT 7-29
Preliminary assessment checklist for a store
location
• City/town
• Street address
• Type of location
• Details of façade
• Size of the store(Area)
• Details of other stores in vicnicity
• No. of stores
• Types of stores
• Size/Area
• Details of residential area surrounding the location
• Demographics
• Socio-economic profile
• Pre-existence of retail store at site.if yes, note details
• Name and address of property owner
• Lease/rent rate
• Photograph of store/surrounding area
PPT 7-30
Case- Hutch- Locating a new store
Which Location would you select and Why ?
Whitfield Square Shopping Center, Dalton, Georgia
OR
Target Plaza, Hinesville, Georgia
OR
GR1 – 8th Dec
GR2-13th Dec.

ch7-store locations-for class.ppt

  • 1.
    PPT 7-1 Topic Store Locations McGraw-Hill/Irwin Levy/Weitz:Retailing Management, 5/e Copyright © 2004 by The McGraw-Hill Companies, Inc. All rights reserved.
  • 2.
    PPT 7-2 What Arethe Three Most Important Things in Retailing?
  • 3.
    PPT 7-3 What Arethe Three Most Important Things in Retailing? Location! Location! Location!
  • 4.
    PPT 7-4 Retail Mix RetailStrategy Customer Service Location Merchandise Assortment Pricing Communication Mix Store Design And Display
  • 5.
    PPT 7-5 Store Location •The most important “p” in retailing • If the retail store was located in the right place, it was considered to be adequate assurance for success .
  • 6.
    PPT 7-6 Shopping behaviorfor location • Convenience Shopping – Grocery and impulse items • Comparison Shopping - purchased infrequently with high unit price  more intensive selling effort by store owner e.g. automobiles , furniture , men’s suits • Specialty shopping – products with high unit price  which are bought infrequently  which require a special effort on the part of customer to make a purchase  for which no substitutes are considered  which are sold in exclusive franchise outlets . e.g. expensive Jewellery, expensive perfumes etc.
  • 7.
    PPT 7-7 Type ofStore Locations Shopping Centers – Strip Shopping Centers – Shopping Malls City or Town Locations – Inner City – Main Street Free Standing Sites CBD- a place of commerce – CP, Sadar Market in Gurgaon SBD -Lajpat Nagar , Karol bagh ,Kamla Nagar
  • 8.
    PPT 7-8 Other RetailLocation Opportunities Mixed Use Developments Airports Resorts Hospitals Store within a Store
  • 9.
    PPT 7-9 The MostExpensive Shopping Streets in the World Street Location Cost / sq foot / year Fifth Avenue (48th to 58th St.) Causeway bay in Ave. des Champs Elysee New York City Hong-kong Paris $950 $569 $569 • Khan Market in India – costliest tract of high street retail
  • 10.
    PPT 7-10 • Astore may be Destination store – where the trading area would be much larger and people would be willing to travel distance to visit the store. • A Parasite store does not have its own traffic but depends upon people who are drawn to that location for other reasons. E.g. A Magazine stand in a Hotel Lobby , a Snack bar in a shopping centre.
  • 11.
    PPT 7-11 Tradeoff BetweenLocations Rent Traffic There are relative advantages and disadvantages to consider with each location.
  • 12.
    PPT 7-12 literacy education, Characteristicsof the households in the area-average household income, employment levels • Factors affecting the choice of market • various permissions which are needed, the hours in which the store can operate, minimum wages to be offered, holidays required • no. of potential customers that may patronize the store. • Trading area will shrink or grow depending upon the products sold
  • 13.
    PPT 7-13 Factors Affectingthe Attractiveness of a Site • How Attractive Is the Site to the Retailer’s Target Market? – Match Between Trade Area Demographics and Retailer’s Target Market – – Likelihood of Customers Coming to Location • Other Attractive Retailers At Location Principle of cumulative attraction - a cluster of similar and complementary retailing activities will have greater drawing power. • Cost of operating the store
  • 14.
    PPT 7-14 Convenience ofGoing to Site Accessibility • Road pattern and condition • Natural and artificial barriers • Visibility •Adjacent Tenants • Traffic flow • Parking • Congestion • Ingress/egress
  • 15.
    PPT 7-15 • InHigh Traffic Areas •Near Anchor •Center of Shopping Area • Near Stores Selling Complementary Merchandise Mobile Phones and its accessories, Lifestyle stores – Red riding Scarves, Perfume shops, make up products Food stores – Ice creams , Hospitals – Chemist, Better locations cost more Preferred Location within centers
  • 16.
    PPT 7-16 Shopper’s StopRetail Mix Enclosed malls/ Standing stores Customer Service Merchandise Assortment Pricing Communication Mix Store Display And Design Location Strategy
  • 17.
    PPT 7-17 Measuring thetrade area for Retail site • The next step is to collect information about the trade area that can be used to forecast sales for a store located at a site . • A trade area is the geographic area from which a store generates the majority of its customers. This often is the geographic area that represents 75-percent of current customers.
  • 18.
    PPT 7-18 Trade AreaAnalysis • Insight into the people in the trade area • Allow consumer demand for product and services to be calculated. • Help in demographic and life-style information to be gathered from variety of public and private sources
  • 19.
    PPT 7-19 Trade AreaAnalysis • Secondary trading area – additional • 15-20% store’s customers • Tertiary area/the fringe – covers the • balance customers • Primary trading area – 50-80% store’s • customer • Retail store • Retail store • Primary trading area • Secondary Trading area • Tertiary trading area • Inputs to retailer for promotion and communication strategies to be adopted by the firm • Helps in determining the no. of stores that can be located in the area.
  • 20.
    PPT 7-20 Sources ofInformation- to define a trade area • Customer Spotting • Census Data – once in 10 years • Information on Competition – Yellow Pages
  • 21.
    PPT 7-21 Customer Spotting-howmany people are in trade area and where they live ? Purpose: to spot, or locate, the residences of customers for a store or shopping center. How to obtain data: • Credit card • Customer surveys • Customer loyalty programs • Manually as part of the checkout process • Automobile license plates and tracing them to owners by purchasing the information from state Govt. or private research companies
  • 22.
    PPT 7-22 Census Data-potentialcustomer . Only once in 10 years. Each household in the country is counted to determine the number of persons per household, household relationships, sex, race age and marital status. • Demographic data vendors specialize in repackaging and updating census-type data.
  • 23.
    PPT 7-23 Measuring Competition •Calculate total square footage of retail space devoted to a type of store per household • Higher ratios will indicate higher levels of competition • Personal visits to store to assess competition Information on competition • The Internet - lists current locations and future sites. • Yellow Pages • Other Sources: Directories published by trade associations, chambers of commerce, Chain Store Guide, International Council of Shopping Centers, Urban Land Institute, local newspaper advertising departments, municipal and county governments, specialized trade magazines, list brokers
  • 24.
    PPT 7-24 Methods ofestimating Potential sales 1. The Analog Approach 1. Current trade area is determined by using the customer spotting technique. 2. Based on the density of customers from the store, the primary, secondary and tertiary trade area zones are defined. 3. Match the characteristics of the current store with the potential new stores’ locations to determine the best site. 3 Steps:
  • 25.
    PPT 7-25 Methods ofestimating Demand 2. Huff’s Gravity Model It is based on the premise that the probability that a given customer will shop in a particular store or shopping center becomes larger as the size of store or center grows and distance or travel time from customer shrinks The objective of Huff’s model is to determine the probability that a customer residing in a particular area will shop at a particular store or shopping centre
  • 26.
    PPT 7-26 Huff’s ModelFormula trips shopping of kinds different on time travel of effect the reflects that o exponent t An center shopping point to starting s customer' from distance or time Travel center shopping of Size center shopping particular a to traveling origin of point given a at customer a of y Probabilit Where ij T b ij T j j S j i ij P n 1 j b ij T j S b ij T j S ij P          • The value of b is determined through surveys of shopping patterns or from previous experience • Larger value of b is assigned if the store or shopping center being studies specializes in convenience goods rather than shopping goods • as travel time is more important with convenience goods than with shopping goods
  • 27.
    PPT 7-27 University andShopping Centers: Gravity Model Illustration •A local shoe store is thinking of opening a new store at the University Park Center shopping center. Two major shopping centers-the falls and Old Town – provide competition for women’s shoes . Determine sales forecast from the university students
  • 28.
    PPT 7-28 Huff’s Model:The Solution Pij = 1000  32 (1000  32) + (500  52) + (100  12) Probability = .48 No. of students =.48 x 12,000 students = 5,760 customers Sales forecast = 5,760 customers x $150 = $864,000 • The university population represents only one geographic sector • Repeat steps 1 to 3 for the remaining areas and then sum them.
  • 29.
    PPT 7-29 Preliminary assessmentchecklist for a store location • City/town • Street address • Type of location • Details of façade • Size of the store(Area) • Details of other stores in vicnicity • No. of stores • Types of stores • Size/Area • Details of residential area surrounding the location • Demographics • Socio-economic profile • Pre-existence of retail store at site.if yes, note details • Name and address of property owner • Lease/rent rate • Photograph of store/surrounding area
  • 30.
    PPT 7-30 Case- Hutch-Locating a new store Which Location would you select and Why ? Whitfield Square Shopping Center, Dalton, Georgia OR Target Plaza, Hinesville, Georgia OR GR1 – 8th Dec GR2-13th Dec.