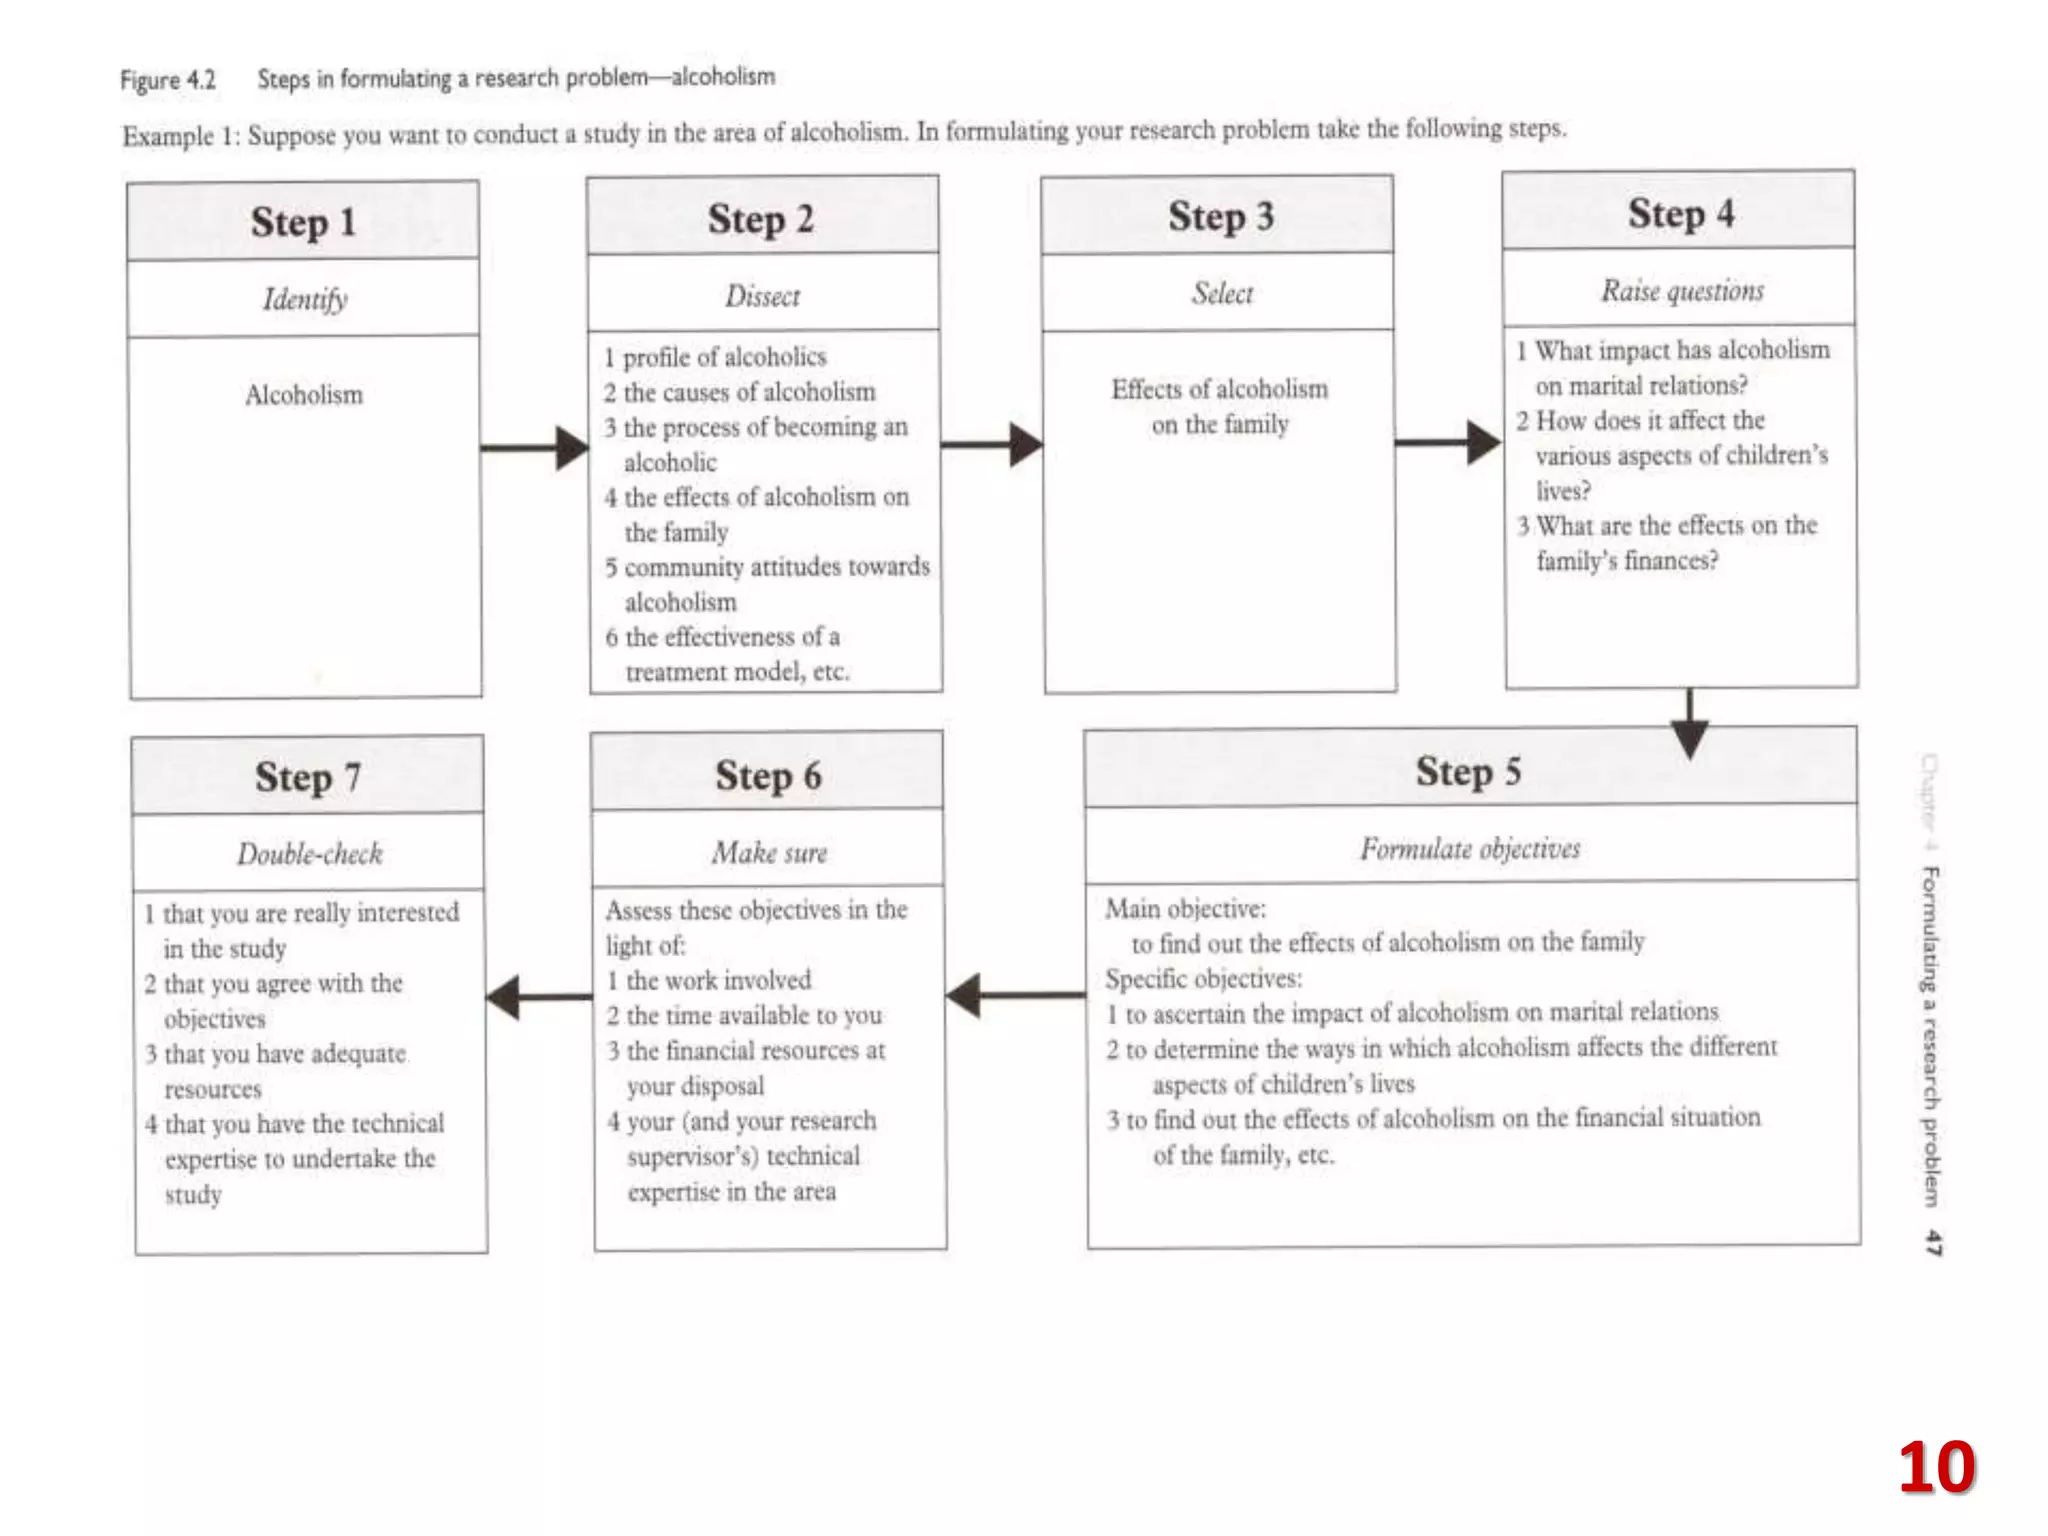
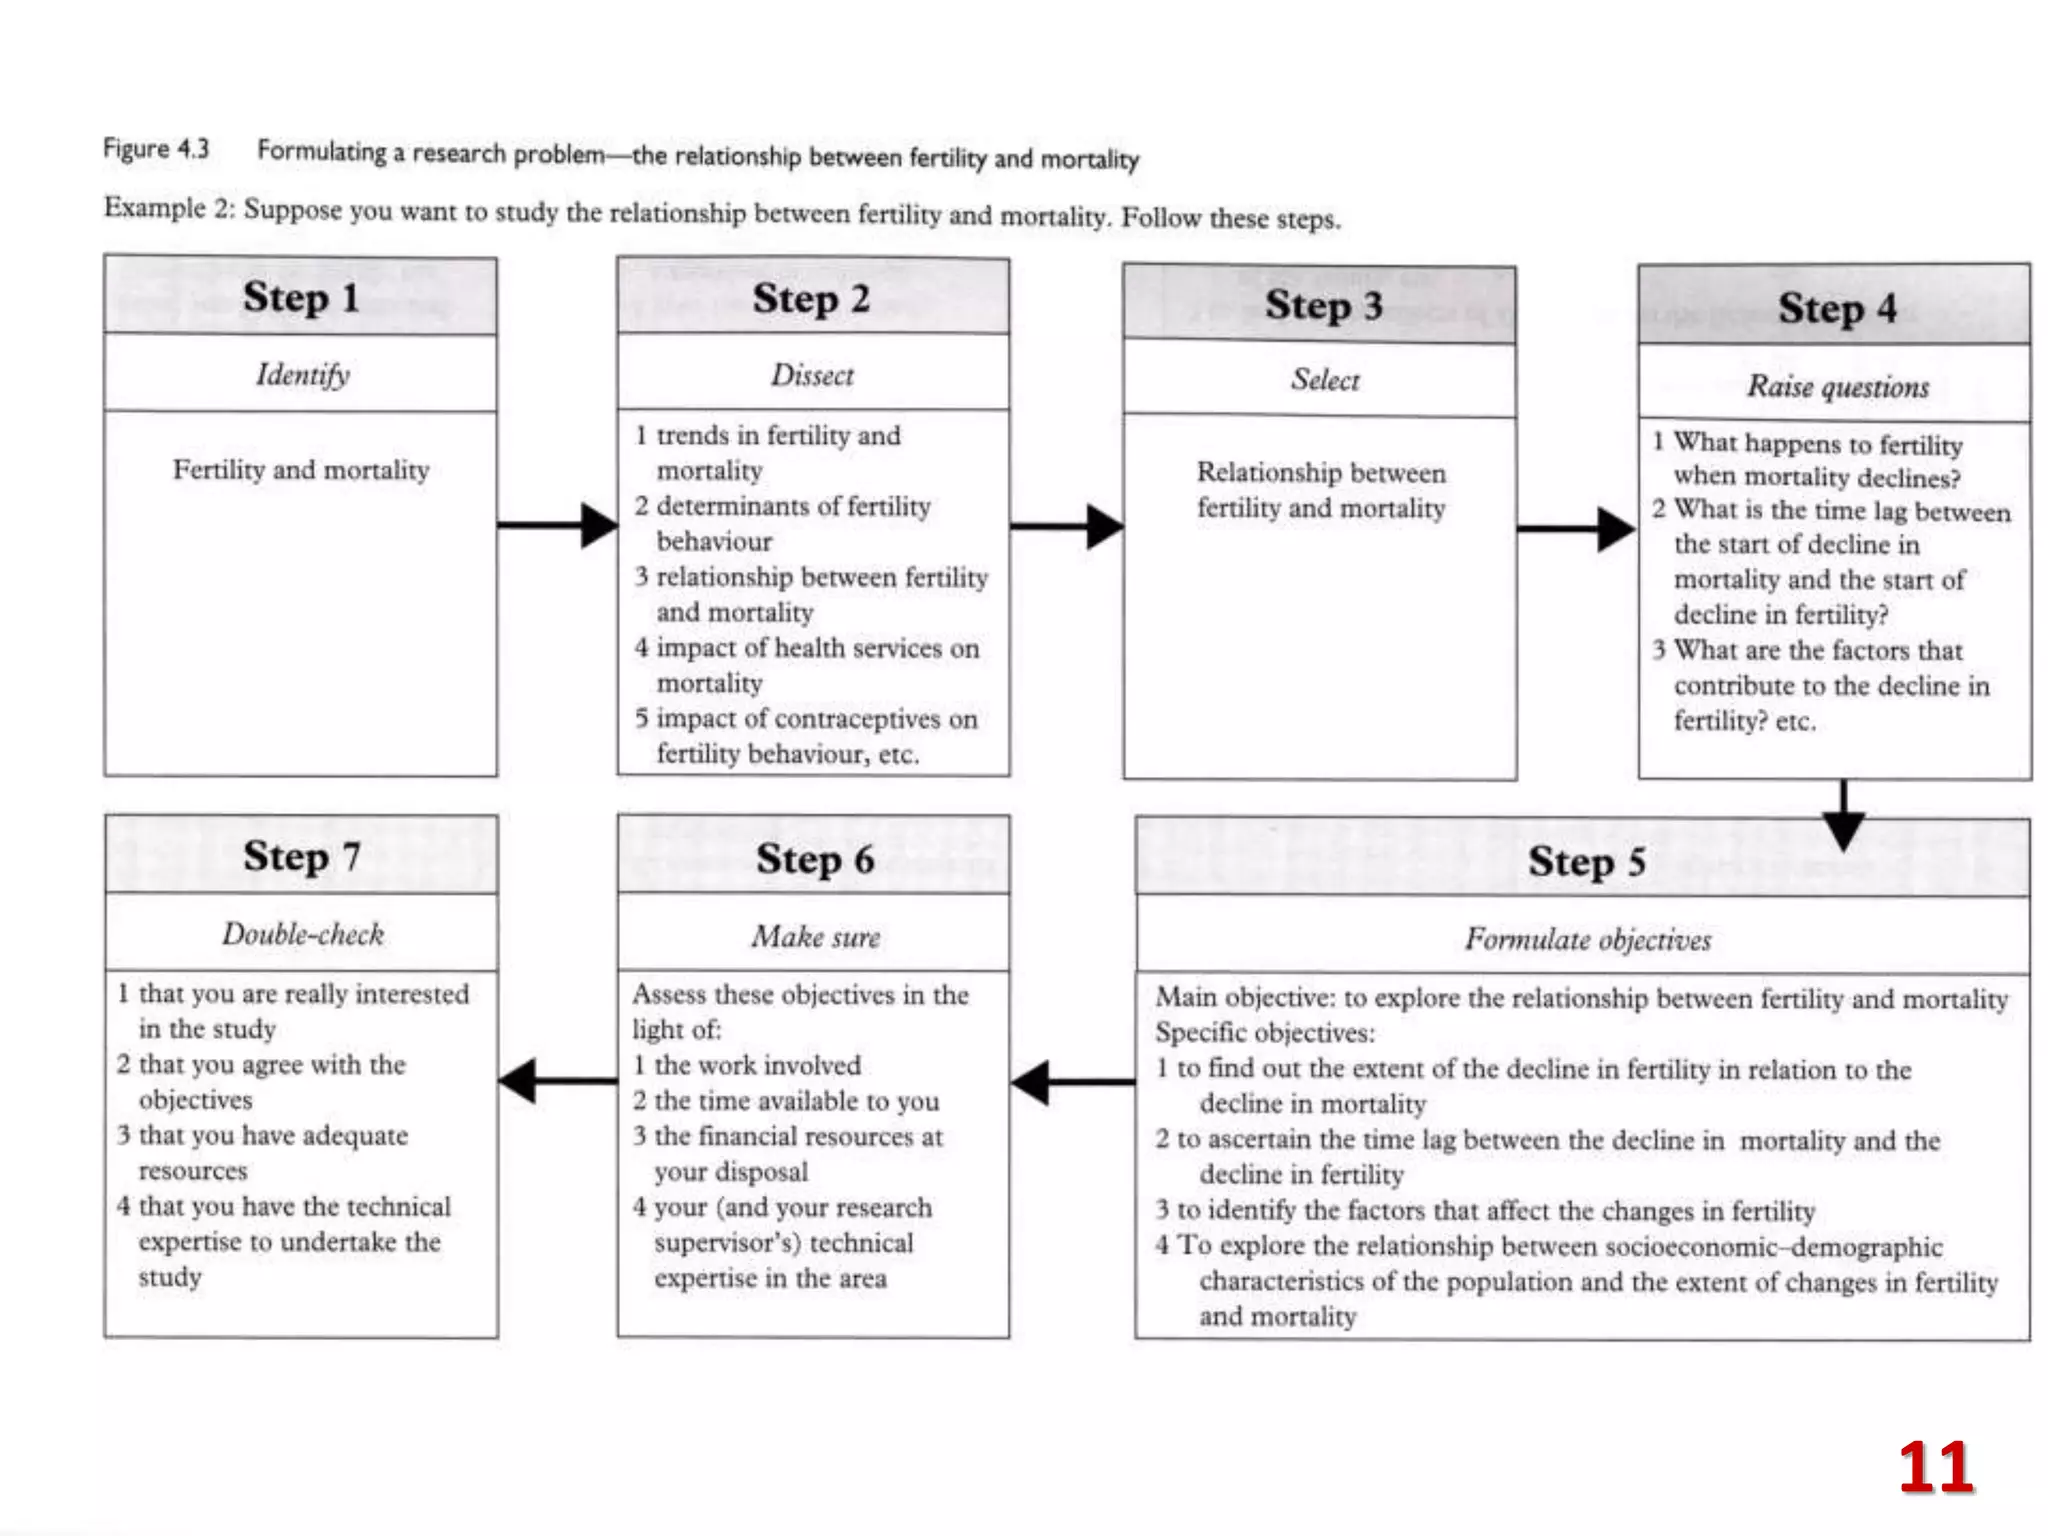
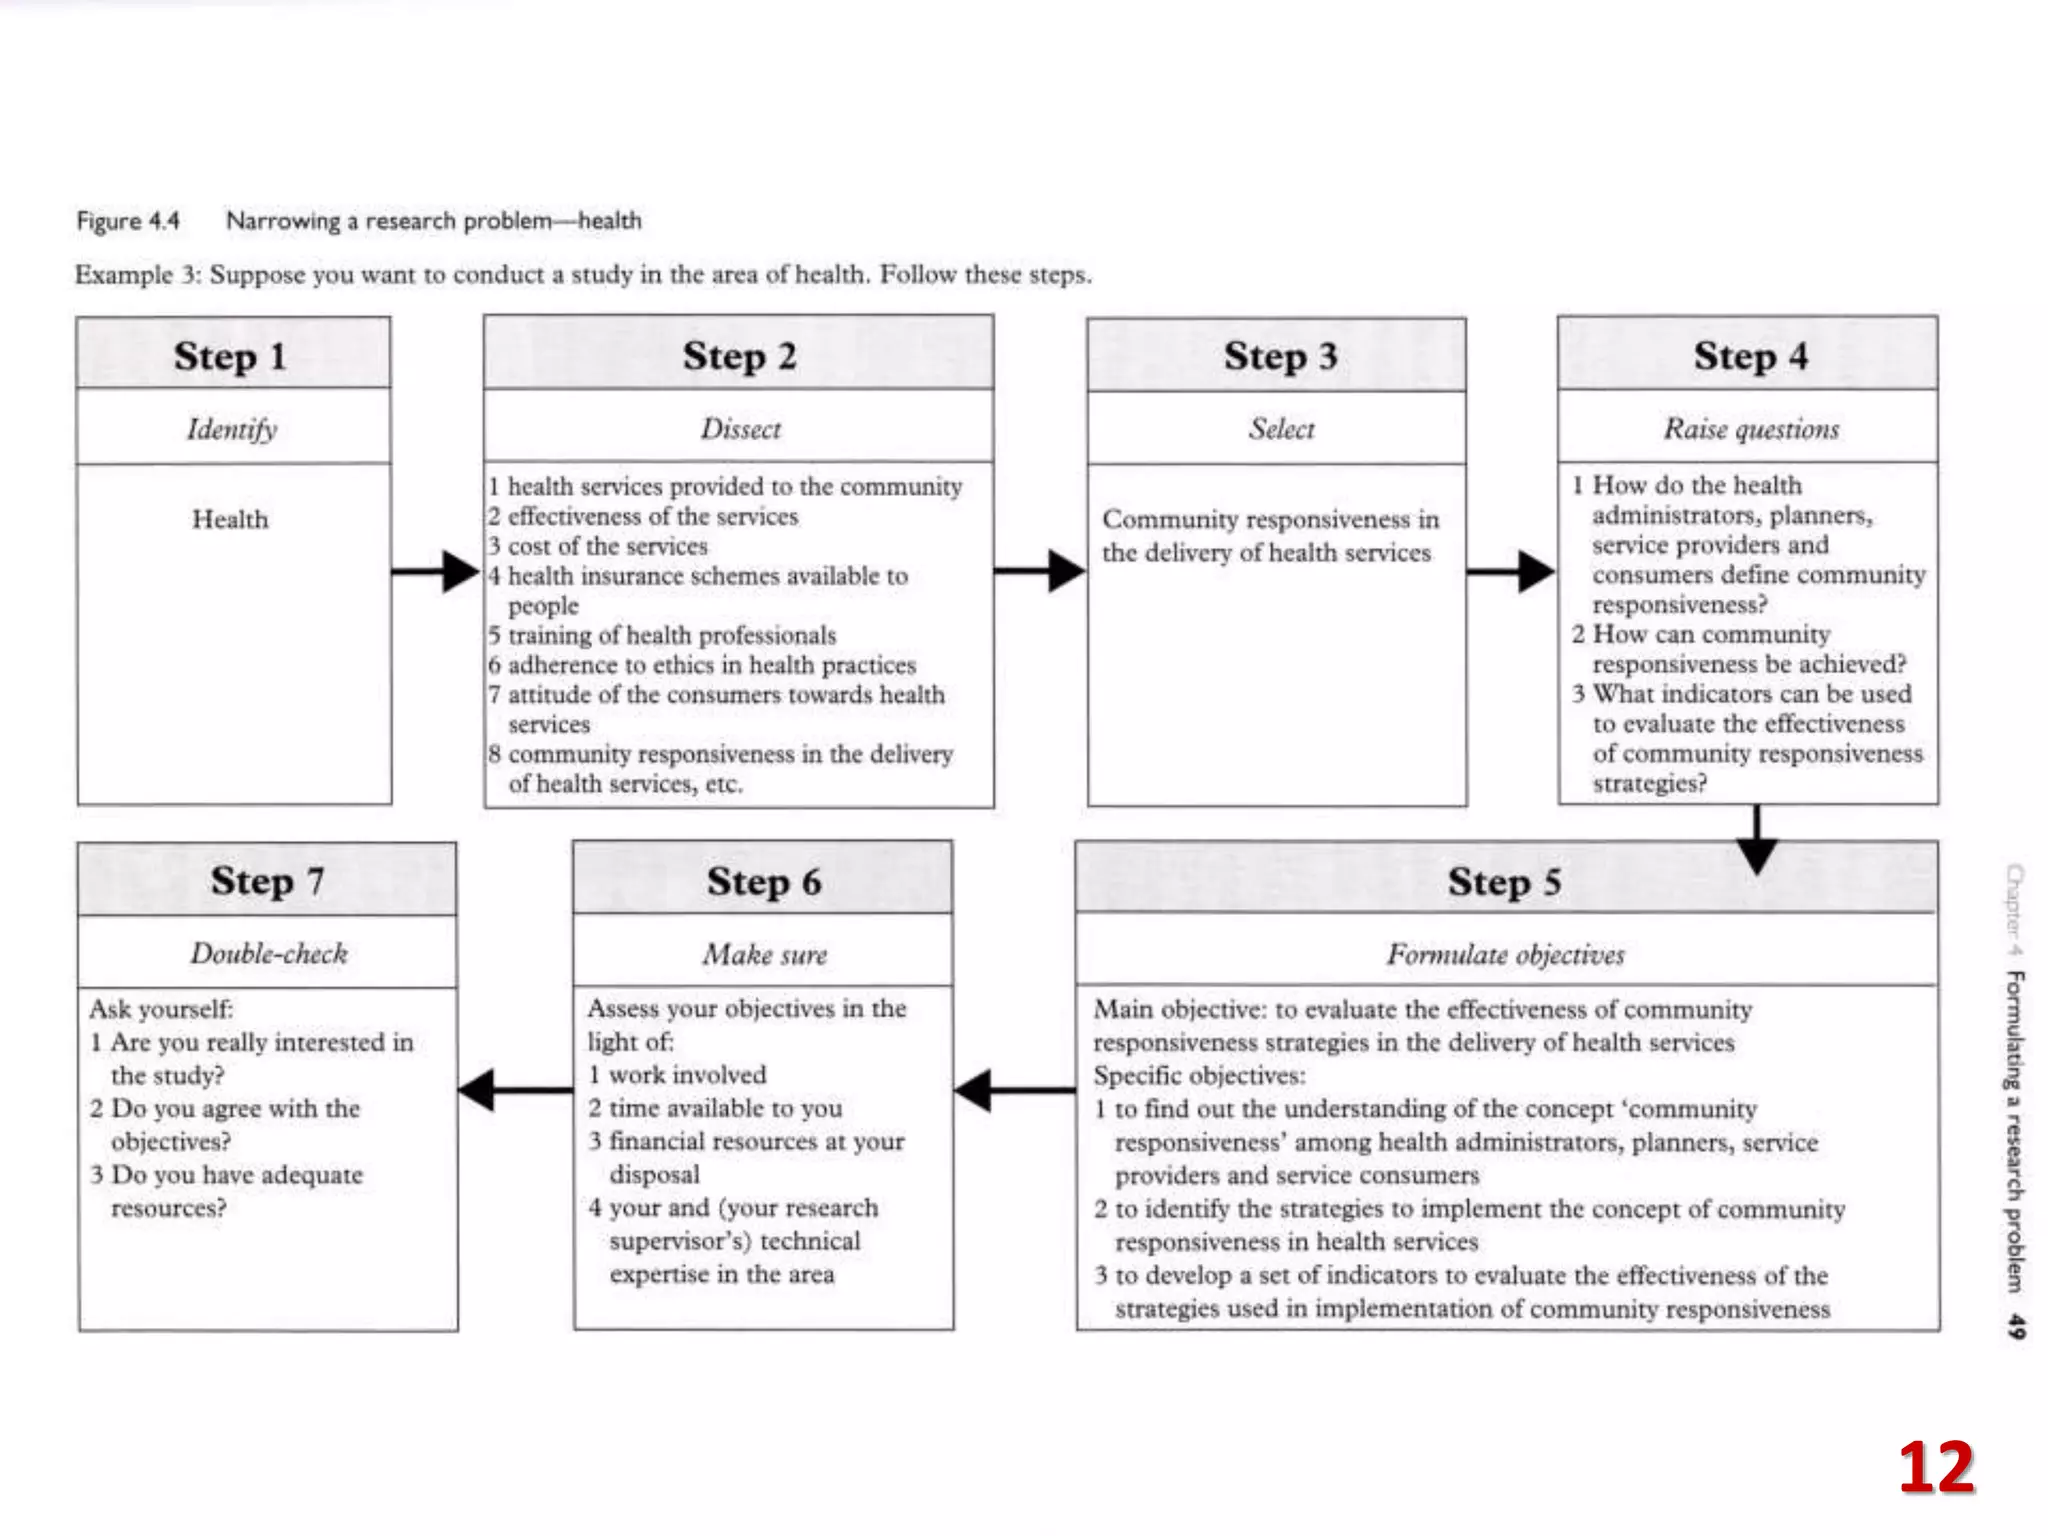
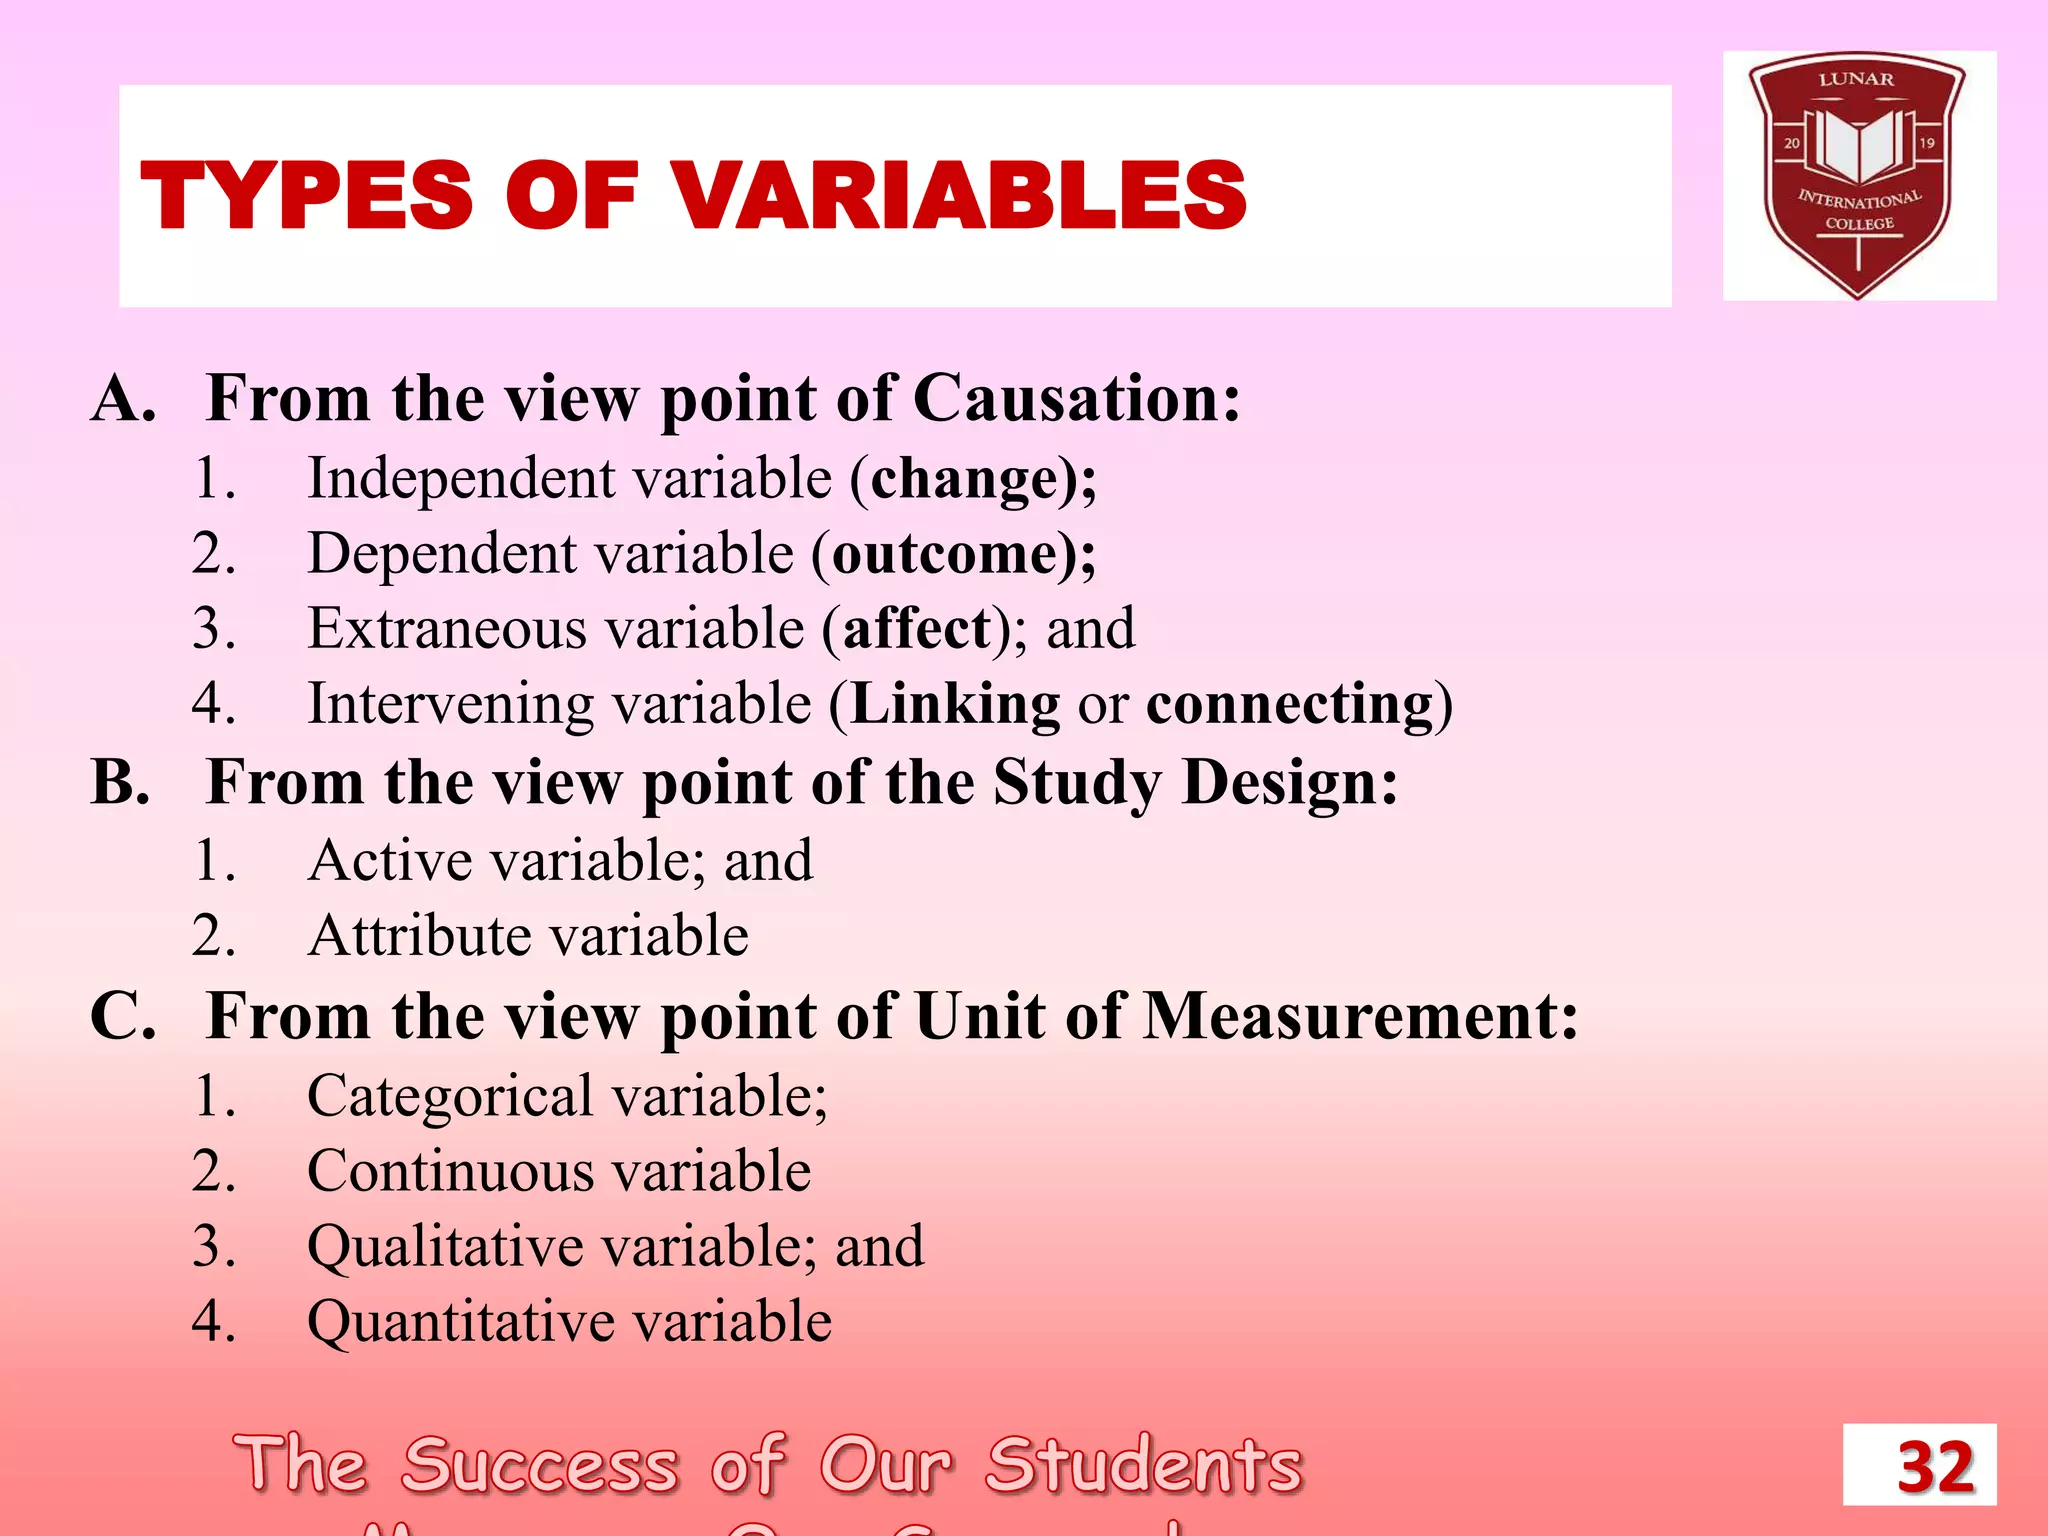
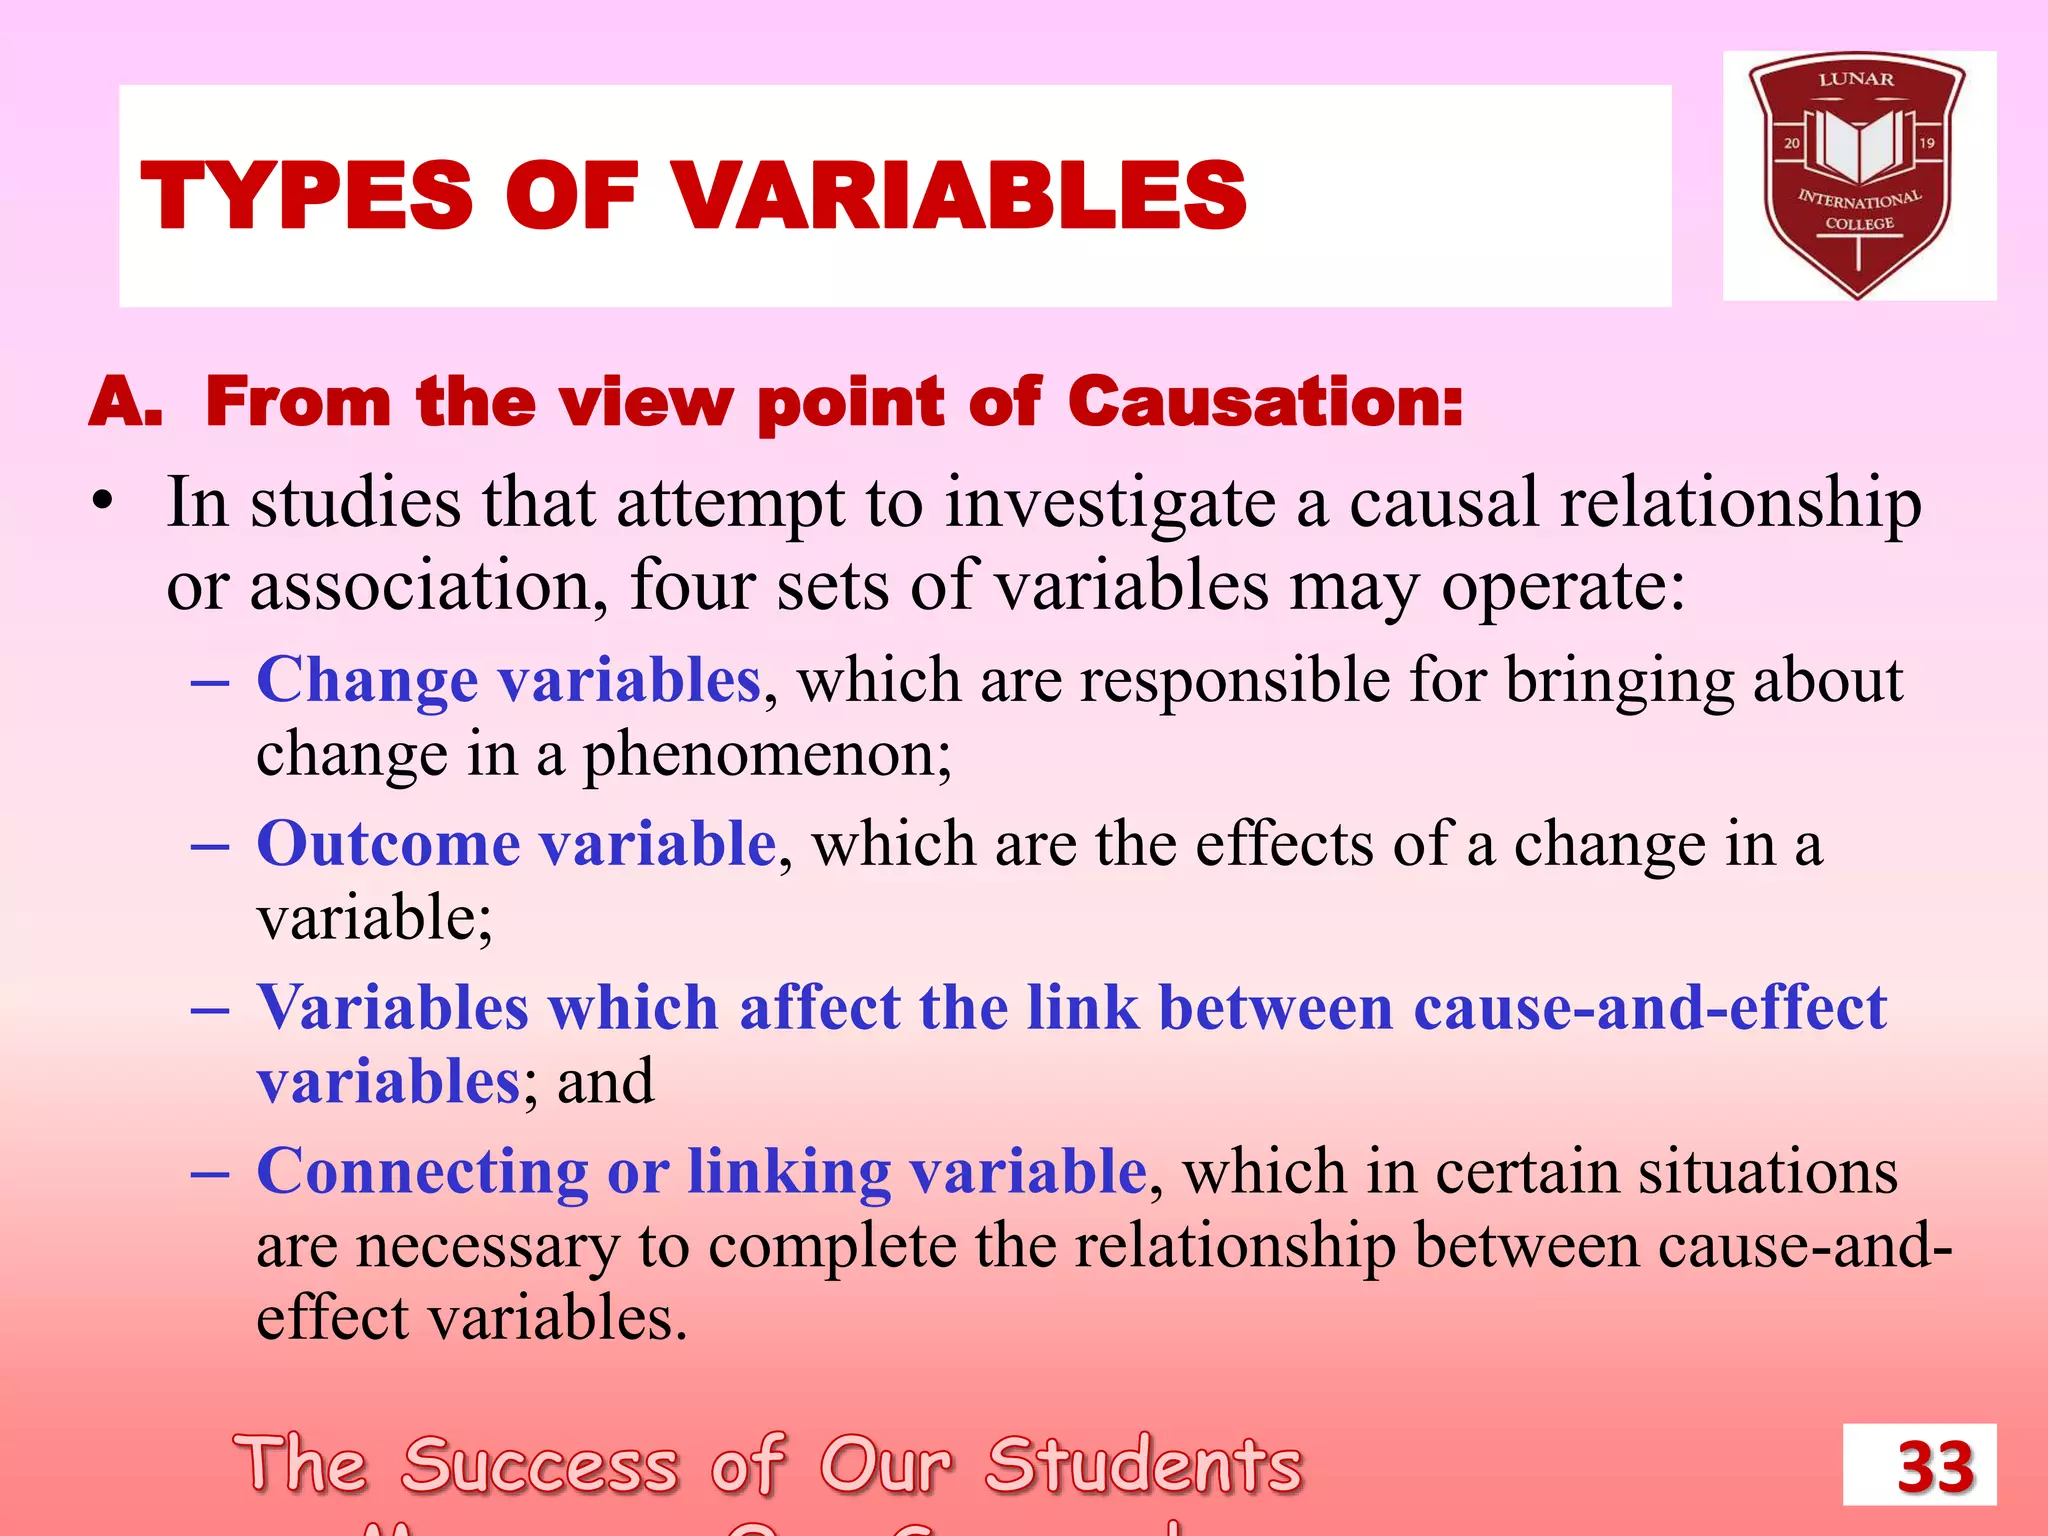
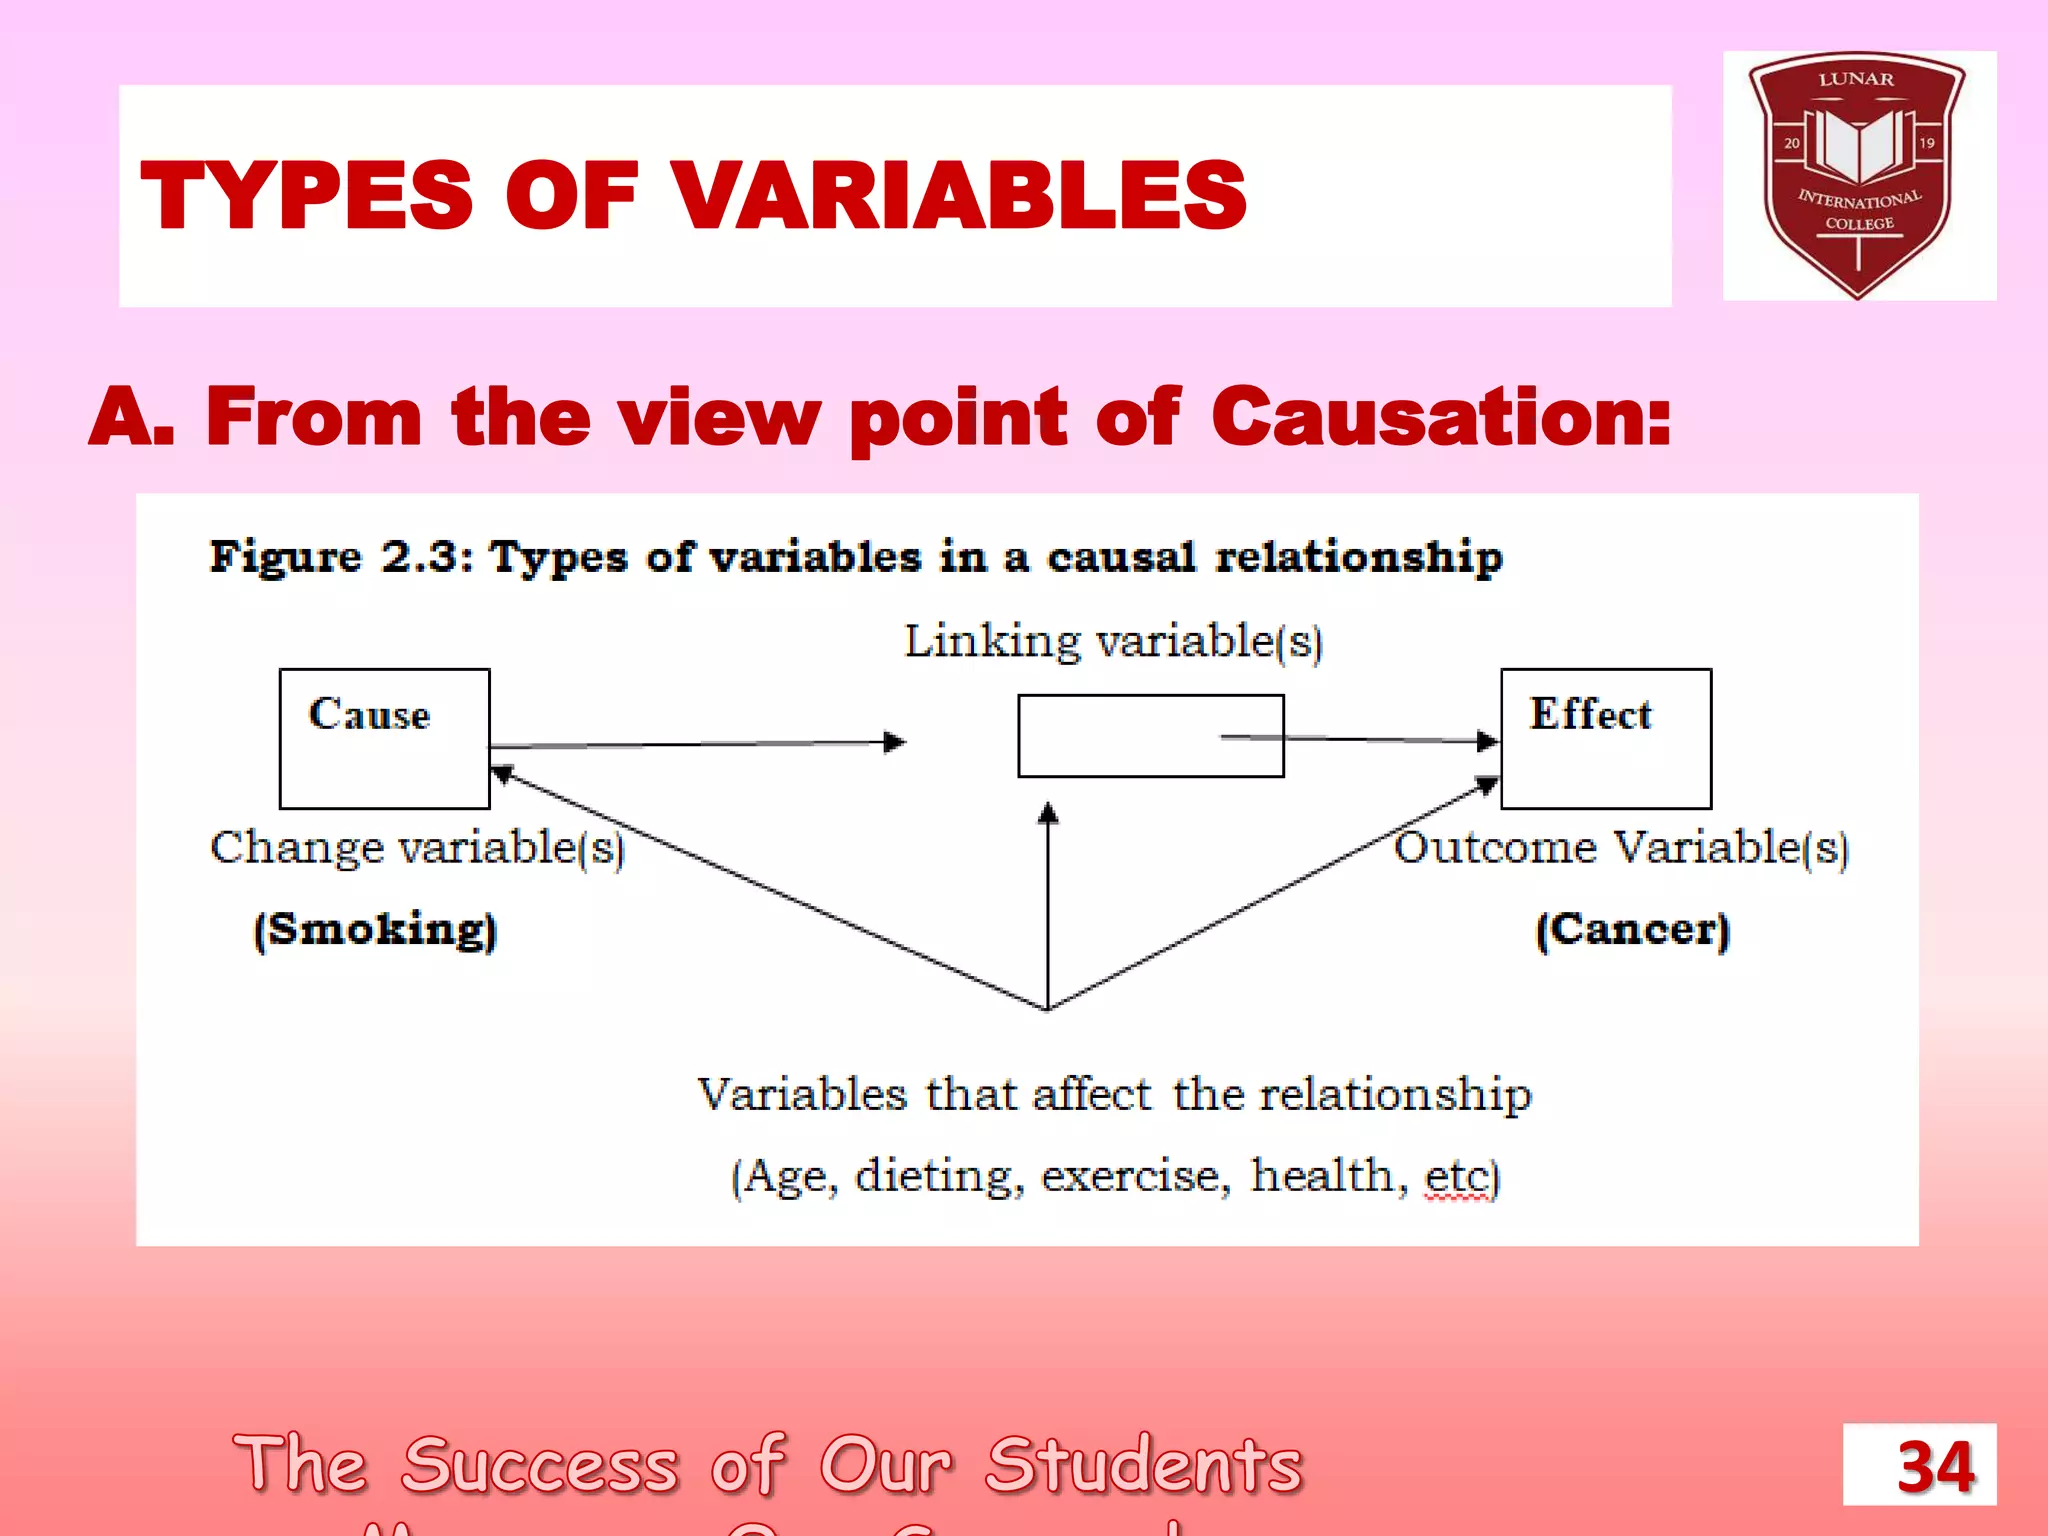
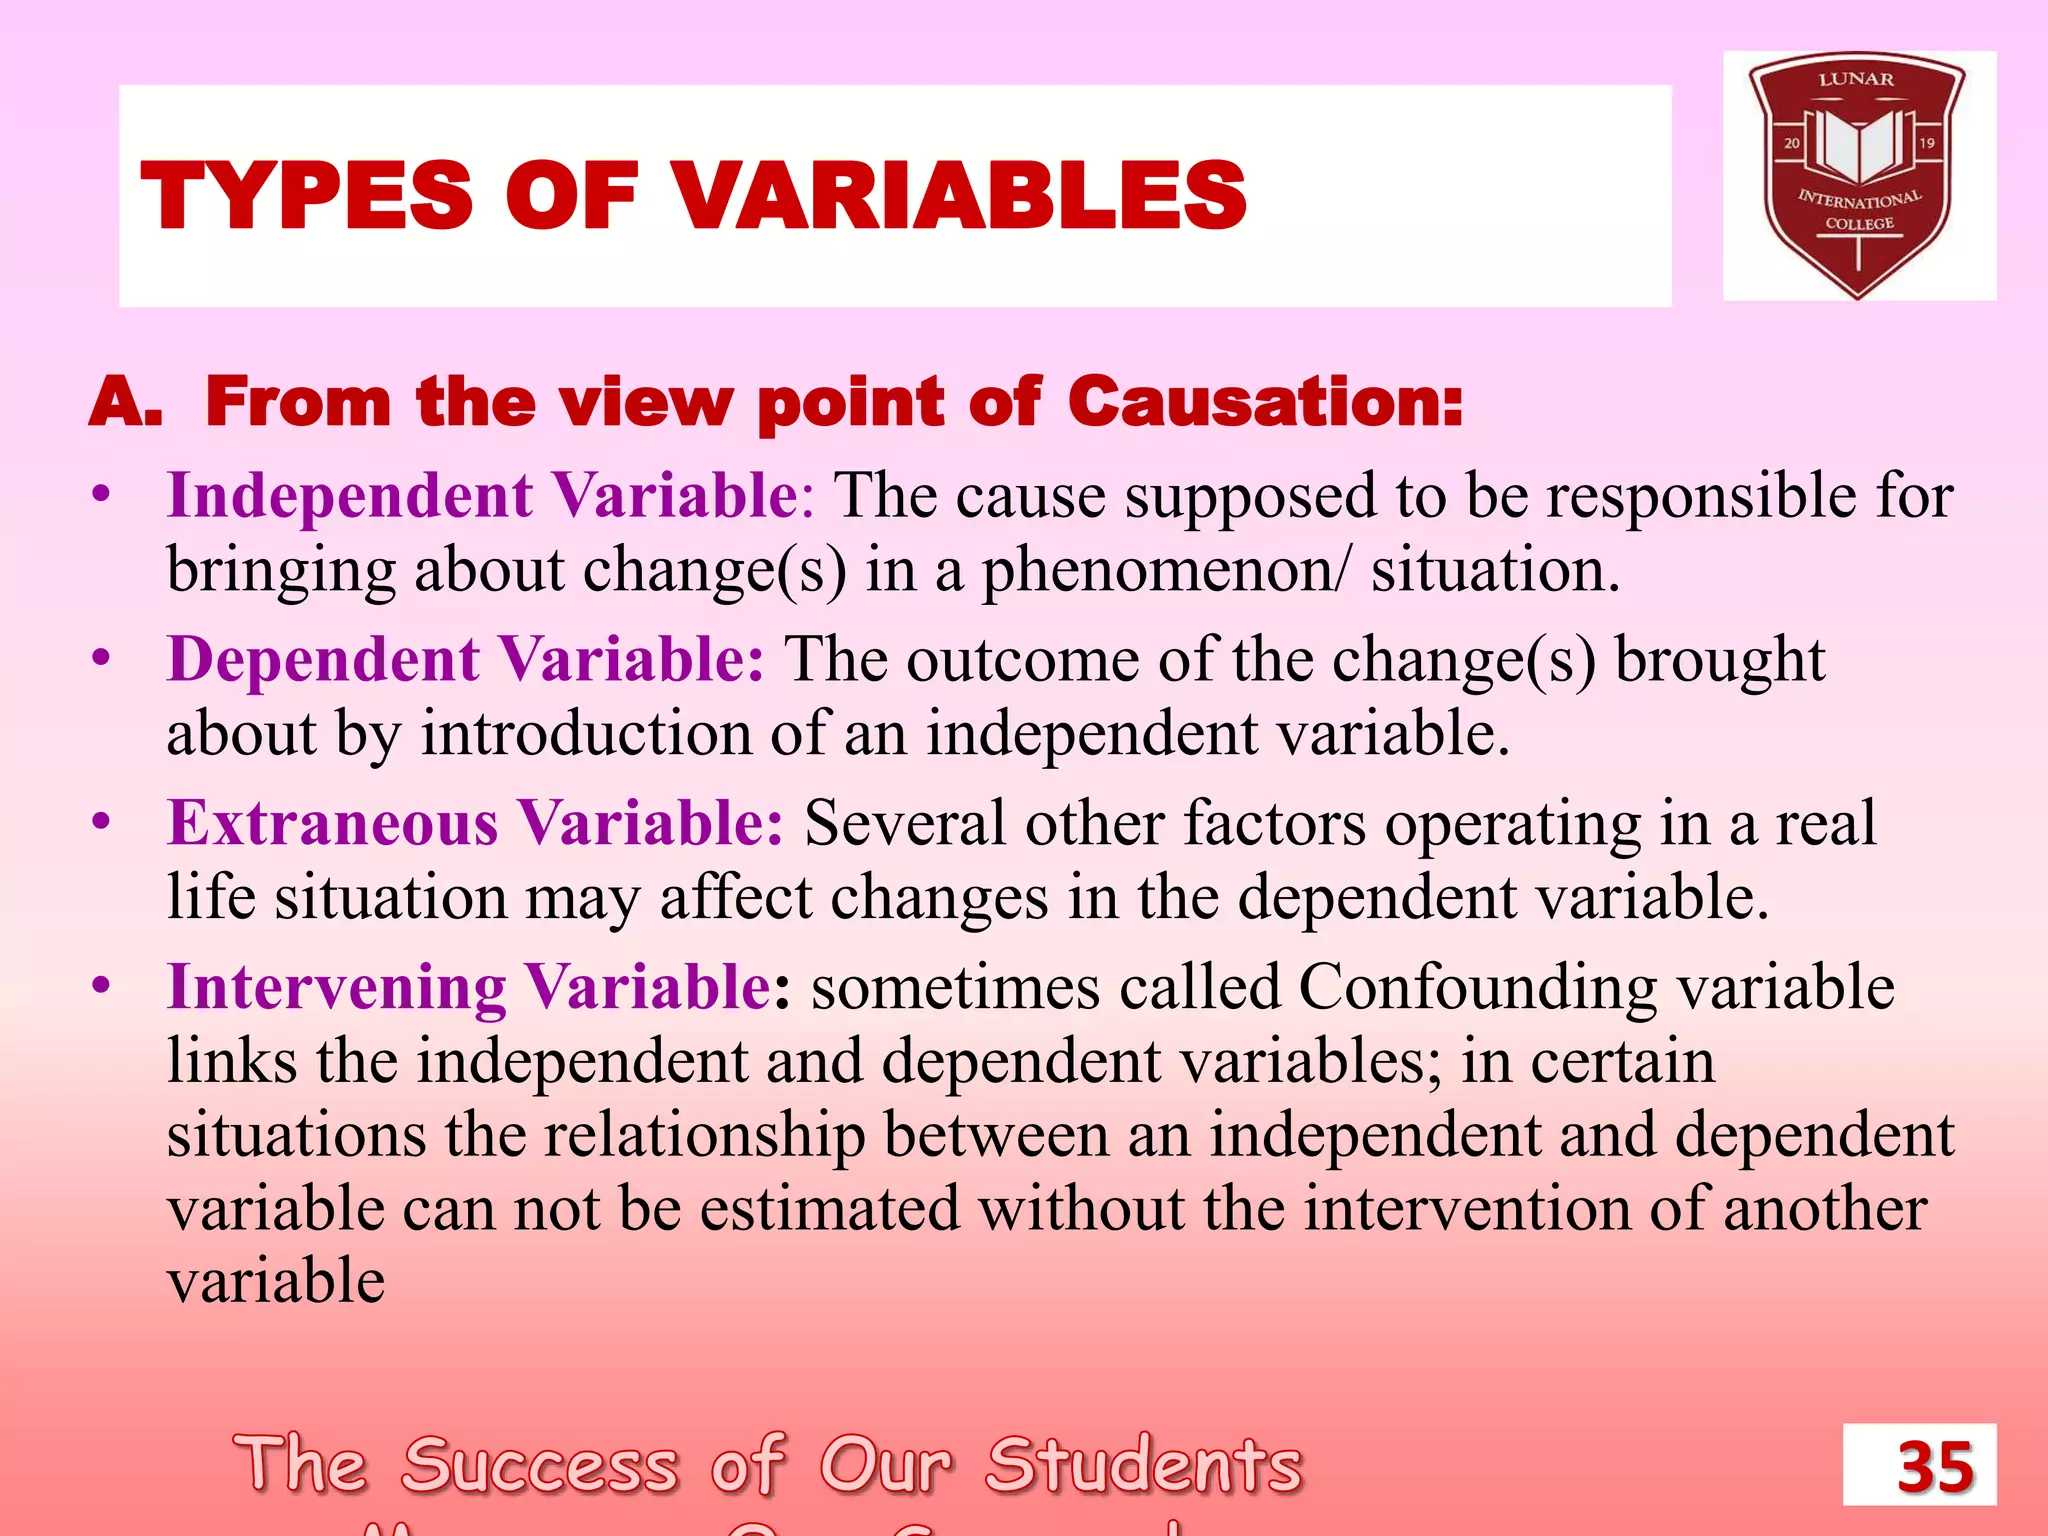
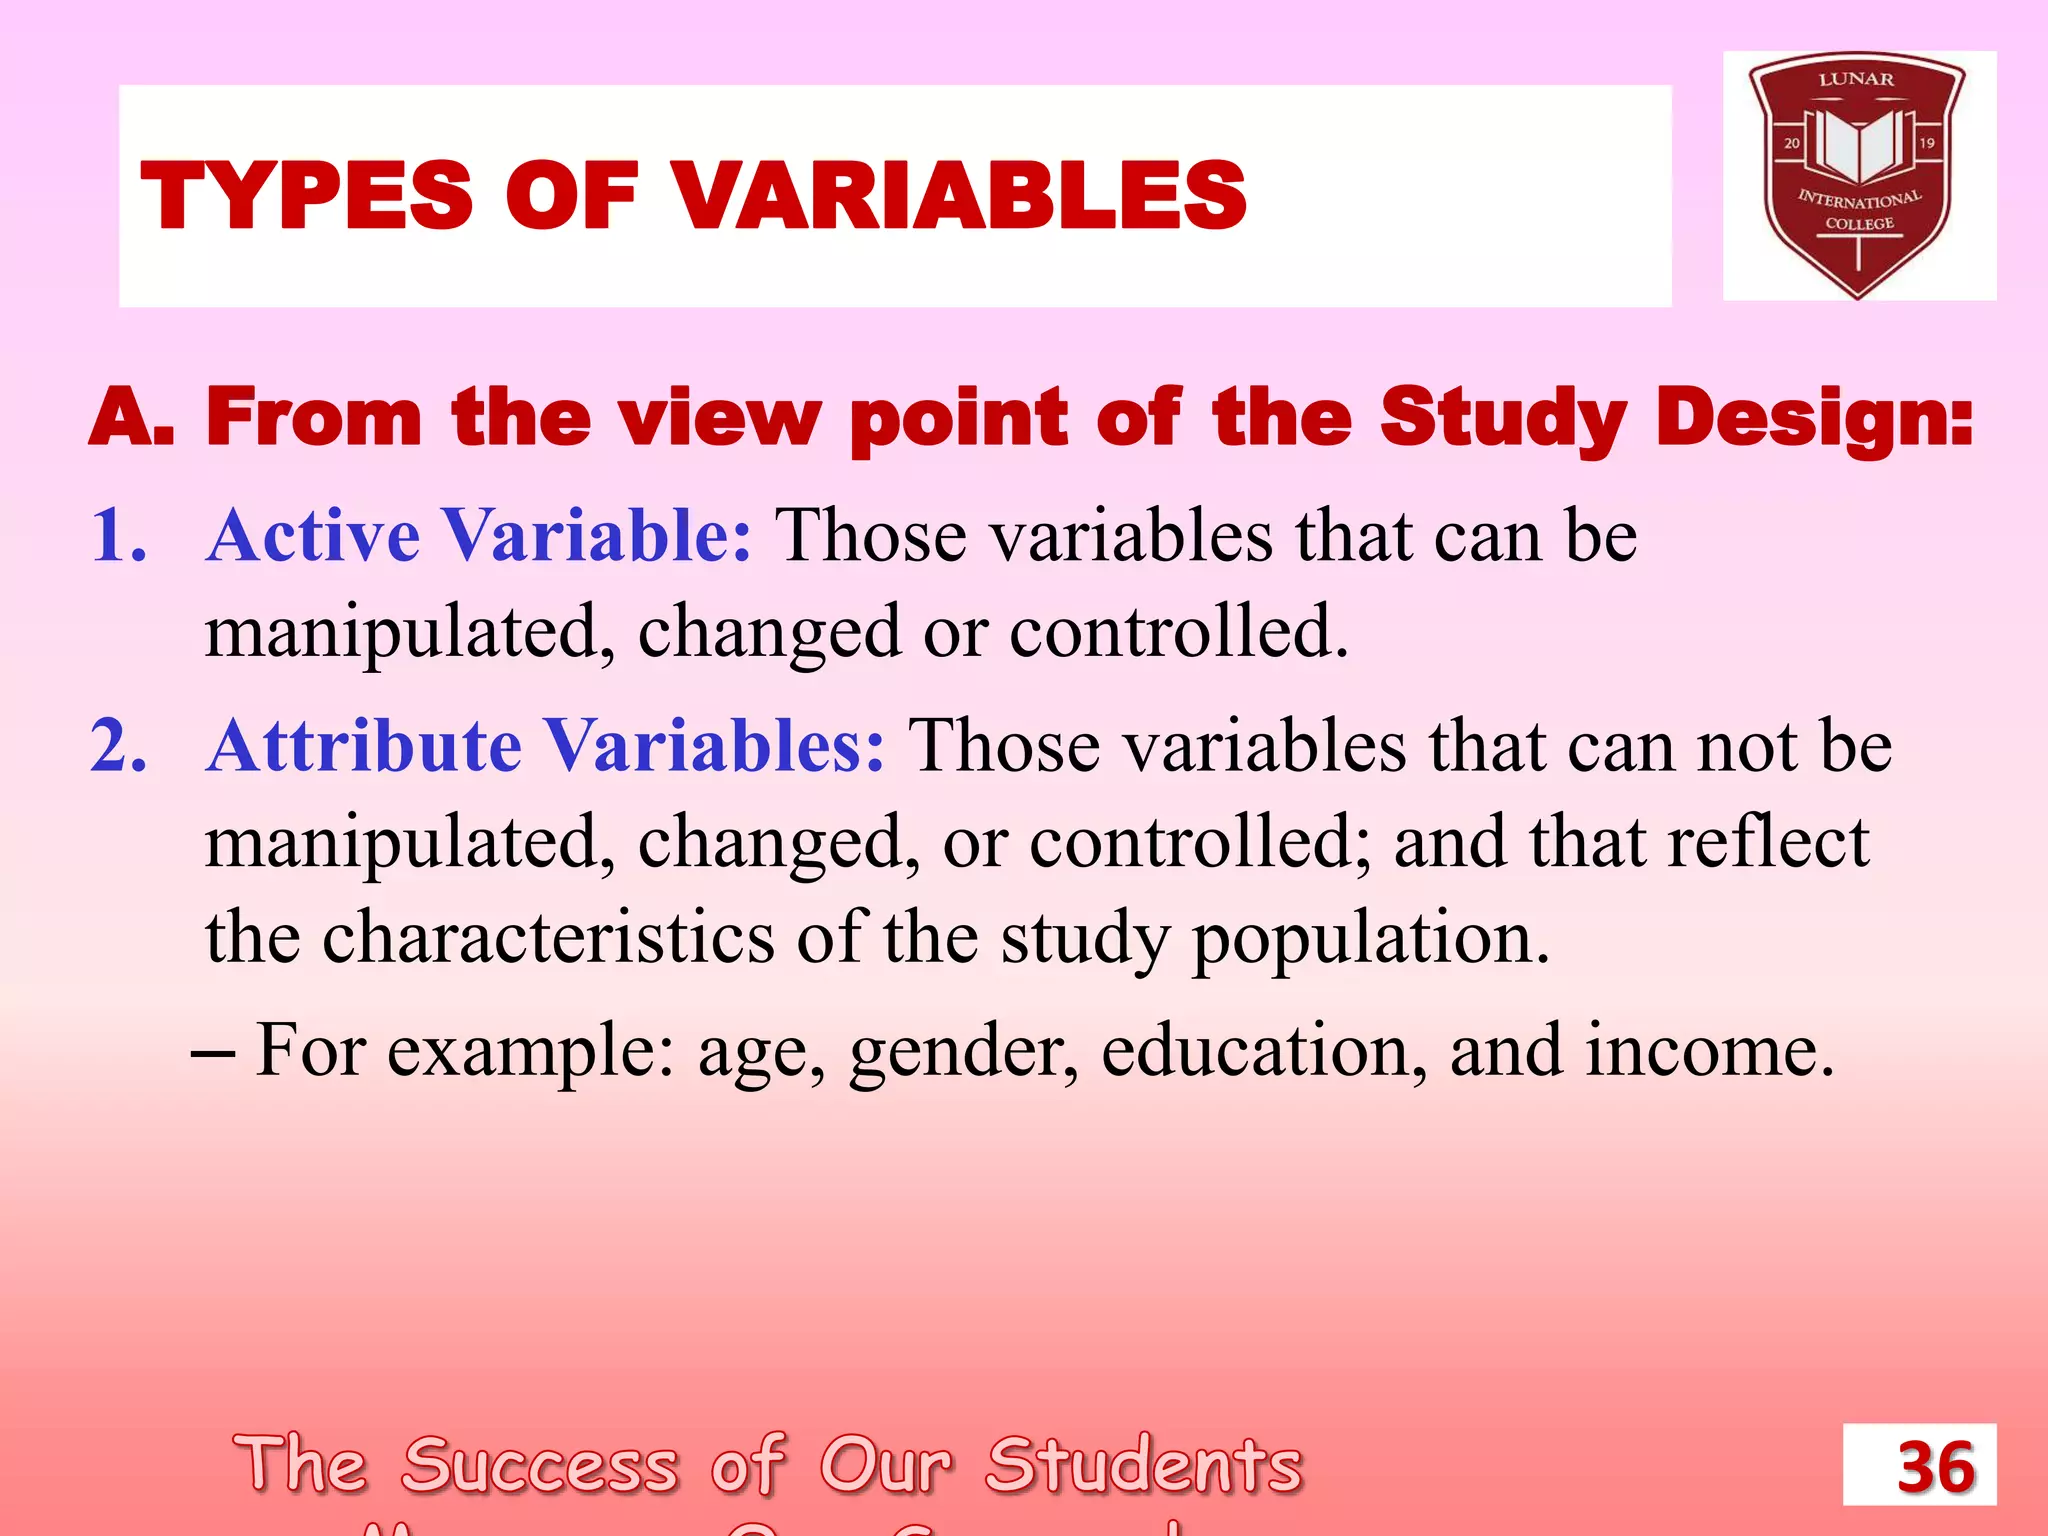
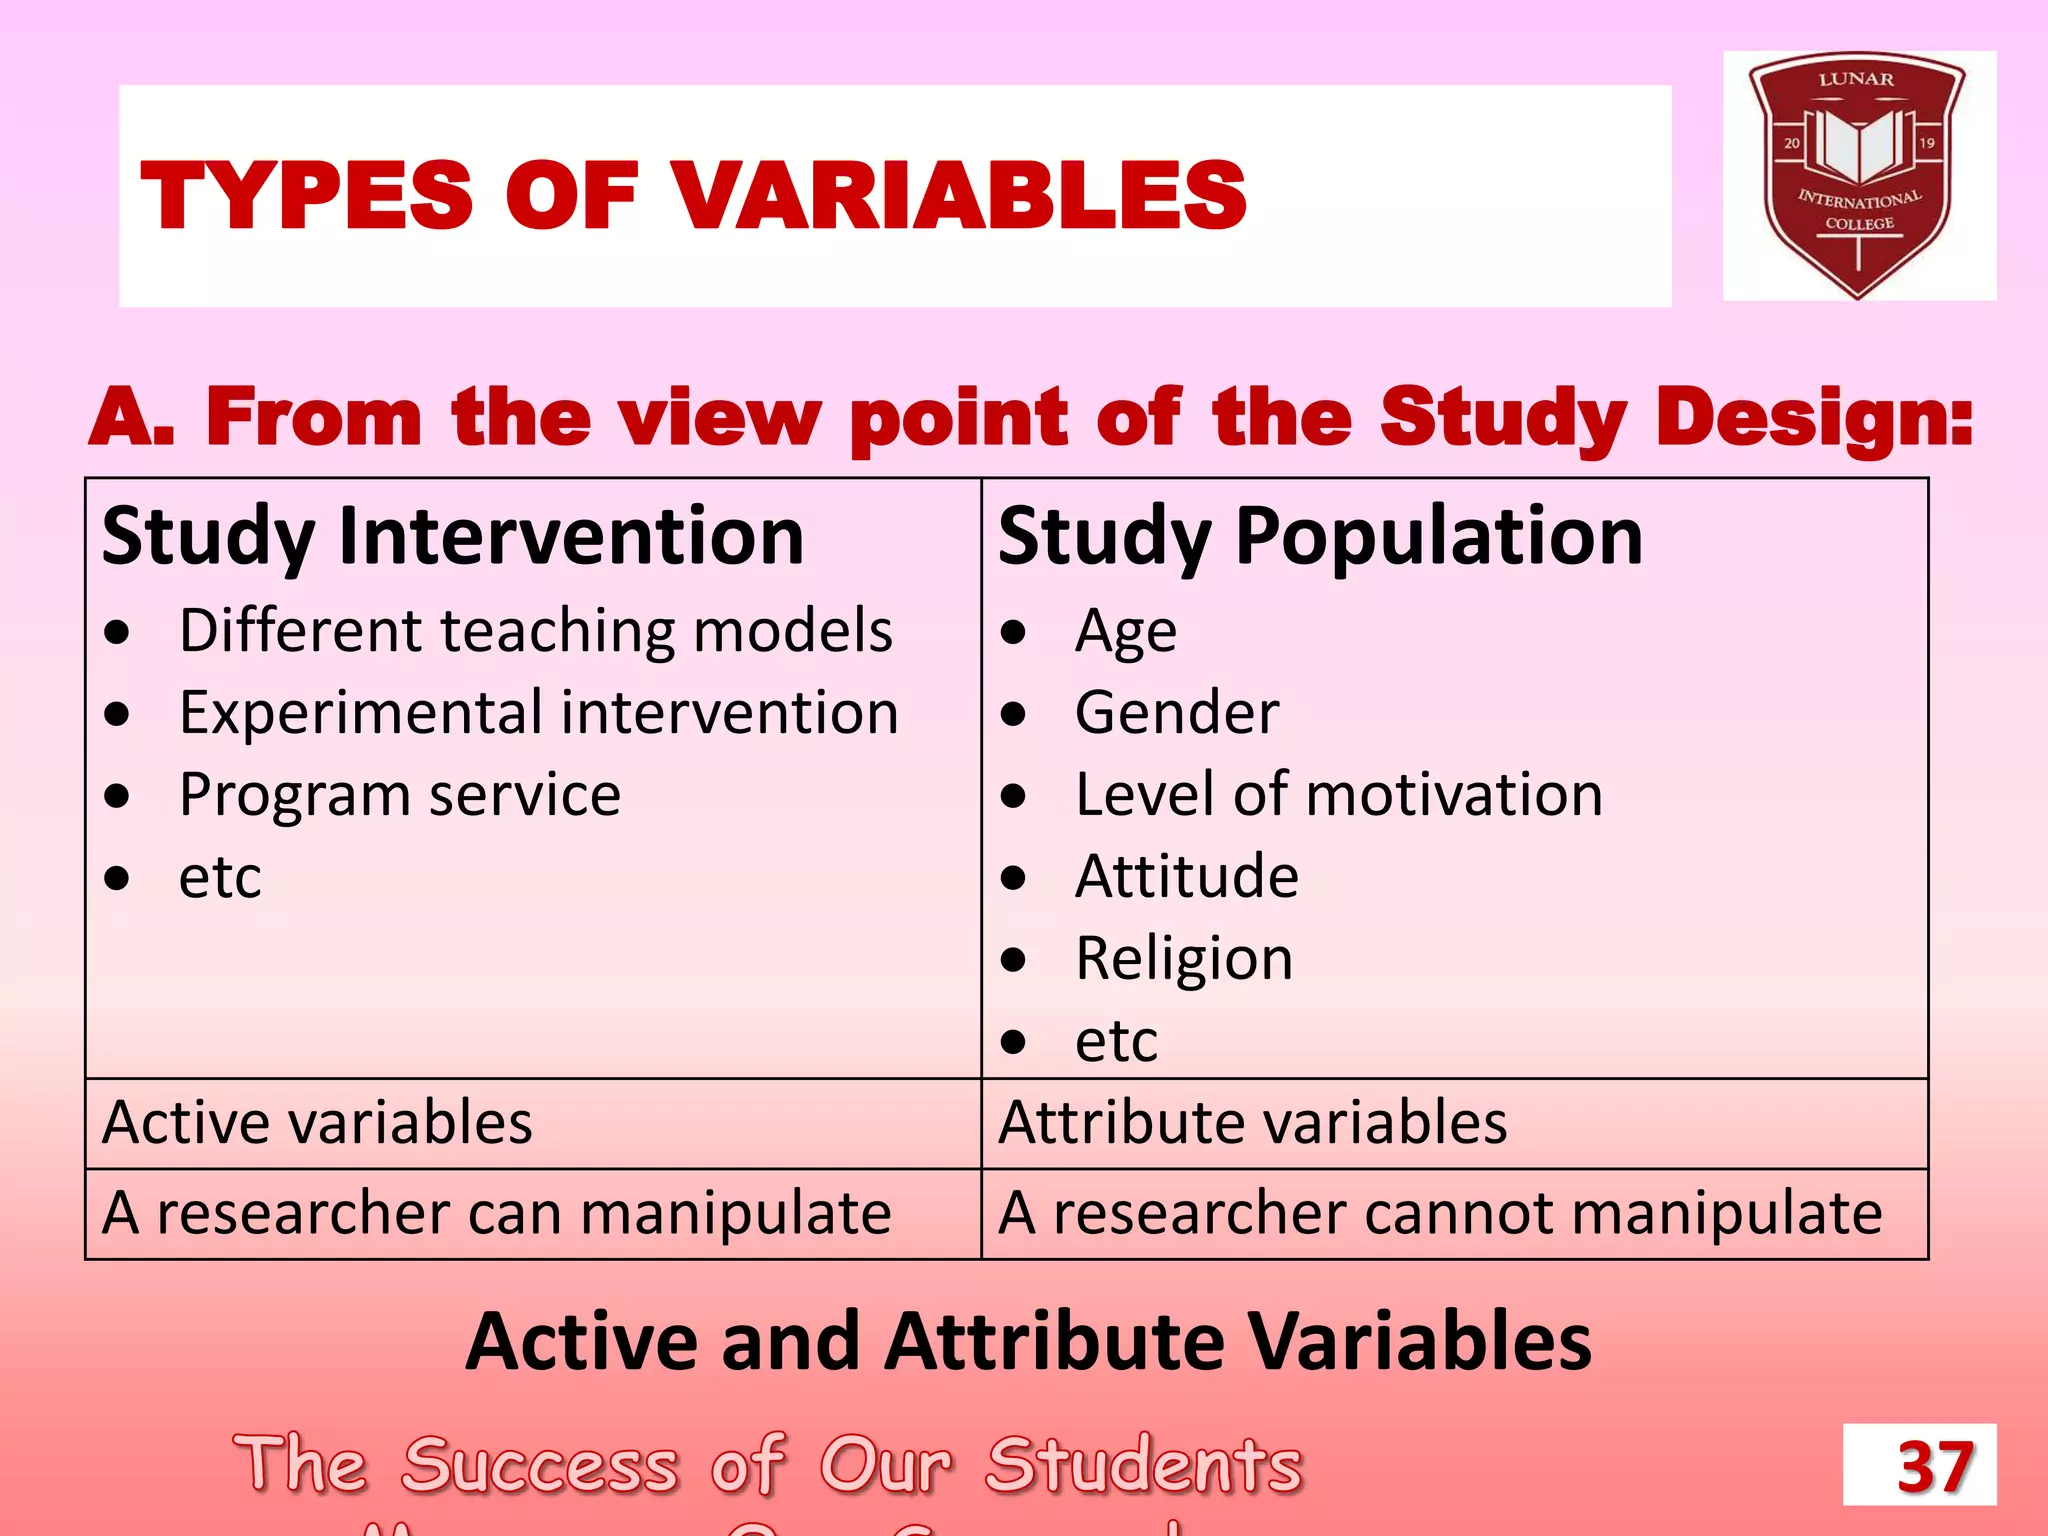
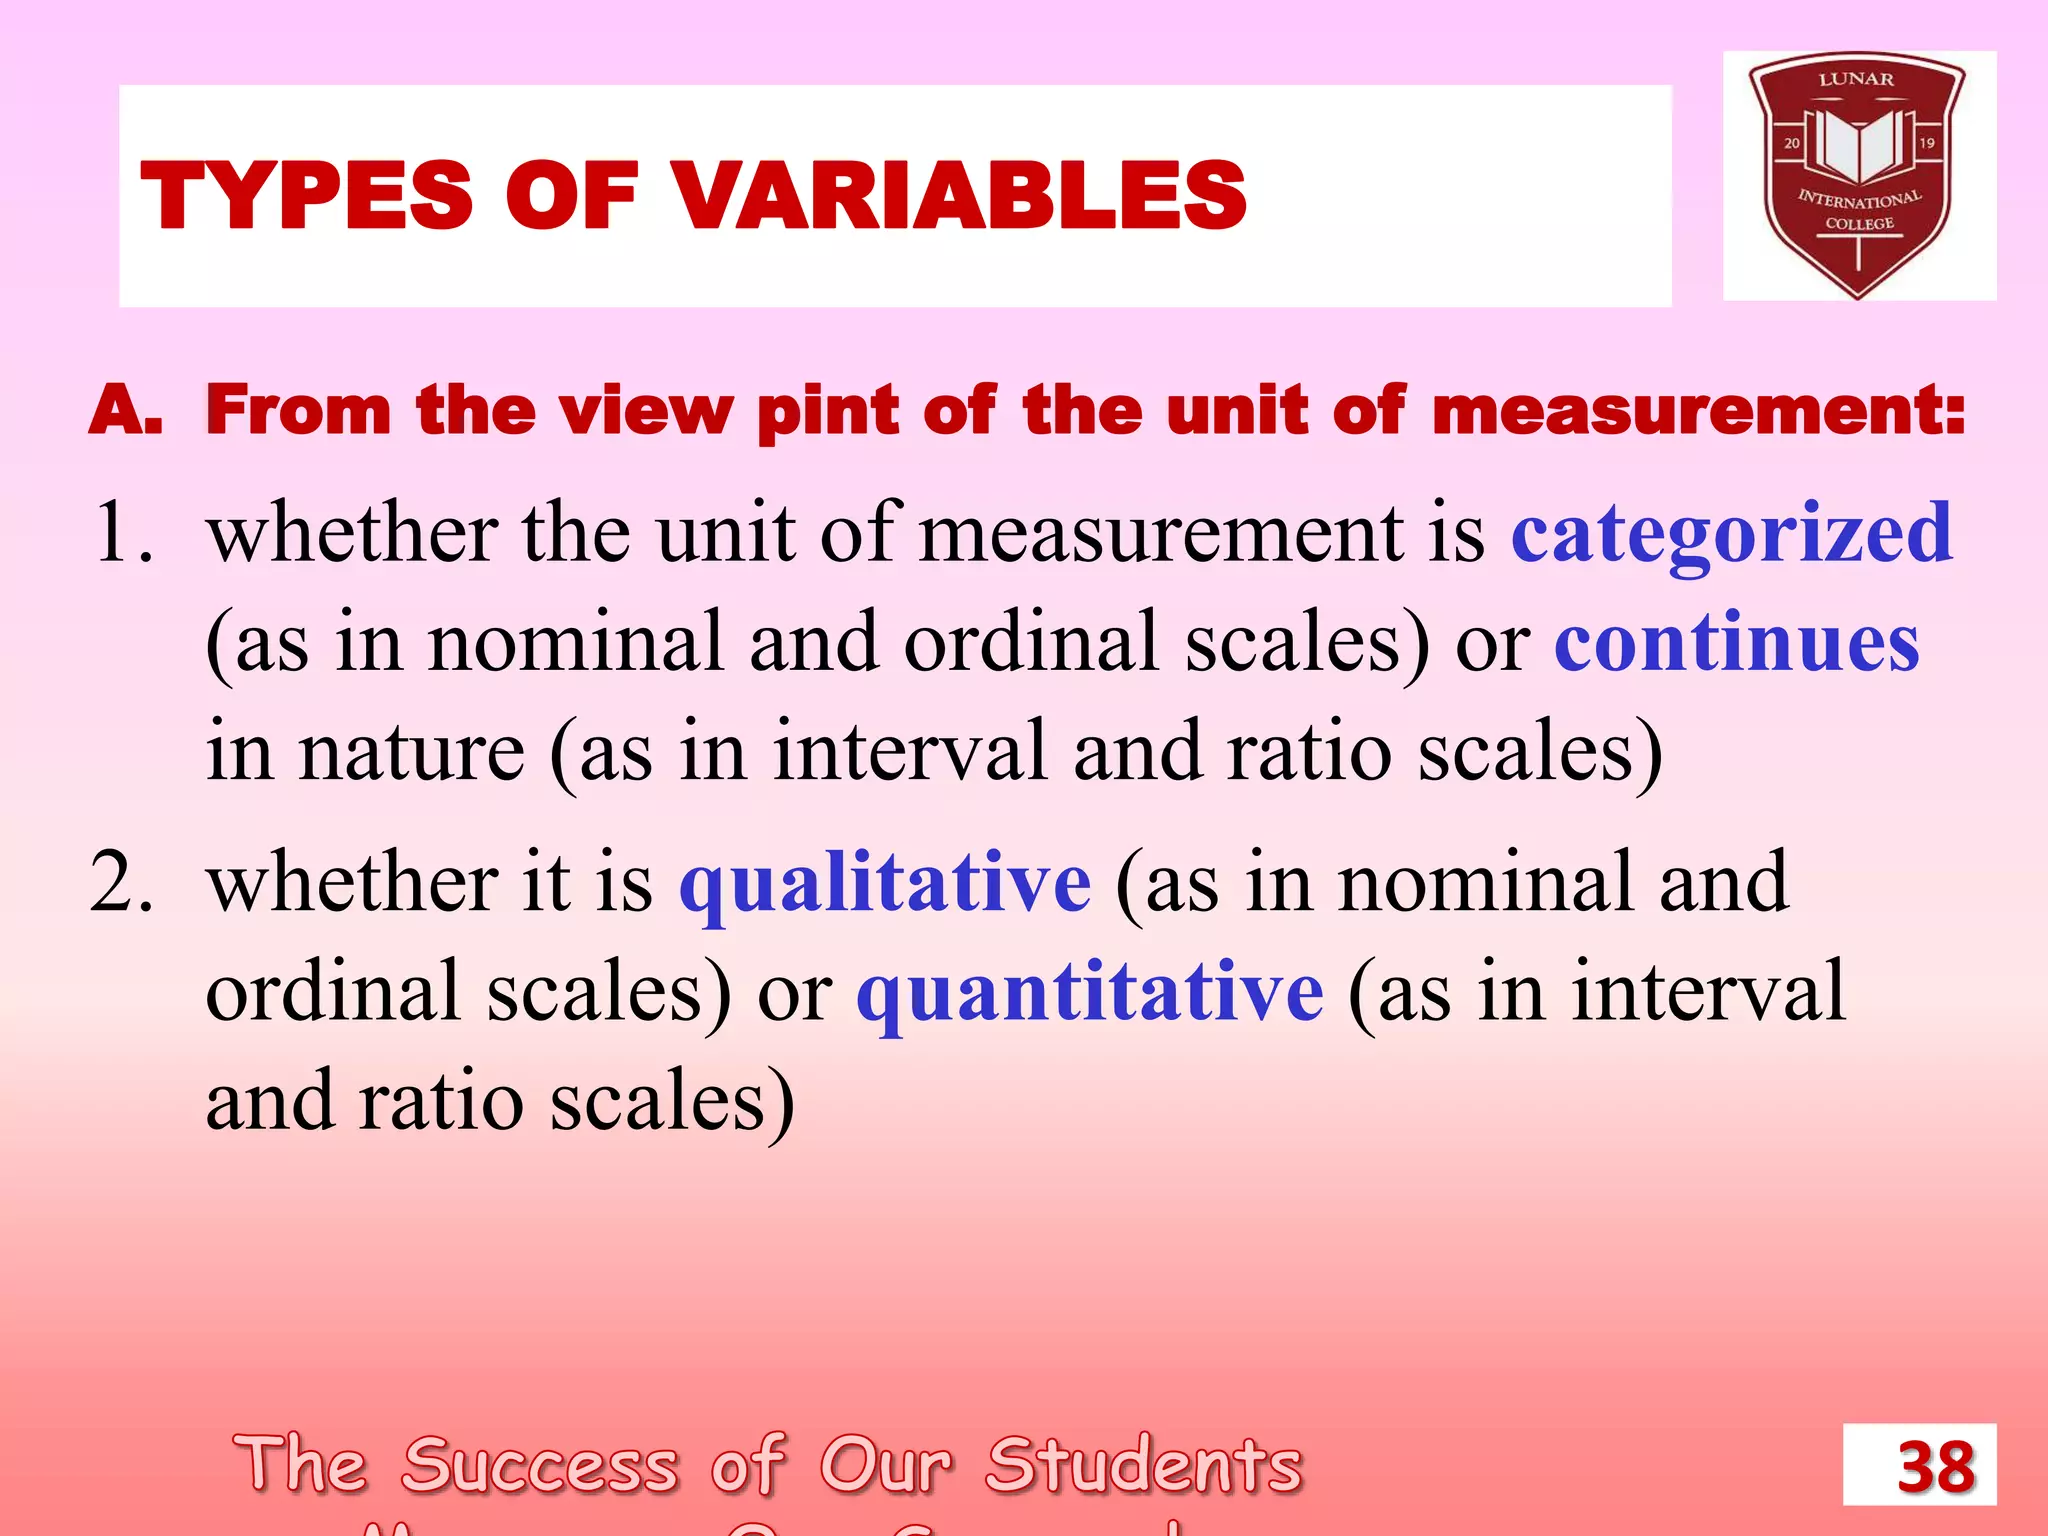
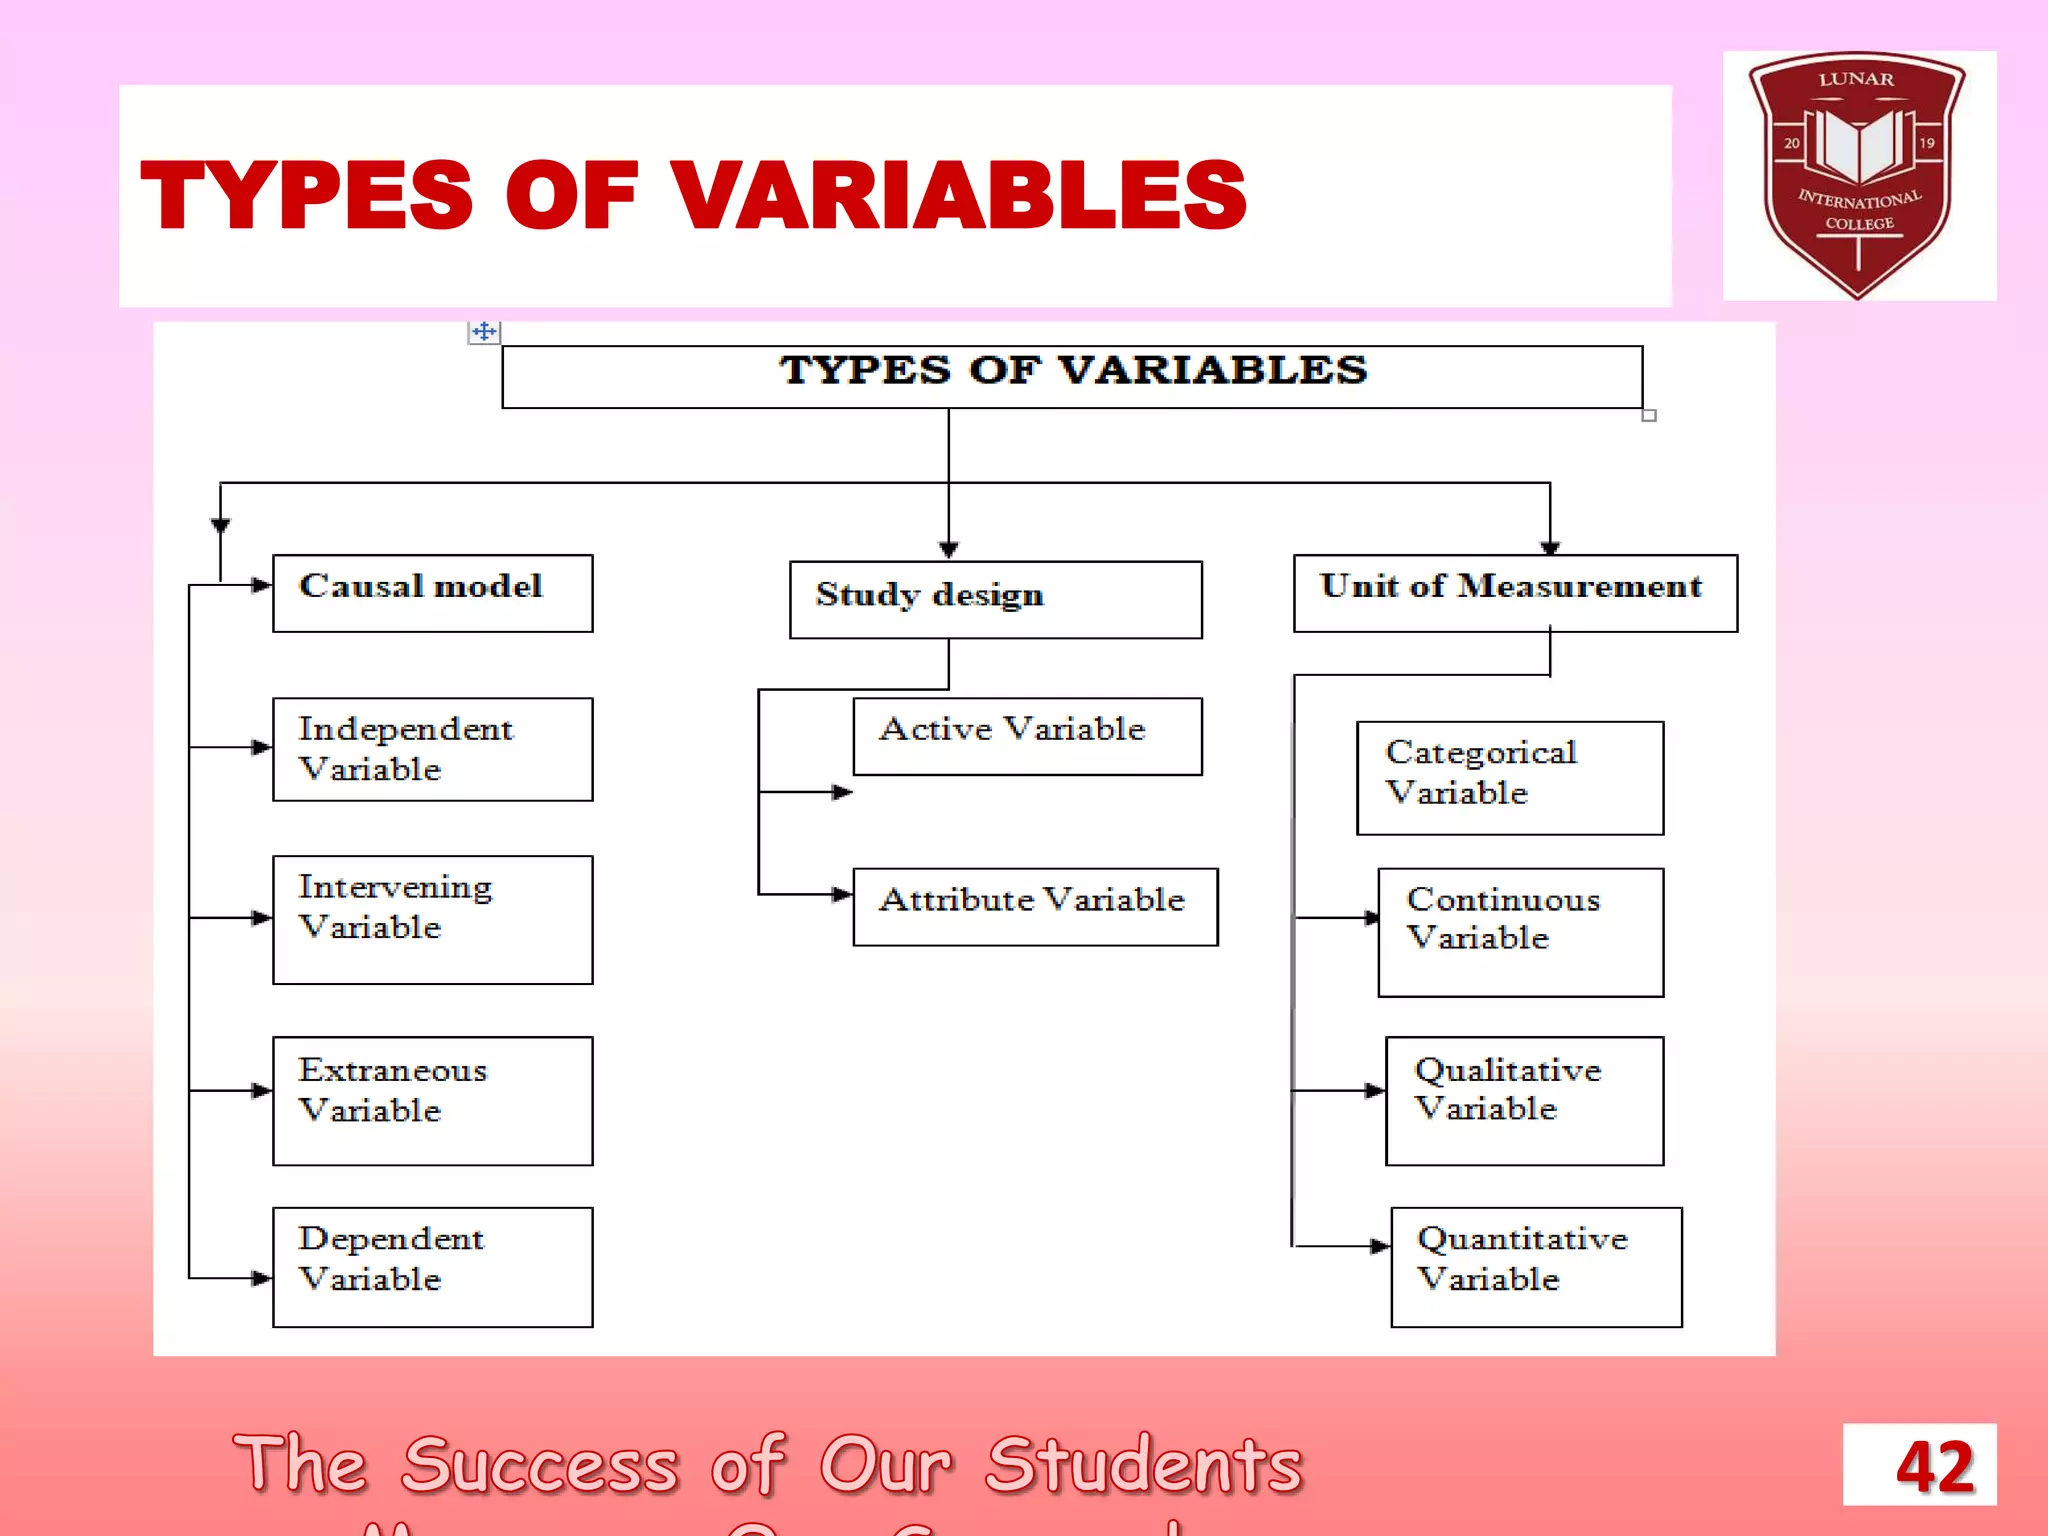
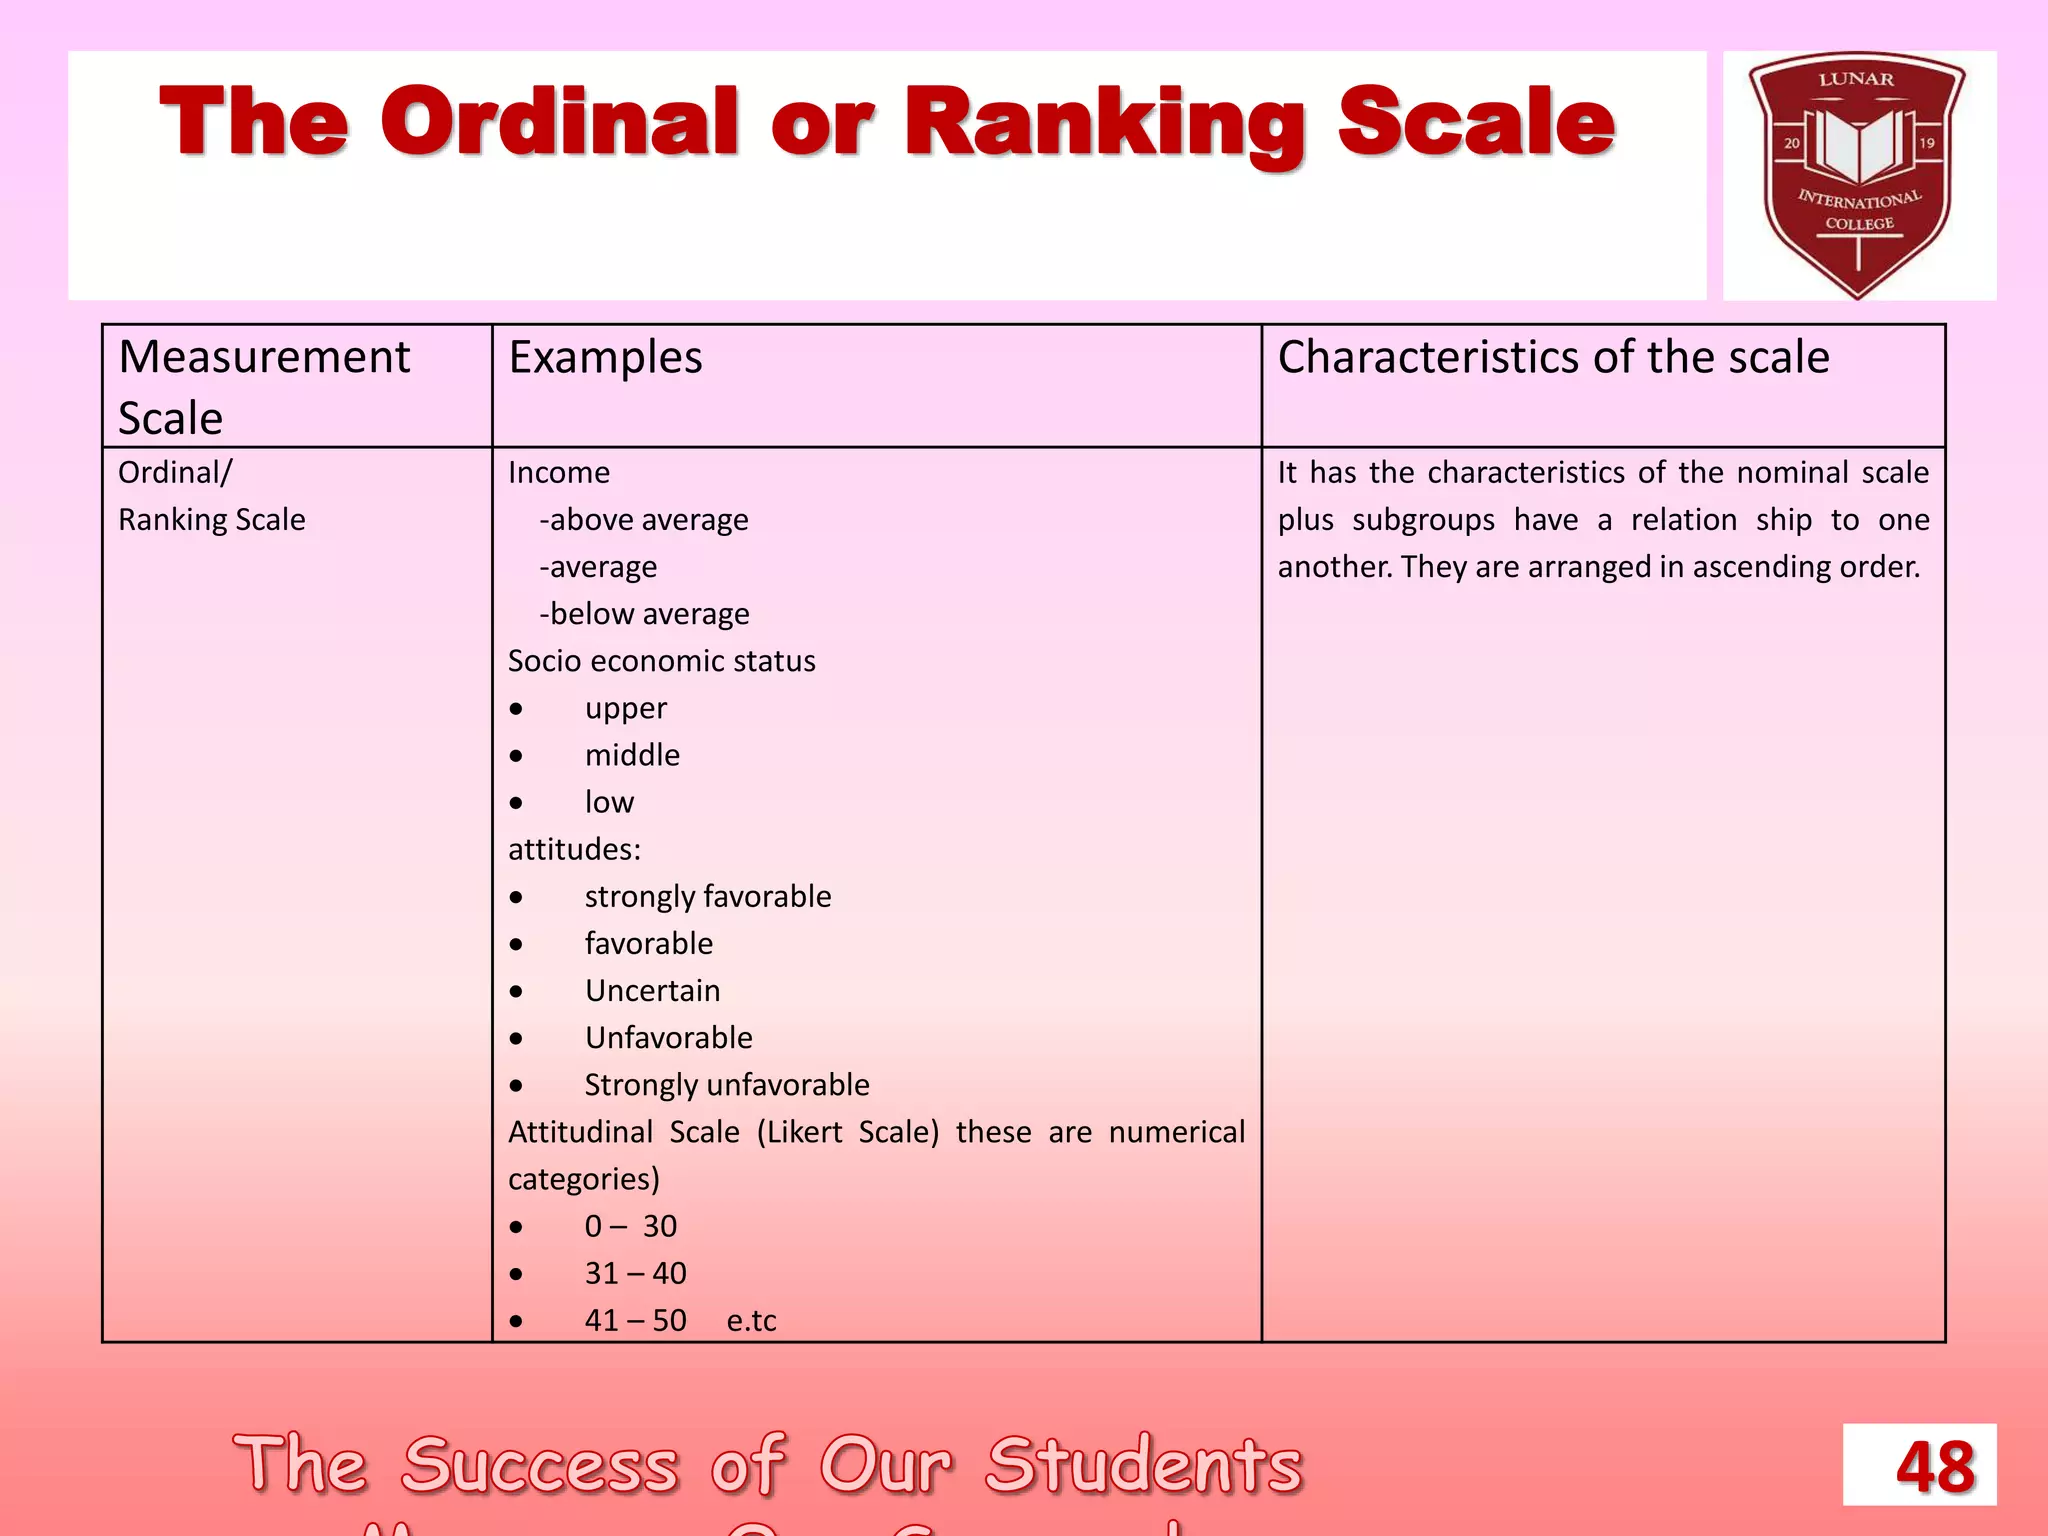
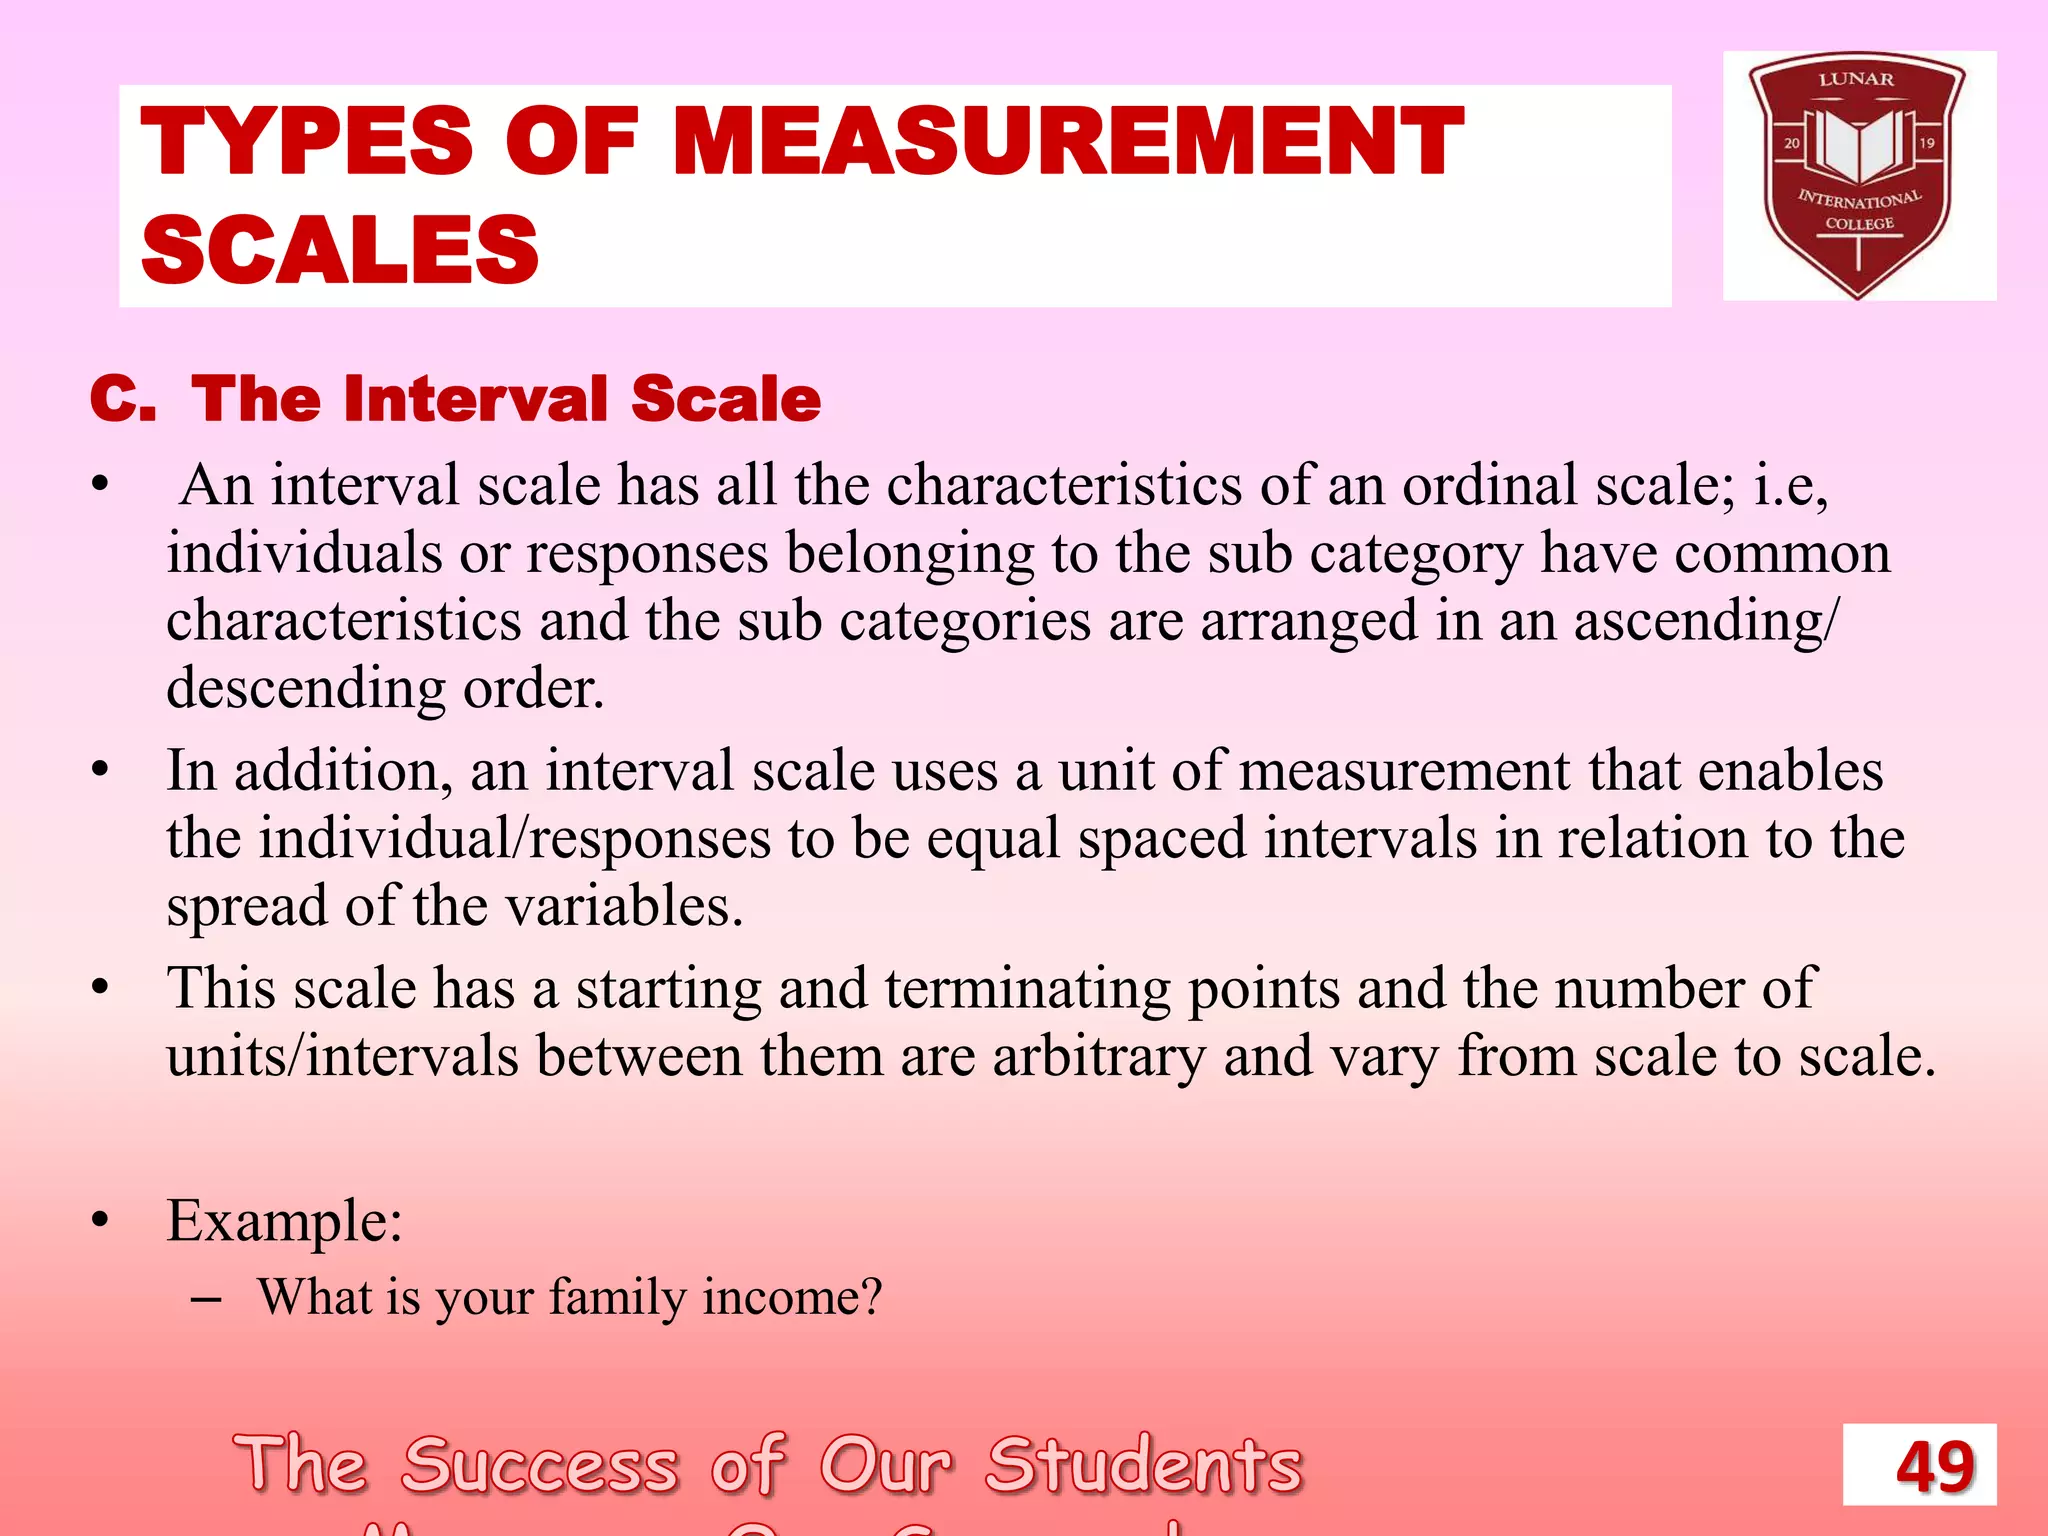
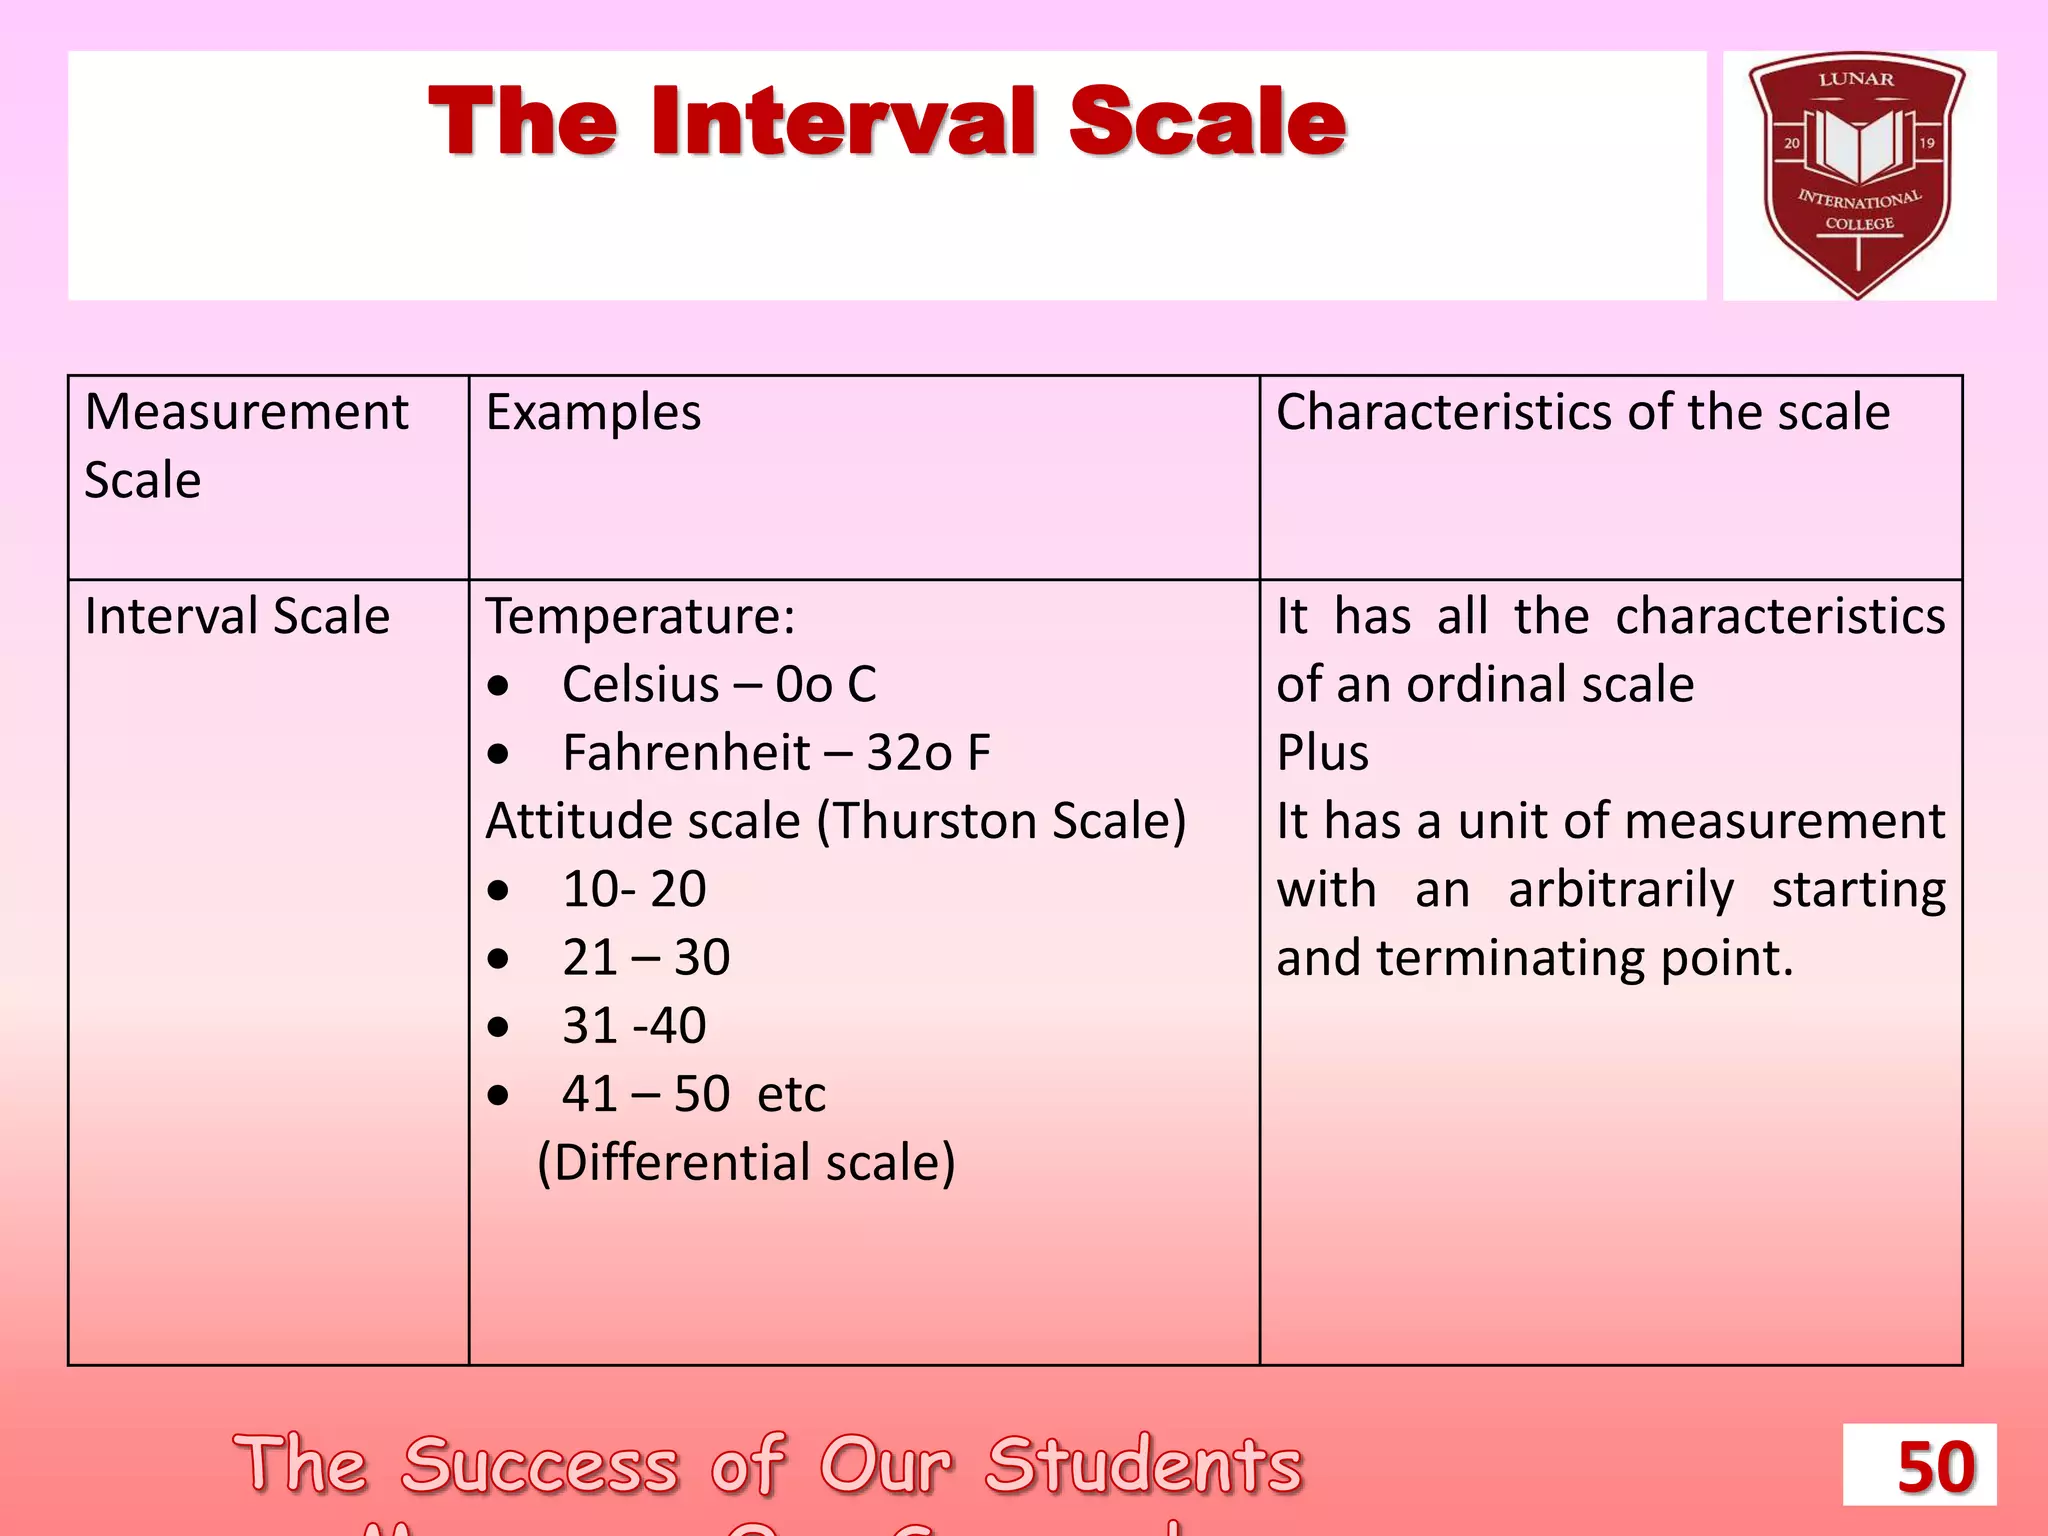
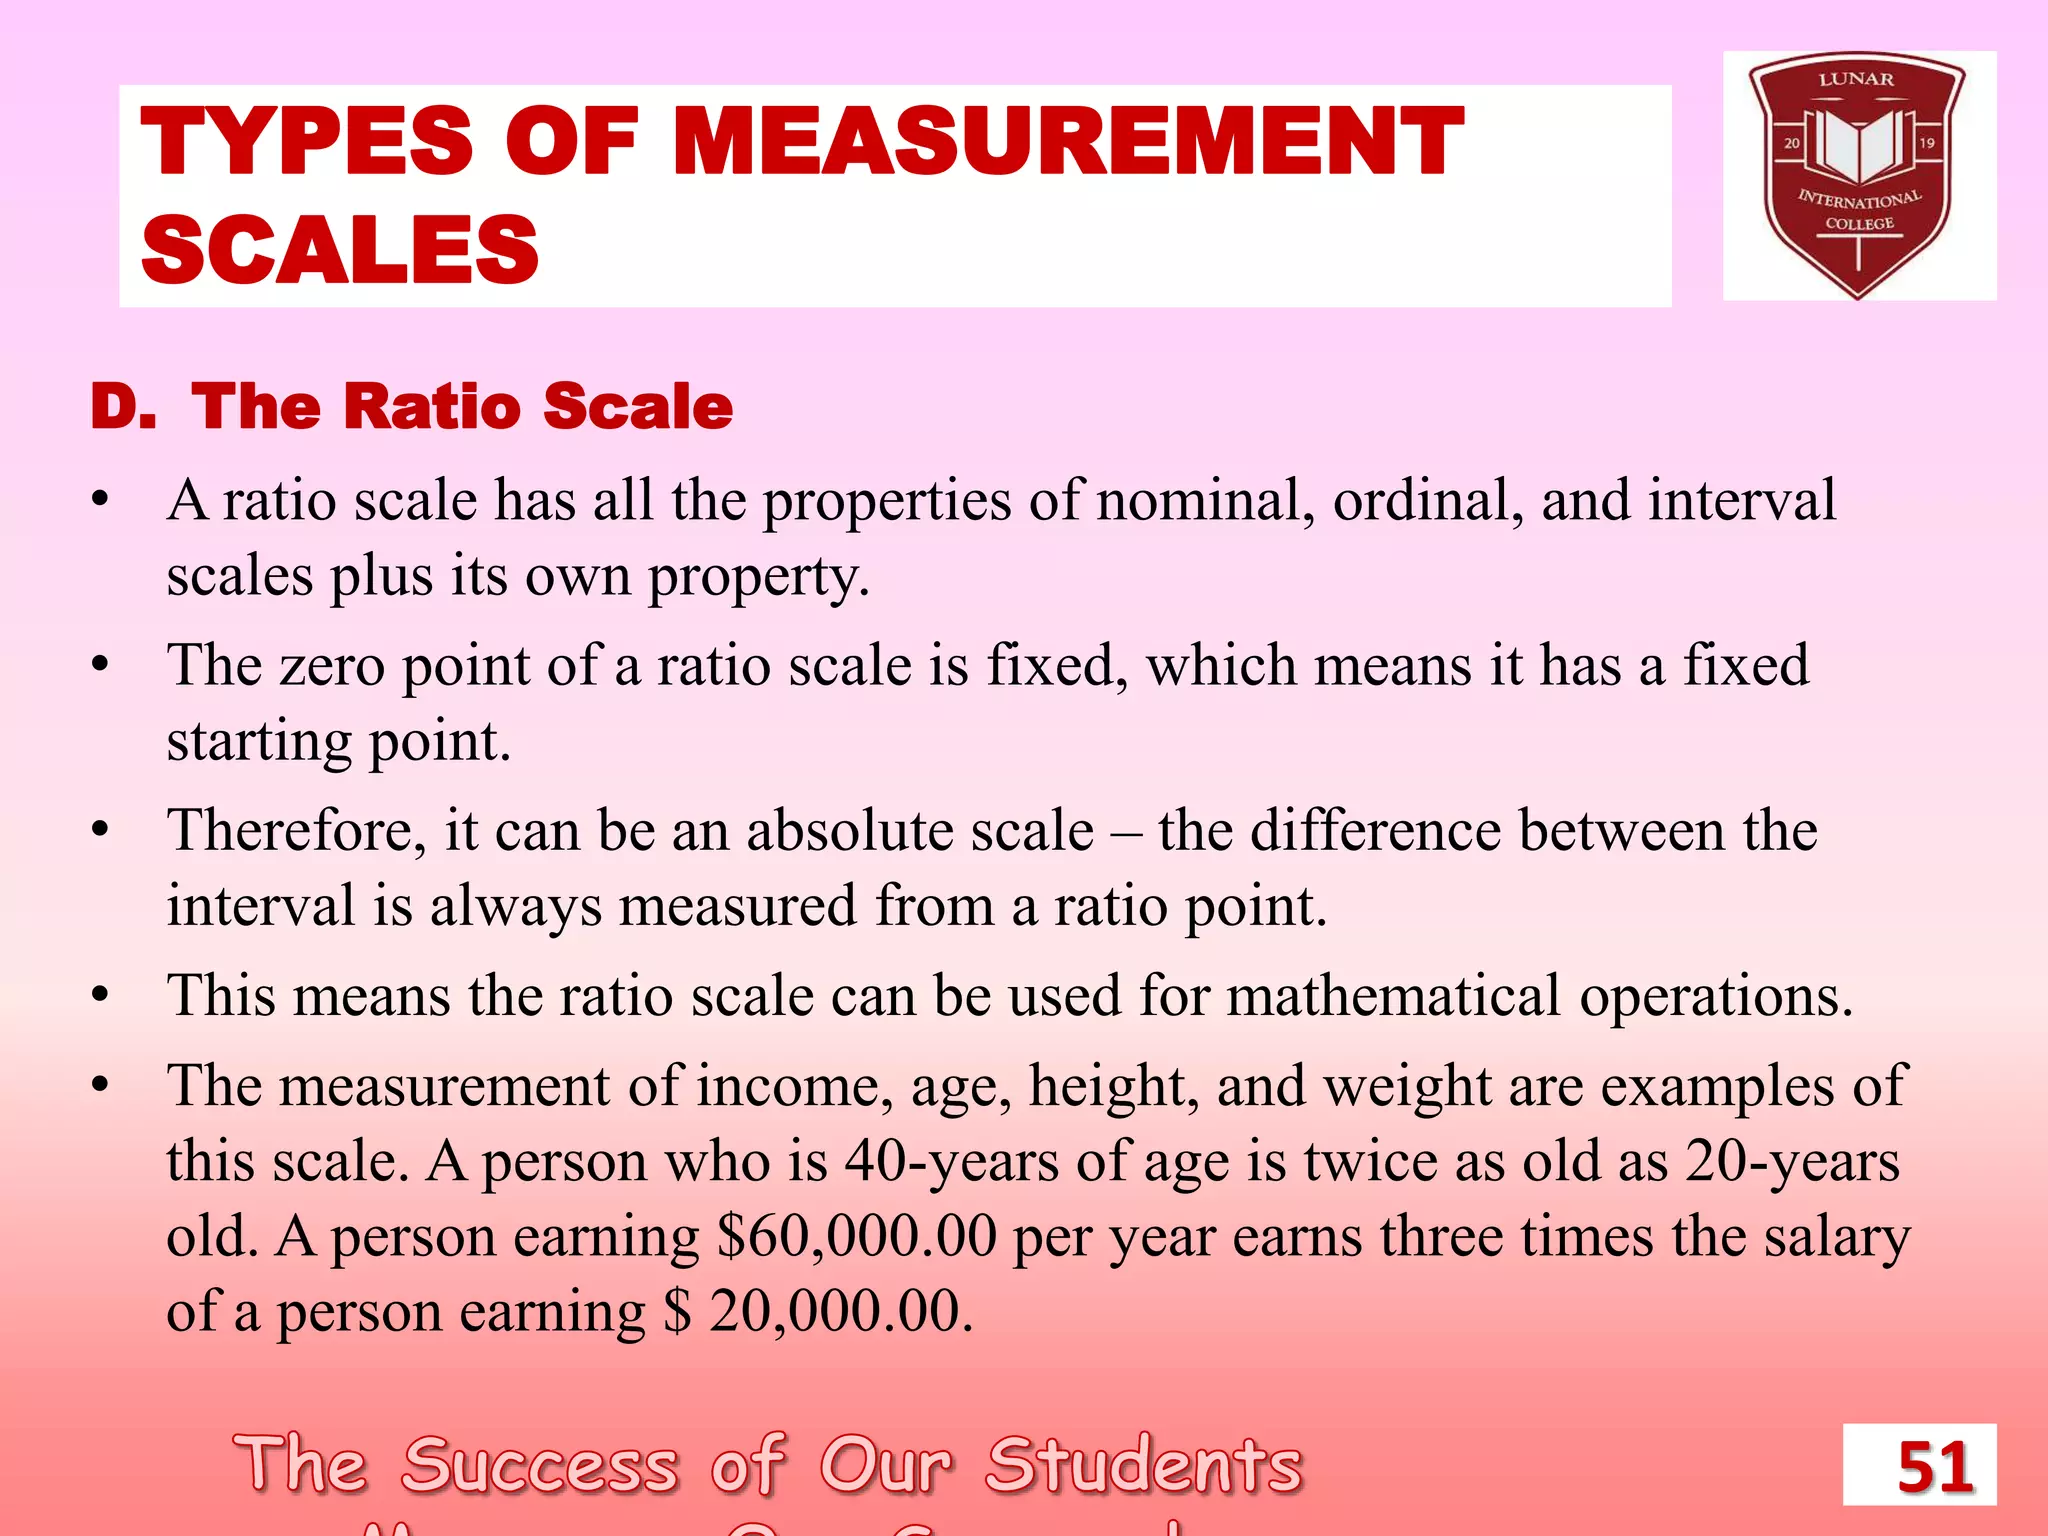
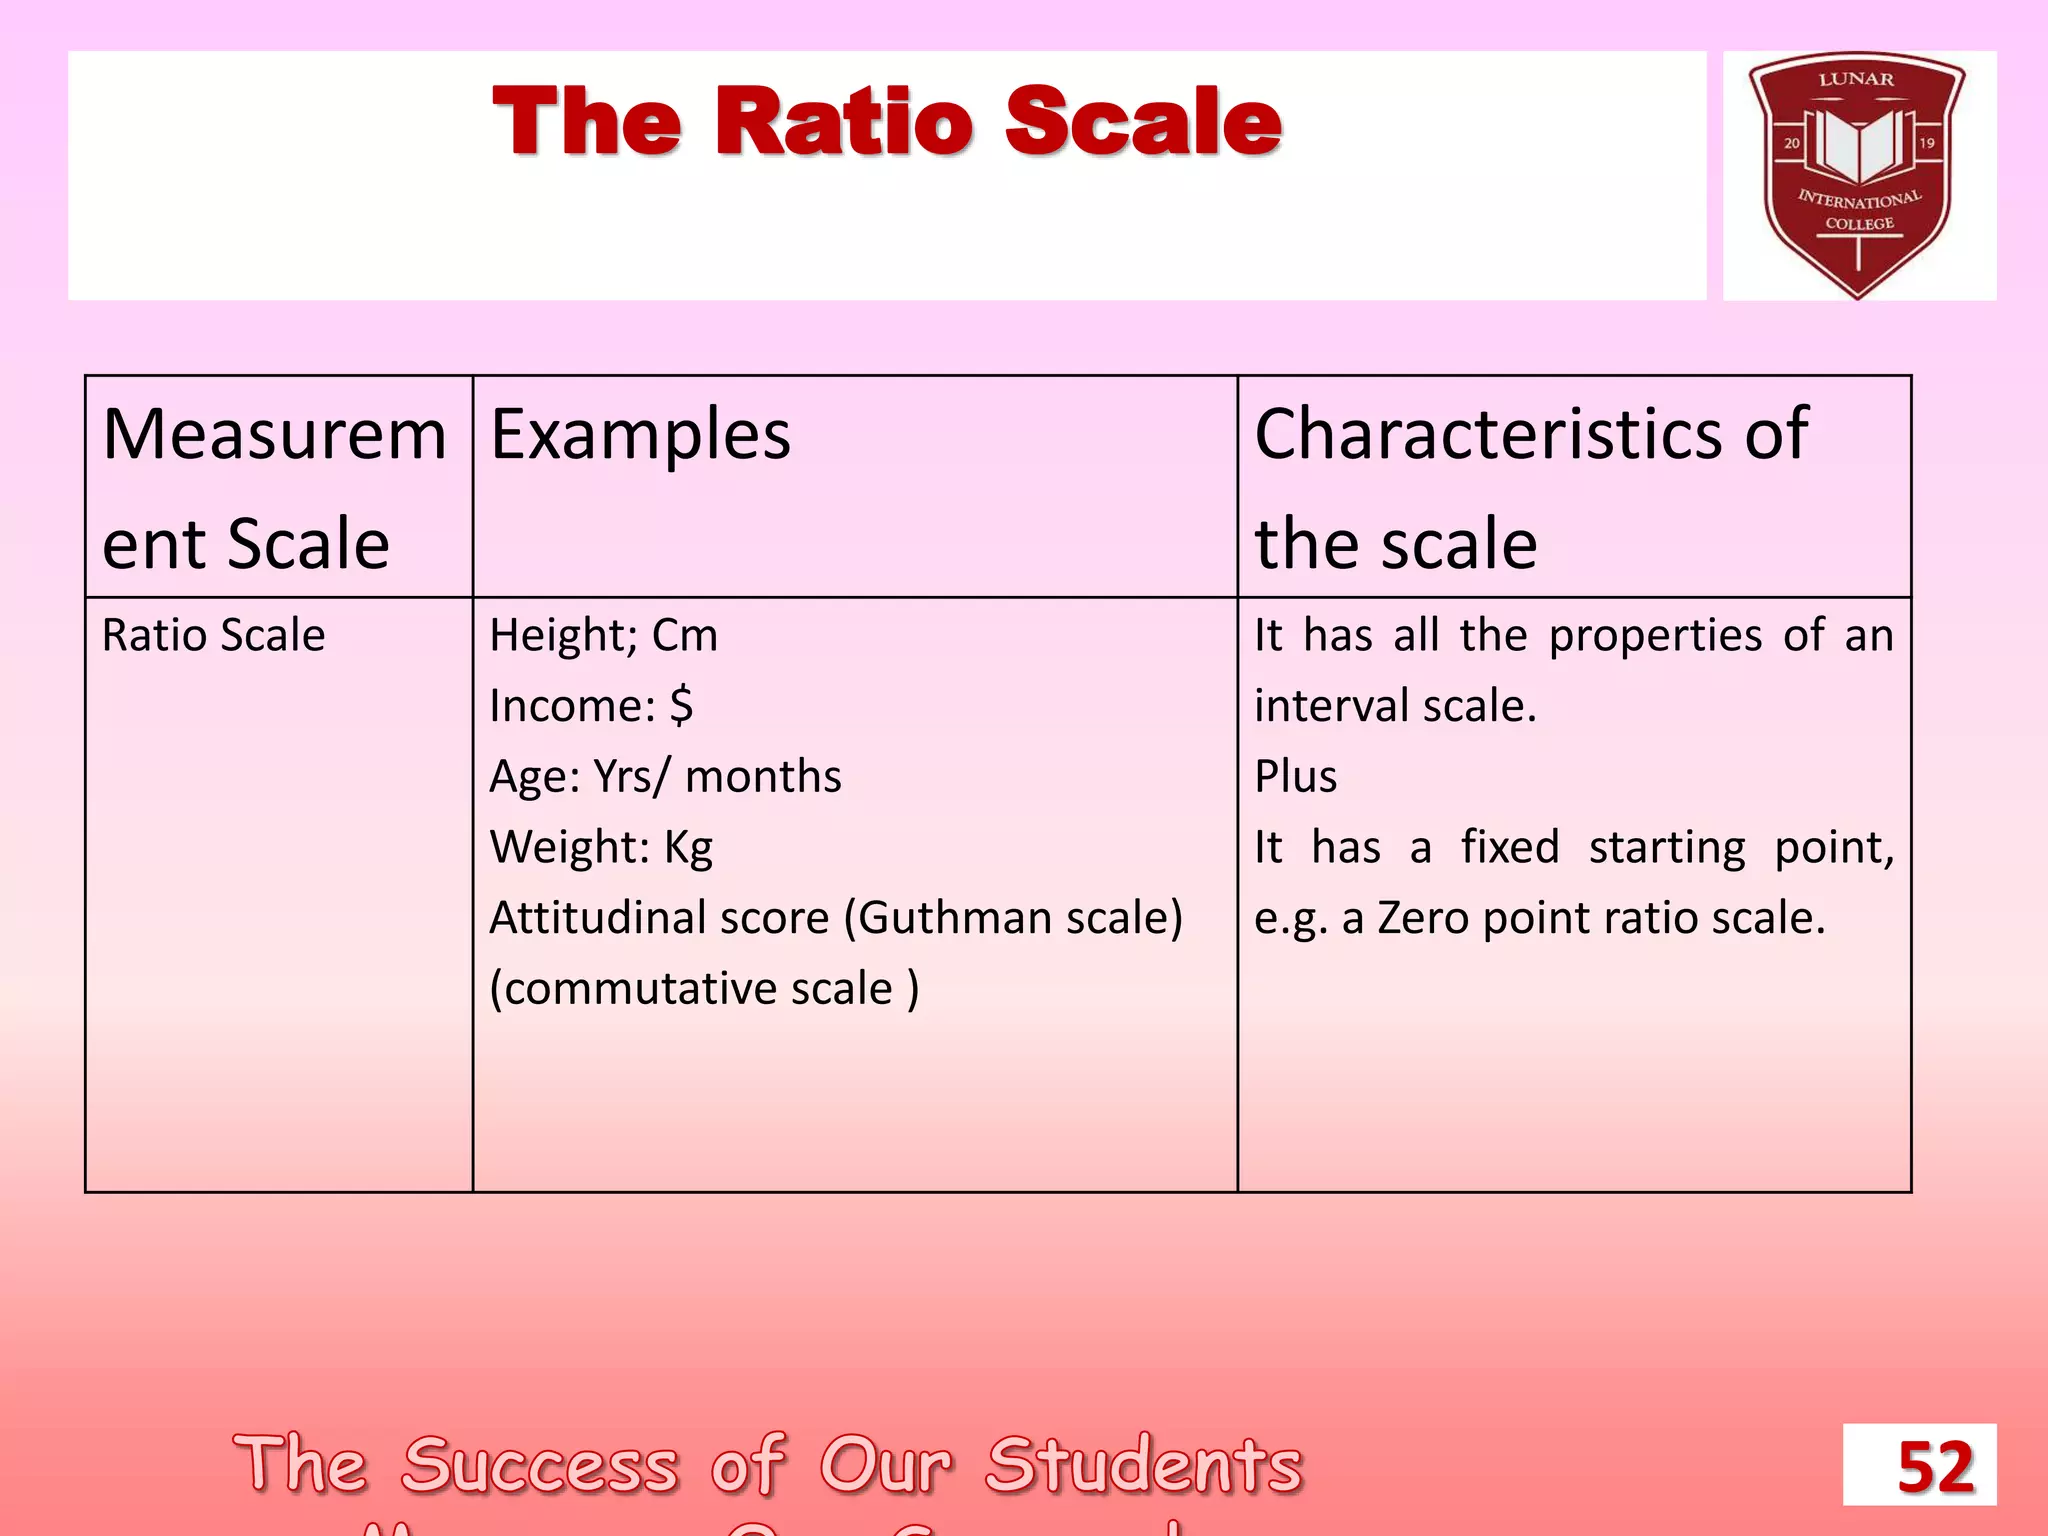
Chapter 2
Formulating Research Problem
1
What is a Research Problem?
• Any question that you want to answer or any
assumption or statement that you want to challenge or
investigate or examine can become a research problem.
1. Questions to answer:
a. Is there any relationship between
decentralization and productivity levels?
b. What are the effects of TV programs on children
behavior?
2
What is …….(Cont.)
2. Assumptions
a. The average age of the male students in this class
is higher than that of the female students.
b. A total of 60 per cent of females and 30 per cent
of males obtain ICDL certificates.
3. Statement / Challenge to investigate
a. Exploring phenomenon, customer satisfaction
with products, service or program.
b. Improving productivity, quality of service or
program
3
The importance of formulating
a research problem
• Formulation of a research problem is the first and most important
step of the research process.
• It is like the identification of a destination before undertaking a
journey.
• In the absence of a clear research problem, a clear and economical
plan is impossible.
• Therefore a research problem is like the foundation of a building.
• The type and design of the building is dependent upon the foundation.
If the foundation is well designed and strong you can expect the
building to be also.
• According to Kerlinger :
If one wants to solve a problem, one must generally know what the problem is. It can be
said that a large part of the problem lies in knowing what one is trying to do (1986:17).
4
Sources of Research Problem
• People
• Problem
• Program
• Phenomenon
5
Aspects of a Research
problem
Aspect of a
study
About Study of
People Individuals, organization,
groups, communities
They provide you with
the required information
or you collect
information from or
about them
Study
population
Problem Issues, situations,
associations, needs,
population, composition,
profiles, etc.
Program Content, structure,
outcome, attributes,
satisfaction, consumers,
service providers, etc.
Information you need to
collect to find answers to
your research questions
Phenomenon cause-and-effect
relationships, the study of
phenomenon itself, etc.
6
Considerations in Selecting
a Research Problem
• Interest : you must select a topic that interests you most. If you select a
topic which does not greatly interest you, it could become extremely difficult to
sustain the required motivation, and hence its completion as well as the amount
of time taken could be affected.
• Magnitude: you should have sufficient knowledge about the research
process to be able to visualize the work involved in completing the
proposed topic.
• Measurement of concepts: if you are using a concept in your study make
sure you are clear about its indicators and their measurements. Do not use
concepts in your research problem that you are not sure how to measure.
• Level of expertise: make sure you have an adequate level of expertise for
the task you are proposing. Allow for the fact that you will learn during the
study and may receive help from your research supervisors and others, but
remember you need to do most of the work yourself.
7
Considerations…….(Cont.)
 Relevance: select a topic that is of relevance to you as a professional.
Ensure that your study adds to the existing body of knowledge,
bridges current gaps or is useful in policy formulation. This will help
you to sustain interest in the study.
 Availability of data: if your topic requires collection of information
from secondary sources (office records, client records, census or other
already-published reports, etc.) before finalizing your topic, make sure
that these data are available and in the format you want.
 Ethical issues: in a situation where your topic deals with sensitive
issues, it is important to determine how ethical issues can affect the
study population, and how ethical problems can be over-come should
be thoroughly examined at the problem-formulation stage.
8
Steps in formulating a
research problem
1. Identify subject area of interest to you
2. Dissect the subject area into sub-areas
3. Select the most interest to you
4. Raise research questions
5. Formulate objectives
6. Assess your objectives
7. Double-check
9
10
11
12
Research Objectives
• Objectives are the goals you set out to attain in
your study. Since these objectives inform a
reader of what you want to do, it is important to
state them clearly and specifically.
• objectives should be listed under two headings:
1.Main Objectives
2.Sub-objectives
13
Research Objectives
• Main objective : is an overall statement of the
thrust of your study. It is also a statement of
main associations and relationships that you
seek to discover or establish.
• Sub-objectives : are the specific aspects of the
topic that you want to investigate within the
main framework of your study.
14
Sub-objectives
• Should be numerically listed
• Should be worded clearly and unambiguously
• Each sub-objective should contain only one
aspect of the study.
• Should start with words such as “To
determine”, “To find out”, “To ascertain”,
“To measure”, “To explore”, etc.
15
Characteristics of Objectives
1. Clear
2. Complete
3. Specific
4. Identify the main variables to be correlated
5. Identify the direction of relationship
16
17
Establishing Operational
Definition
• Is the definition of a variable in terms of the
specific activities to measure or indicate in the
empirical world (Neuman, 2000: 160).
• In many cases you need to develop operational
definitions for the variables you are studying
and for the population that becomes the source
of the information for your study.
• Operational definition may differ from
dictionary definition as well as from day-to-day
meanings.
18
Establishing Operational
Definition
• Operational definitions give an operational meaning
to the study population and the concepts used.
• The following example studies help to explain this. The
main objectives are:
– To find out the number of families living below the
poverty line
– To ascertain the impact of immigration on family
roles among immigrants
– To measure the effectiveness of a training program
designed to help young people
19
Operationalisation of Concepts
and the Study Populations
Study Concept Issue Study
Population
Issues
1 Poverty line What constitutes
“poverty line”?
Children Who would you
consider a “child”
2 Family roles What constitutes
“Family roles”?
Immigrants Who would you
consider and
immigrant?
3 Effectiveness What constitutes
“effectiveness”?
The young Who would you
consider a
“young”
You must Operationalise the concepts: define
in practical, observable and
measurable terms ‘poverty’, family
roles’ and ‘effectiveness’.
Operationalise the study population:
define in identifiable terms ‘children,
immigrants’, and ‘young’.
20
Operational Definitions
Concept Definition Concept Definition
Poverty line Total value of assets,
annual income below
50,000.00
Child A person who has not
attained puberty
Family roles Ability of family to
protect, guide, educate,
and support its
members
Immigrant A person who leaves his
native country to live
elsewhere
Effectiveness Ability to achieve
decided, decisive, and
desired results
The young An individual aged between
18 and 35.
21
PROBLEM/ PURPOSE
STATEMENT
22
• The statement of the problem is a short section
of the research, but perhaps the most
important.
• The Statement of the Problem section lays down
a guide to follow in all that comes after.
• A problem may be defined as the issue that
exists in the literature, theory, or a practice that
leads to a “need for the study”.
PROBLEM/ PURPOSE
STATEMENT
23
• A quantitative problem/purpose statement
identifies the type of relationship being
investigated between a set of variables
• whereas a qualitative problem/purpose
statement focuses on exploring or understanding
some phenomenon.
• The problem statement is more specific than the
topic and limits the scope of the research
problem.
PROBLEM/ PURPOSE
STATEMENT
24
Importance
1. The reader is oriented to the significant of
the study and the research questions or
hypothesis to follow;
2. Place the problem in a context; and
3. Finally provide the framework for
analyzing and reporting results.
Preliminary Research
Problem Statement Format
25
• Title:
– Specific and concise, preferably not exceeding 10 words
• Problem:
– A statement of the problem and the need in one or more paragraphs
• Objectives:
– A clear, concise, specific statement of what the research is expected
to achieve and the benefits that may accrue
Example:
The purpose of this (type of study) is to understand (what) of (who or
what) involving (what or who) from (when) in order to (purpose).
IDENTIFYING VARIABLES
26
• In the process of formulating a research problem
there are two important considerations:
• The use of concepts and the construction of
hypothesis.
• a concept that can be measured is called a
variable
THE DIFFERENCE BETWEEN
A CONCEPT AND VARIABLE
27
• Concepts are mental images or perceptions and
therefore their meanings vary markedly from
individual to individual, whereas variables are
measurable, of course with varying degrees of
accuracy.
• Measurability is the main difference between
a concept and a variable.
THE DIFFERENCE BETWEEN
A CONCEPT AND VARIABLE
28
Concept Variable
 Effectiveness
 Satisfaction
 Excellence
 Rich etc
 Gender (Male/Female)
 Attitude (Good/Bad)
 Age (‘X ‘years, ‘Y’ months)
 Income ($____/ Year)
 Weight(____ Kg)
 Religion (Orthodox, Muslim, Jew etc)
 Subjective impression
 No uniformity as to its
understanding among different
people
 As such can not be measured
 Measurable through the degree of
precision varies from scale to scale
and from variable to variable
E.g. Attitude- subjective, Income-
objective
shows the difference between a concept and a variable.
CONCEPT, INDICATORS AND
VARIABLES
29
• If you are using a concept in your study, you
need to consider its operationalization- that is,
how it will be measured.
• In most cases, to operationalise a concept you
first need to go through the process of identifying
indicators- a set of criteria reflecting the
concepts- which can then be converted into
variables.
CONCEPT, INDICATORS AND
VARIABLES
30
Concepts Indicators Variables Decision Level
(Working Definitions)
1. Rich 2. Income
3. Asset
4. Income per year
5. Total value of assets
6. If > $ 100,000
7. If > $250,000
8. High
academic
achievement
9. Average marks
obtained in exam
10. Aggregate marks
11. percentage of marks
13. percentage of marks
14. If >75 %
15.
16.
17. if > 80%
19. 3.Effectiven
ess of a
health
program
20.
21. a. No of patients
22. b. Changes in
23. mortality
24. 1. No of patients
served in a month
25. 2. Changes in Child
Death Rate (CMR)
26. 3. Changes in Age
Specific Death Rate
(ASDR)
27. 1. Whether the difference
in before and after level is
statistically significant
28. 2. Increase or decrease in
each variables
29.
TYPES OF VARIABLES
31
• Knowledge of the different variables and the way
they are measured plays a crucial role in a
research.
• Variables are important in bringing clarity and
specification to the conceptualization of a
research problem and to the development of a
research instruments.
TYPES OF VARIABLES
32
A. From the view point of Causation:
1. Independent variable (change);
2. Dependent variable (outcome);
3. Extraneous variable (affect); and
4. Intervening variable (Linking or connecting)
B. From the view point of the Study Design:
1. Active variable; and
2. Attribute variable
C. From the view point of Unit of Measurement:
1. Categorical variable;
2. Continuous variable
3. Qualitative variable; and
4. Quantitative variable
TYPES OF VARIABLES
33
A. From the view point of Causation:
• In studies that attempt to investigate a causal relationship
or association, four sets of variables may operate:
– Change variables, which are responsible for bringing about
change in a phenomenon;
– Outcome variable, which are the effects of a change in a
variable;
– Variables which affect the link between cause-and-effect
variables; and
– Connecting or linking variable, which in certain situations
are necessary to complete the relationship between cause-and-
effect variables.
TYPES OF VARIABLES
34
A. From the view point of Causation:
TYPES OF VARIABLES
35
A. From the view point of Causation:
• Independent Variable: The cause supposed to be responsible for
bringing about change(s) in a phenomenon/ situation.
• Dependent Variable: The outcome of the change(s) brought
about by introduction of an independent variable.
• Extraneous Variable: Several other factors operating in a real
life situation may affect changes in the dependent variable.
• Intervening Variable: sometimes called Confounding variable
links the independent and dependent variables; in certain
situations the relationship between an independent and dependent
variable can not be estimated without the intervention of another
variable
TYPES OF VARIABLES
36
A. From the view point of the Study Design:
1. Active Variable: Those variables that can be
manipulated, changed or controlled.
2. Attribute Variables: Those variables that can not be
manipulated, changed, or controlled; and that reflect
the characteristics of the study population.
– For example: age, gender, education, and income.
TYPES OF VARIABLES
37
A. From the view point of the Study Design:
Study Intervention
 Different teaching models
 Experimental intervention
 Program service
 etc
Study Population
 Age
 Gender
 Level of motivation
 Attitude
 Religion
 etc
Active variables Attribute variables
A researcher can manipulate A researcher cannot manipulate
Active and Attribute Variables
TYPES OF VARIABLES
38
A. From the view pint of the unit of measurement:
1. whether the unit of measurement is categorized
(as in nominal and ordinal scales) or continues
in nature (as in interval and ratio scales)
2. whether it is qualitative (as in nominal and
ordinal scales) or quantitative (as in interval
and ratio scales)
TYPES OF VARIABLES
39
A. From the view pint of the unit of measurement:
• The variables thus classified are called
categorical and continuous and qualitative and
quantitative.
• On the whole there is very little difference
between categorical and qualitative, and between
continuous and qualitative variables.
• The slight difference between them is explained below:
TYPES OF VARIABLES
40
A. From the view pint of the unit of measurement:
• Categorical variables: are measured on nominal
or ordinal measurement scales, whereas for
continuous variables the measurements are
made either on the interval or ratio scale.
Categorical variables can be:-
1. Constant,
2. Dichotomous, and
3. Polytomouse
TYPES OF VARIABLES
41
A. From the view pint of the unit of measurement:
Categorical Continuous Qualitative Quantitative
Constant Dichotomous Polytomous
o Water
o Tree
o Taxi
o Yes or No
o Good/Bad
o Rich/poor
o Male/female
o Hot/ Cold
Attitude
o strong
o favorable
o uncertain
o unfavorable
Age
o Old
o Young
o child
Income
o High
o middle
o Low
Income in $
Age in Years
Weight in (Kg)
Gender
o Male
o Female
Ed. level
o high
o Average
o low
Age
o Old
o Young
o Child
Education
level___ no.
years complete
Age ____
Years/months
Income____ $
per year
Temp____ Co, or
Fo
TYPES OF VARIABLES
42
TYPES OF MEASUREMENT
SCALES
43
• There are four measurement scales used in social
sciences.
• According to S.S Stevens (1946) the different types of
measurement scale are classified into four categories.
1. Nominal or classificatory
2. Ordinal or ranking scale
3. Interval scale
4. Ratio scale
TYPES OF MEASUREMENT
SCALES
44
• There are four measurement scales used in social
sciences.
• According to S.S Stevens (1946) the different types of
measurement scale are classified into four categories.
1. Nominal or classificatory
2. Ordinal or ranking scale
3. Interval scale
4. Ratio scale
TYPES OF MEASUREMENT
SCALES
45
A. The Nominal or Classificatory Scale
• A nominal scale enables the classification of individuals,
objectives or responses based on the common/ shared property or
characteristics.
• These people, objects or responses are divided into a number of
subjects in such a way that each number of the subgroup has
common characteristics.
• A variable measured on a nominal scale may have one two or
more sub categories depending up on the extent of variation.
• Example:
– a customer survey asking “Which brand of smartphones do you prefer?”
Options : “Apple”- 1 , “Samsung”-2, “OnePlus”-3.
The Nominal or Classificatory
Scale
Measurement
Scale
Examples Characteristics of the scale
Nominal/
Classificatory
Scale
A. tree, plant, taxi etc
B. gender: male/female
C. political parties
-labor
-liberal
-Democrat
-Green
D. Religion
- Christian
- Islam
- Jew….etc
Each subgroup has a
characteristics/properties
which is common to all
classified with in that
subgroup
46
TYPES OF MEASUREMENT
SCALES
47
B. The Ordinal or Ranking Scale
• Besides categorizing individuals, objects, responses or a property
into a sub group on the basis of common characteristics, it ranks
the sub group in a certain order.
• They are arranged in ascending or descending order according to
the extent a sub category reflects the magnitude of the variation in
variable.
• Also the ‘distance between the sub-categories’ is not equal as
there is no quantitative unit of measurement.
• Example:
– How satisfied are you with our services?
• 1- Very Unsatisfied, 2- Unsatisfied, 3- Neutral, 4- Satisfied, 5- Very Satisfied
The Ordinal or Ranking Scale
Measurement
Scale
Examples Characteristics of the scale
Ordinal/
Ranking Scale
Income
-above average
-average
-below average
Socio economic status
 upper
 middle
 low
attitudes:
 strongly favorable
 favorable
 Uncertain
 Unfavorable
 Strongly unfavorable
Attitudinal Scale (Likert Scale) these are numerical
categories)
 0 – 30
 31 – 40
 41 – 50 e.tc
It has the characteristics of the nominal scale
plus subgroups have a relation ship to one
another. They are arranged in ascending order.
48
TYPES OF MEASUREMENT
SCALES
49
C. The Interval Scale
• An interval scale has all the characteristics of an ordinal scale; i.e,
individuals or responses belonging to the sub category have common
characteristics and the sub categories are arranged in an ascending/
descending order.
• In addition, an interval scale uses a unit of measurement that enables
the individual/responses to be equal spaced intervals in relation to the
spread of the variables.
• This scale has a starting and terminating points and the number of
units/intervals between them are arbitrary and vary from scale to scale.
• Example:
– What is your family income?
The Interval Scale
Measurement
Scale
Examples Characteristics of the scale
Interval Scale Temperature:
 Celsius – 0o C
 Fahrenheit – 32o F
Attitude scale (Thurston Scale)
 10- 20
 21 – 30
 31 -40
 41 – 50 etc
(Differential scale)
It has all the characteristics
of an ordinal scale
Plus
It has a unit of measurement
with an arbitrarily starting
and terminating point.
50
TYPES OF MEASUREMENT
SCALES
51
D. The Ratio Scale
• A ratio scale has all the properties of nominal, ordinal, and interval
scales plus its own property.
• The zero point of a ratio scale is fixed, which means it has a fixed
starting point.
• Therefore, it can be an absolute scale – the difference between the
interval is always measured from a ratio point.
• This means the ratio scale can be used for mathematical operations.
• The measurement of income, age, height, and weight are examples of
this scale. A person who is 40-years of age is twice as old as 20-years
old. A person earning $60,000.00 per year earns three times the salary
of a person earning $ 20,000.00.
The Ratio Scale
Measurem
ent Scale
Examples Characteristics of
the scale
Ratio Scale Height; Cm
Income: $
Age: Yrs/ months
Weight: Kg
Attitudinal score (Guthman scale)
(commutative scale )
It has all the properties of an
interval scale.
Plus
It has a fixed starting point,
e.g. a Zero point ratio scale.
52
CONSTRUCTING HYPOTHESIS
• The goal of defining the problem is to state the
research questions clearly and to have well
formulated hypotheses.
• A hypothesis is an unproven proposition or
possible solution to a problem.
• A hypothesis is also a statement about the nature
of the world, and in its simplest form it is a
guess.
53
CONSTRUCTING HYPOTHESIS
• Problem statements and hypotheses are similar.
Both state relationships, but problem statements
phrased as questions are interrogative and
hypotheses are declarative.
54
Definition of Hypothesis
• A hypothesis states the researcher’s expectations
concerning the relationship between the
variables in the research problem; a hypothesis
is the most specific statement of the problem.
• The hypothesis is formulated following the review
of related literature and prior to the execution of
the study.
55
Definition of Hypothesis
• Hypothesis brings clarity, specificity, and focuses
to a research problem but is not essential for a
study.
• You can conduct a valid investigation without
constructing a single formal Hypothesis.
56
Example
Let us imagine you are at the races and place a bet. You bet on a
hunch that a particular horse will win. You will only know if your
hunch was right after a race. Take another example, suppose you
have a hunch that there are more smokers than nonsmokers in
your class. To test your hunch, you ask either all or just some of
the class if they are smokers. You can then conclude whether your
hunch was right or wrong.
Definition of Hypothesis
There are many definitions of hypothesis:-
• KERLINGER: - “a hypothesis is a
conjectural statement of the relationship
between two or more variables.”
• BLACK AND CHAMPION, “a hypothesis
is a tentative statement about something, the
validity of which is usually unknown”
(1976:126).
57
The Functions of Hypothesis
• a good hypothesis states as clearly and concisely
as possible the expected relationship (or
difference) between two variables and defines
those variables in operational, measurable terms.
• If it is well formulated, defined, and stated, a
hypothesis will also be testable.
• A simply but clearly stated hypothesis makes it
easier for consumers of research to understand,
simplifies the testing, and facilitates formulation
of conclusions following data analysis.
58
The Functions of Hypothesis
• a good hypothesis states as clearly and concisely
as possible the expected relationship (or
difference) between two variables and defines
those variables in operational, measurable terms.
• If it is well formulated, defined, and stated, a
hypothesis will also be testable.
• A simply but clearly stated hypothesis makes it
easier for consumers of research to understand,
simplifies the testing, and facilitates formulation
of conclusions following data analysis.
59
The Functions of Hypothesis
60
Figure 2.8: The process of testing hypothesis
The Functions of Hypothesis
• Specifically a hypothesis serves the following
functions:-
1. The formulation of hypothesis provides a study with
focus. It tells you what specific aspects of research
problem to investigate
2. A hypothesis tells you what data to collect and what
not to collect, there by providing focus to the study.
3. As it provides a focus the construction of a
hypothesis enhances objectively in a study.
4. A hypothesis may enable you to add to the formation
of theory. It enables to specifically conclude what is
true or what is False.
61
The Characteristics of Hypothesis
1. A hypothesis should be simple, specific, and
conceptually clear.
a. No place for ambiguity.
b. It should be one-dimensional (test only one relationship
or hunch at a time)
c. Familiarity with the subject area (literature review has
importance)
• Example: “The average age of the male students in this
class is higher than that of the female students”
• Compare: average age of this class
• Population groups: female and male students
• Establish: higher average of the male students
62
The Characteristics of Hypothesis
2. A hypothesis should be capable of verification.
• Methods and techniques should be available for data
collection and analysis.
3. A hypothesis should be related to the existing body
of knowledge.
– It is important that your hypothesis emerges from the existing body of
knowledge, and that it adds it, as this an important function of
research.
4. A hypothesis should be operationalisable.
– This means that it can be expressed in terms that can be measured.
63
Types of Hypothesis
• As explained, any assumption that you seek to
validate through an enquiry is called a
Hypothesis.
• Hypotheses can be classified
– in terms of how they are derived
• inductive hypothesis
• deductive hypothesis
– how they are stated
• declarative hypothesis
• Null hypothesis
64
Types of Hypothesis
• An inductive hypothesis is a generalization based
on observation.
– Certain variables are noted to be related in a number of
situations, and a tentative explanation, or hypothesis,
is formulated.
– Such inductively derived hypotheses can be very
useful but are of limited scientific value in that they
produce results that are not meaningfully related to
any larger body or research.
65
Types of Hypothesis
• Deductive hypotheses derived from theory do
contribute to the science of management by
providing evidence that supports, expands, or
contradicts a given theory and by suggesting
future studies.
• In other words, your hypothesis should be a
logical extension of previous efforts, not an
inferential leap.
66
Types of Hypothesis
• Hypotheses are classified as research hypothesis or
statistical /alternate hypothesis; research hypotheses are
stated in declarative form, and statistical hypotheses are
stated in null form. A research hypothesis states an
expected relationship or difference between tow variables;
in other words, the relationship the researcher expects to
verify through the collection and analysis of data is
specified. Research, or declarative, hypotheses are non-
directional or directional. A non-directional hypothesis
simply indicated that a relationship or difference exists; a
directional hypothesis indicated the nature of the
relationship or difference.
67
Types of Hypothesis
• The formulation of an alternate hypothesis is a
convention in scientific circles. Its main function
is to explicitly specify the relation ship that will
be considered as true in case the research
hypothesis proves to be wrong.
• In a way, an alternate hypothesis is the opposite of a
research hypothesis. Again, conventionally, a null
hypothesis, or hypothesis of no difference, is formulated
as an alternate hypothesis. There are several ways of
formulating a hypothesis:
68
Types of Hypothesis
• For example: suppose you want to study “The
smoking pattern in a community in relation to gender
differentials.” The following hypothesis could be
constructed:-
– Ex.1 There is no significance difference in the proportion
of male and female smokers in the study population.
– Ex.2 A greater proportion of females than males are
smokers in the study population.
– Ex.3 A total of 60% of females and 30% of males in the
study population are smokers.
– Ex.4 There are twice as many female smokers as male
smokers in the study population.
69
Types of Hypothesis
– WHEN YOU CONSTRUCT A HYPOTHESIS STIPULATING THAT THERE IS
“NO DIFFERENCE” BETWEEN TWO SITUATIONS, THIS IS CALLED A
“NULL- HYPOTHESIS” AND IS USUALLY WRITTEN AS HO. (EX. 1)
•
– A HYPOTHESIS IN WHICH A RESEARCHER STIPULATES THAT “THERE
WILL BE A DIFFERENCE” BUT DOES NOT SPECIFY ITS MAGNITUDE IS
CALLED A HYPOTHESIS OF DIFFERENCE. (EX. 2)
– EXAMINE THE THIRD HYPOTHESIS: THE PROPOSITION OF FEMALE AND
MALE SMOKERS IS 60 AND 30 PERCENT RESPECTIVELY. THIS TYPE OF
HYPOTHESIS IS KNOWN AS A “HYPOTHESIS OF POINT-PREVALENCE.”
– A hypothesis in which a researcher stipulates that the extent of the relationship or
prevalence of a phenomenon in different population groups (twice as many female as
male smokers) is called “hypothesis of association.”
70
Types of Hypothesis
71
Figure 2.9 Types of Hypothesis
Types of Hypothesis
• Statistical, or null, hypotheses are usually used
because they suit statistical techniques that
determine whether an observed relationship is
probably a change relationship or probably a true
relationship. The disadvantage of null hypotheses is
that they rarely express the researcher’s true
expectations based on insight and logic regarding the
results of a study. One solution is to state two
hypotheses, a declarative research hypothesis that
communicated your true expectation and a statistical
null hypothesis that permits precise statistical testing.
72
Types of Hypothesis
• Another solution is to state a research
hypothesis, analyze your data assuming a null
hypothesis, and then make inferences concerning
your research hypothesis based on your testing of
a null hypothesis. Given that few studies are really
designed to verify the non-existence of a
relationship, it seems logical that most studies
should be based on a non-null research
hypothesis.
73
Testing the Hypothesis
• Hypothesis testing is really what scientific
research is all about, In order to test a
hypothesis, the researcher determines the
sample, measuring instruments, design, and
procedure that will enable her or him to collect
the necessary data. Collected data are then
analyzed in a manner that permits the
researcher to determine the validity of the
hypothesis.
74
Testing the Hypothesis
• Hypothesis testing is really what scientific
research is all about, In order to test a
hypothesis, the researcher determines the
sample, measuring instruments, design, and
procedure that will enable her or him to collect
the necessary data. Collected data are then
analyzed in a manner that permits the
researcher to determine the validity of the
hypothesis.
75
Thank You!
76

CH-2 Formulating Research Problem.pptx

  • 1.
  • 2.
    What is aResearch Problem? • Any question that you want to answer or any assumption or statement that you want to challenge or investigate or examine can become a research problem. 1. Questions to answer: a. Is there any relationship between decentralization and productivity levels? b. What are the effects of TV programs on children behavior? 2
  • 3.
    What is …….(Cont.) 2.Assumptions a. The average age of the male students in this class is higher than that of the female students. b. A total of 60 per cent of females and 30 per cent of males obtain ICDL certificates. 3. Statement / Challenge to investigate a. Exploring phenomenon, customer satisfaction with products, service or program. b. Improving productivity, quality of service or program 3
  • 4.
    The importance offormulating a research problem • Formulation of a research problem is the first and most important step of the research process. • It is like the identification of a destination before undertaking a journey. • In the absence of a clear research problem, a clear and economical plan is impossible. • Therefore a research problem is like the foundation of a building. • The type and design of the building is dependent upon the foundation. If the foundation is well designed and strong you can expect the building to be also. • According to Kerlinger : If one wants to solve a problem, one must generally know what the problem is. It can be said that a large part of the problem lies in knowing what one is trying to do (1986:17). 4
  • 5.
    Sources of ResearchProblem • People • Problem • Program • Phenomenon 5
  • 6.
    Aspects of aResearch problem Aspect of a study About Study of People Individuals, organization, groups, communities They provide you with the required information or you collect information from or about them Study population Problem Issues, situations, associations, needs, population, composition, profiles, etc. Program Content, structure, outcome, attributes, satisfaction, consumers, service providers, etc. Information you need to collect to find answers to your research questions Phenomenon cause-and-effect relationships, the study of phenomenon itself, etc. 6
  • 7.
    Considerations in Selecting aResearch Problem • Interest : you must select a topic that interests you most. If you select a topic which does not greatly interest you, it could become extremely difficult to sustain the required motivation, and hence its completion as well as the amount of time taken could be affected. • Magnitude: you should have sufficient knowledge about the research process to be able to visualize the work involved in completing the proposed topic. • Measurement of concepts: if you are using a concept in your study make sure you are clear about its indicators and their measurements. Do not use concepts in your research problem that you are not sure how to measure. • Level of expertise: make sure you have an adequate level of expertise for the task you are proposing. Allow for the fact that you will learn during the study and may receive help from your research supervisors and others, but remember you need to do most of the work yourself. 7
  • 8.
    Considerations…….(Cont.)  Relevance: selecta topic that is of relevance to you as a professional. Ensure that your study adds to the existing body of knowledge, bridges current gaps or is useful in policy formulation. This will help you to sustain interest in the study.  Availability of data: if your topic requires collection of information from secondary sources (office records, client records, census or other already-published reports, etc.) before finalizing your topic, make sure that these data are available and in the format you want.  Ethical issues: in a situation where your topic deals with sensitive issues, it is important to determine how ethical issues can affect the study population, and how ethical problems can be over-come should be thoroughly examined at the problem-formulation stage. 8
  • 9.
    Steps in formulatinga research problem 1. Identify subject area of interest to you 2. Dissect the subject area into sub-areas 3. Select the most interest to you 4. Raise research questions 5. Formulate objectives 6. Assess your objectives 7. Double-check 9
  • 10.
  • 11.
  • 12.
  • 13.
    Research Objectives • Objectivesare the goals you set out to attain in your study. Since these objectives inform a reader of what you want to do, it is important to state them clearly and specifically. • objectives should be listed under two headings: 1.Main Objectives 2.Sub-objectives 13
  • 14.
    Research Objectives • Mainobjective : is an overall statement of the thrust of your study. It is also a statement of main associations and relationships that you seek to discover or establish. • Sub-objectives : are the specific aspects of the topic that you want to investigate within the main framework of your study. 14
  • 15.
    Sub-objectives • Should benumerically listed • Should be worded clearly and unambiguously • Each sub-objective should contain only one aspect of the study. • Should start with words such as “To determine”, “To find out”, “To ascertain”, “To measure”, “To explore”, etc. 15
  • 16.
    Characteristics of Objectives 1.Clear 2. Complete 3. Specific 4. Identify the main variables to be correlated 5. Identify the direction of relationship 16
  • 17.
  • 18.
    Establishing Operational Definition • Isthe definition of a variable in terms of the specific activities to measure or indicate in the empirical world (Neuman, 2000: 160). • In many cases you need to develop operational definitions for the variables you are studying and for the population that becomes the source of the information for your study. • Operational definition may differ from dictionary definition as well as from day-to-day meanings. 18
  • 19.
    Establishing Operational Definition • Operationaldefinitions give an operational meaning to the study population and the concepts used. • The following example studies help to explain this. The main objectives are: – To find out the number of families living below the poverty line – To ascertain the impact of immigration on family roles among immigrants – To measure the effectiveness of a training program designed to help young people 19
  • 20.
    Operationalisation of Concepts andthe Study Populations Study Concept Issue Study Population Issues 1 Poverty line What constitutes “poverty line”? Children Who would you consider a “child” 2 Family roles What constitutes “Family roles”? Immigrants Who would you consider and immigrant? 3 Effectiveness What constitutes “effectiveness”? The young Who would you consider a “young” You must Operationalise the concepts: define in practical, observable and measurable terms ‘poverty’, family roles’ and ‘effectiveness’. Operationalise the study population: define in identifiable terms ‘children, immigrants’, and ‘young’. 20
  • 21.
    Operational Definitions Concept DefinitionConcept Definition Poverty line Total value of assets, annual income below 50,000.00 Child A person who has not attained puberty Family roles Ability of family to protect, guide, educate, and support its members Immigrant A person who leaves his native country to live elsewhere Effectiveness Ability to achieve decided, decisive, and desired results The young An individual aged between 18 and 35. 21
  • 22.
    PROBLEM/ PURPOSE STATEMENT 22 • Thestatement of the problem is a short section of the research, but perhaps the most important. • The Statement of the Problem section lays down a guide to follow in all that comes after. • A problem may be defined as the issue that exists in the literature, theory, or a practice that leads to a “need for the study”.
  • 23.
    PROBLEM/ PURPOSE STATEMENT 23 • Aquantitative problem/purpose statement identifies the type of relationship being investigated between a set of variables • whereas a qualitative problem/purpose statement focuses on exploring or understanding some phenomenon. • The problem statement is more specific than the topic and limits the scope of the research problem.
  • 24.
    PROBLEM/ PURPOSE STATEMENT 24 Importance 1. Thereader is oriented to the significant of the study and the research questions or hypothesis to follow; 2. Place the problem in a context; and 3. Finally provide the framework for analyzing and reporting results.
  • 25.
    Preliminary Research Problem StatementFormat 25 • Title: – Specific and concise, preferably not exceeding 10 words • Problem: – A statement of the problem and the need in one or more paragraphs • Objectives: – A clear, concise, specific statement of what the research is expected to achieve and the benefits that may accrue Example: The purpose of this (type of study) is to understand (what) of (who or what) involving (what or who) from (when) in order to (purpose).
  • 26.
    IDENTIFYING VARIABLES 26 • Inthe process of formulating a research problem there are two important considerations: • The use of concepts and the construction of hypothesis. • a concept that can be measured is called a variable
  • 27.
    THE DIFFERENCE BETWEEN ACONCEPT AND VARIABLE 27 • Concepts are mental images or perceptions and therefore their meanings vary markedly from individual to individual, whereas variables are measurable, of course with varying degrees of accuracy. • Measurability is the main difference between a concept and a variable.
  • 28.
    THE DIFFERENCE BETWEEN ACONCEPT AND VARIABLE 28 Concept Variable  Effectiveness  Satisfaction  Excellence  Rich etc  Gender (Male/Female)  Attitude (Good/Bad)  Age (‘X ‘years, ‘Y’ months)  Income ($____/ Year)  Weight(____ Kg)  Religion (Orthodox, Muslim, Jew etc)  Subjective impression  No uniformity as to its understanding among different people  As such can not be measured  Measurable through the degree of precision varies from scale to scale and from variable to variable E.g. Attitude- subjective, Income- objective shows the difference between a concept and a variable.
  • 29.
    CONCEPT, INDICATORS AND VARIABLES 29 •If you are using a concept in your study, you need to consider its operationalization- that is, how it will be measured. • In most cases, to operationalise a concept you first need to go through the process of identifying indicators- a set of criteria reflecting the concepts- which can then be converted into variables.
  • 30.
    CONCEPT, INDICATORS AND VARIABLES 30 ConceptsIndicators Variables Decision Level (Working Definitions) 1. Rich 2. Income 3. Asset 4. Income per year 5. Total value of assets 6. If > $ 100,000 7. If > $250,000 8. High academic achievement 9. Average marks obtained in exam 10. Aggregate marks 11. percentage of marks 13. percentage of marks 14. If >75 % 15. 16. 17. if > 80% 19. 3.Effectiven ess of a health program 20. 21. a. No of patients 22. b. Changes in 23. mortality 24. 1. No of patients served in a month 25. 2. Changes in Child Death Rate (CMR) 26. 3. Changes in Age Specific Death Rate (ASDR) 27. 1. Whether the difference in before and after level is statistically significant 28. 2. Increase or decrease in each variables 29.
  • 31.
    TYPES OF VARIABLES 31 •Knowledge of the different variables and the way they are measured plays a crucial role in a research. • Variables are important in bringing clarity and specification to the conceptualization of a research problem and to the development of a research instruments.
  • 32.
    TYPES OF VARIABLES 32 A.From the view point of Causation: 1. Independent variable (change); 2. Dependent variable (outcome); 3. Extraneous variable (affect); and 4. Intervening variable (Linking or connecting) B. From the view point of the Study Design: 1. Active variable; and 2. Attribute variable C. From the view point of Unit of Measurement: 1. Categorical variable; 2. Continuous variable 3. Qualitative variable; and 4. Quantitative variable
  • 33.
    TYPES OF VARIABLES 33 A.From the view point of Causation: • In studies that attempt to investigate a causal relationship or association, four sets of variables may operate: – Change variables, which are responsible for bringing about change in a phenomenon; – Outcome variable, which are the effects of a change in a variable; – Variables which affect the link between cause-and-effect variables; and – Connecting or linking variable, which in certain situations are necessary to complete the relationship between cause-and- effect variables.
  • 34.
    TYPES OF VARIABLES 34 A.From the view point of Causation:
  • 35.
    TYPES OF VARIABLES 35 A.From the view point of Causation: • Independent Variable: The cause supposed to be responsible for bringing about change(s) in a phenomenon/ situation. • Dependent Variable: The outcome of the change(s) brought about by introduction of an independent variable. • Extraneous Variable: Several other factors operating in a real life situation may affect changes in the dependent variable. • Intervening Variable: sometimes called Confounding variable links the independent and dependent variables; in certain situations the relationship between an independent and dependent variable can not be estimated without the intervention of another variable
  • 36.
    TYPES OF VARIABLES 36 A.From the view point of the Study Design: 1. Active Variable: Those variables that can be manipulated, changed or controlled. 2. Attribute Variables: Those variables that can not be manipulated, changed, or controlled; and that reflect the characteristics of the study population. – For example: age, gender, education, and income.
  • 37.
    TYPES OF VARIABLES 37 A.From the view point of the Study Design: Study Intervention  Different teaching models  Experimental intervention  Program service  etc Study Population  Age  Gender  Level of motivation  Attitude  Religion  etc Active variables Attribute variables A researcher can manipulate A researcher cannot manipulate Active and Attribute Variables
  • 38.
    TYPES OF VARIABLES 38 A.From the view pint of the unit of measurement: 1. whether the unit of measurement is categorized (as in nominal and ordinal scales) or continues in nature (as in interval and ratio scales) 2. whether it is qualitative (as in nominal and ordinal scales) or quantitative (as in interval and ratio scales)
  • 39.
    TYPES OF VARIABLES 39 A.From the view pint of the unit of measurement: • The variables thus classified are called categorical and continuous and qualitative and quantitative. • On the whole there is very little difference between categorical and qualitative, and between continuous and qualitative variables. • The slight difference between them is explained below:
  • 40.
    TYPES OF VARIABLES 40 A.From the view pint of the unit of measurement: • Categorical variables: are measured on nominal or ordinal measurement scales, whereas for continuous variables the measurements are made either on the interval or ratio scale. Categorical variables can be:- 1. Constant, 2. Dichotomous, and 3. Polytomouse
  • 41.
    TYPES OF VARIABLES 41 A.From the view pint of the unit of measurement: Categorical Continuous Qualitative Quantitative Constant Dichotomous Polytomous o Water o Tree o Taxi o Yes or No o Good/Bad o Rich/poor o Male/female o Hot/ Cold Attitude o strong o favorable o uncertain o unfavorable Age o Old o Young o child Income o High o middle o Low Income in $ Age in Years Weight in (Kg) Gender o Male o Female Ed. level o high o Average o low Age o Old o Young o Child Education level___ no. years complete Age ____ Years/months Income____ $ per year Temp____ Co, or Fo
  • 42.
  • 43.
    TYPES OF MEASUREMENT SCALES 43 •There are four measurement scales used in social sciences. • According to S.S Stevens (1946) the different types of measurement scale are classified into four categories. 1. Nominal or classificatory 2. Ordinal or ranking scale 3. Interval scale 4. Ratio scale
  • 44.
    TYPES OF MEASUREMENT SCALES 44 •There are four measurement scales used in social sciences. • According to S.S Stevens (1946) the different types of measurement scale are classified into four categories. 1. Nominal or classificatory 2. Ordinal or ranking scale 3. Interval scale 4. Ratio scale
  • 45.
    TYPES OF MEASUREMENT SCALES 45 A.The Nominal or Classificatory Scale • A nominal scale enables the classification of individuals, objectives or responses based on the common/ shared property or characteristics. • These people, objects or responses are divided into a number of subjects in such a way that each number of the subgroup has common characteristics. • A variable measured on a nominal scale may have one two or more sub categories depending up on the extent of variation. • Example: – a customer survey asking “Which brand of smartphones do you prefer?” Options : “Apple”- 1 , “Samsung”-2, “OnePlus”-3.
  • 46.
    The Nominal orClassificatory Scale Measurement Scale Examples Characteristics of the scale Nominal/ Classificatory Scale A. tree, plant, taxi etc B. gender: male/female C. political parties -labor -liberal -Democrat -Green D. Religion - Christian - Islam - Jew….etc Each subgroup has a characteristics/properties which is common to all classified with in that subgroup 46
  • 47.
    TYPES OF MEASUREMENT SCALES 47 B.The Ordinal or Ranking Scale • Besides categorizing individuals, objects, responses or a property into a sub group on the basis of common characteristics, it ranks the sub group in a certain order. • They are arranged in ascending or descending order according to the extent a sub category reflects the magnitude of the variation in variable. • Also the ‘distance between the sub-categories’ is not equal as there is no quantitative unit of measurement. • Example: – How satisfied are you with our services? • 1- Very Unsatisfied, 2- Unsatisfied, 3- Neutral, 4- Satisfied, 5- Very Satisfied
  • 48.
    The Ordinal orRanking Scale Measurement Scale Examples Characteristics of the scale Ordinal/ Ranking Scale Income -above average -average -below average Socio economic status  upper  middle  low attitudes:  strongly favorable  favorable  Uncertain  Unfavorable  Strongly unfavorable Attitudinal Scale (Likert Scale) these are numerical categories)  0 – 30  31 – 40  41 – 50 e.tc It has the characteristics of the nominal scale plus subgroups have a relation ship to one another. They are arranged in ascending order. 48
  • 49.
    TYPES OF MEASUREMENT SCALES 49 C.The Interval Scale • An interval scale has all the characteristics of an ordinal scale; i.e, individuals or responses belonging to the sub category have common characteristics and the sub categories are arranged in an ascending/ descending order. • In addition, an interval scale uses a unit of measurement that enables the individual/responses to be equal spaced intervals in relation to the spread of the variables. • This scale has a starting and terminating points and the number of units/intervals between them are arbitrary and vary from scale to scale. • Example: – What is your family income?
  • 50.
    The Interval Scale Measurement Scale ExamplesCharacteristics of the scale Interval Scale Temperature:  Celsius – 0o C  Fahrenheit – 32o F Attitude scale (Thurston Scale)  10- 20  21 – 30  31 -40  41 – 50 etc (Differential scale) It has all the characteristics of an ordinal scale Plus It has a unit of measurement with an arbitrarily starting and terminating point. 50
  • 51.
    TYPES OF MEASUREMENT SCALES 51 D.The Ratio Scale • A ratio scale has all the properties of nominal, ordinal, and interval scales plus its own property. • The zero point of a ratio scale is fixed, which means it has a fixed starting point. • Therefore, it can be an absolute scale – the difference between the interval is always measured from a ratio point. • This means the ratio scale can be used for mathematical operations. • The measurement of income, age, height, and weight are examples of this scale. A person who is 40-years of age is twice as old as 20-years old. A person earning $60,000.00 per year earns three times the salary of a person earning $ 20,000.00.
  • 52.
    The Ratio Scale Measurem entScale Examples Characteristics of the scale Ratio Scale Height; Cm Income: $ Age: Yrs/ months Weight: Kg Attitudinal score (Guthman scale) (commutative scale ) It has all the properties of an interval scale. Plus It has a fixed starting point, e.g. a Zero point ratio scale. 52
  • 53.
    CONSTRUCTING HYPOTHESIS • Thegoal of defining the problem is to state the research questions clearly and to have well formulated hypotheses. • A hypothesis is an unproven proposition or possible solution to a problem. • A hypothesis is also a statement about the nature of the world, and in its simplest form it is a guess. 53
  • 54.
    CONSTRUCTING HYPOTHESIS • Problemstatements and hypotheses are similar. Both state relationships, but problem statements phrased as questions are interrogative and hypotheses are declarative. 54
  • 55.
    Definition of Hypothesis •A hypothesis states the researcher’s expectations concerning the relationship between the variables in the research problem; a hypothesis is the most specific statement of the problem. • The hypothesis is formulated following the review of related literature and prior to the execution of the study. 55
  • 56.
    Definition of Hypothesis •Hypothesis brings clarity, specificity, and focuses to a research problem but is not essential for a study. • You can conduct a valid investigation without constructing a single formal Hypothesis. 56 Example Let us imagine you are at the races and place a bet. You bet on a hunch that a particular horse will win. You will only know if your hunch was right after a race. Take another example, suppose you have a hunch that there are more smokers than nonsmokers in your class. To test your hunch, you ask either all or just some of the class if they are smokers. You can then conclude whether your hunch was right or wrong.
  • 57.
    Definition of Hypothesis Thereare many definitions of hypothesis:- • KERLINGER: - “a hypothesis is a conjectural statement of the relationship between two or more variables.” • BLACK AND CHAMPION, “a hypothesis is a tentative statement about something, the validity of which is usually unknown” (1976:126). 57
  • 58.
    The Functions ofHypothesis • a good hypothesis states as clearly and concisely as possible the expected relationship (or difference) between two variables and defines those variables in operational, measurable terms. • If it is well formulated, defined, and stated, a hypothesis will also be testable. • A simply but clearly stated hypothesis makes it easier for consumers of research to understand, simplifies the testing, and facilitates formulation of conclusions following data analysis. 58
  • 59.
    The Functions ofHypothesis • a good hypothesis states as clearly and concisely as possible the expected relationship (or difference) between two variables and defines those variables in operational, measurable terms. • If it is well formulated, defined, and stated, a hypothesis will also be testable. • A simply but clearly stated hypothesis makes it easier for consumers of research to understand, simplifies the testing, and facilitates formulation of conclusions following data analysis. 59
  • 60.
    The Functions ofHypothesis 60 Figure 2.8: The process of testing hypothesis
  • 61.
    The Functions ofHypothesis • Specifically a hypothesis serves the following functions:- 1. The formulation of hypothesis provides a study with focus. It tells you what specific aspects of research problem to investigate 2. A hypothesis tells you what data to collect and what not to collect, there by providing focus to the study. 3. As it provides a focus the construction of a hypothesis enhances objectively in a study. 4. A hypothesis may enable you to add to the formation of theory. It enables to specifically conclude what is true or what is False. 61
  • 62.
    The Characteristics ofHypothesis 1. A hypothesis should be simple, specific, and conceptually clear. a. No place for ambiguity. b. It should be one-dimensional (test only one relationship or hunch at a time) c. Familiarity with the subject area (literature review has importance) • Example: “The average age of the male students in this class is higher than that of the female students” • Compare: average age of this class • Population groups: female and male students • Establish: higher average of the male students 62
  • 63.
    The Characteristics ofHypothesis 2. A hypothesis should be capable of verification. • Methods and techniques should be available for data collection and analysis. 3. A hypothesis should be related to the existing body of knowledge. – It is important that your hypothesis emerges from the existing body of knowledge, and that it adds it, as this an important function of research. 4. A hypothesis should be operationalisable. – This means that it can be expressed in terms that can be measured. 63
  • 64.
    Types of Hypothesis •As explained, any assumption that you seek to validate through an enquiry is called a Hypothesis. • Hypotheses can be classified – in terms of how they are derived • inductive hypothesis • deductive hypothesis – how they are stated • declarative hypothesis • Null hypothesis 64
  • 65.
    Types of Hypothesis •An inductive hypothesis is a generalization based on observation. – Certain variables are noted to be related in a number of situations, and a tentative explanation, or hypothesis, is formulated. – Such inductively derived hypotheses can be very useful but are of limited scientific value in that they produce results that are not meaningfully related to any larger body or research. 65
  • 66.
    Types of Hypothesis •Deductive hypotheses derived from theory do contribute to the science of management by providing evidence that supports, expands, or contradicts a given theory and by suggesting future studies. • In other words, your hypothesis should be a logical extension of previous efforts, not an inferential leap. 66
  • 67.
    Types of Hypothesis •Hypotheses are classified as research hypothesis or statistical /alternate hypothesis; research hypotheses are stated in declarative form, and statistical hypotheses are stated in null form. A research hypothesis states an expected relationship or difference between tow variables; in other words, the relationship the researcher expects to verify through the collection and analysis of data is specified. Research, or declarative, hypotheses are non- directional or directional. A non-directional hypothesis simply indicated that a relationship or difference exists; a directional hypothesis indicated the nature of the relationship or difference. 67
  • 68.
    Types of Hypothesis •The formulation of an alternate hypothesis is a convention in scientific circles. Its main function is to explicitly specify the relation ship that will be considered as true in case the research hypothesis proves to be wrong. • In a way, an alternate hypothesis is the opposite of a research hypothesis. Again, conventionally, a null hypothesis, or hypothesis of no difference, is formulated as an alternate hypothesis. There are several ways of formulating a hypothesis: 68
  • 69.
    Types of Hypothesis •For example: suppose you want to study “The smoking pattern in a community in relation to gender differentials.” The following hypothesis could be constructed:- – Ex.1 There is no significance difference in the proportion of male and female smokers in the study population. – Ex.2 A greater proportion of females than males are smokers in the study population. – Ex.3 A total of 60% of females and 30% of males in the study population are smokers. – Ex.4 There are twice as many female smokers as male smokers in the study population. 69
  • 70.
    Types of Hypothesis –WHEN YOU CONSTRUCT A HYPOTHESIS STIPULATING THAT THERE IS “NO DIFFERENCE” BETWEEN TWO SITUATIONS, THIS IS CALLED A “NULL- HYPOTHESIS” AND IS USUALLY WRITTEN AS HO. (EX. 1) • – A HYPOTHESIS IN WHICH A RESEARCHER STIPULATES THAT “THERE WILL BE A DIFFERENCE” BUT DOES NOT SPECIFY ITS MAGNITUDE IS CALLED A HYPOTHESIS OF DIFFERENCE. (EX. 2) – EXAMINE THE THIRD HYPOTHESIS: THE PROPOSITION OF FEMALE AND MALE SMOKERS IS 60 AND 30 PERCENT RESPECTIVELY. THIS TYPE OF HYPOTHESIS IS KNOWN AS A “HYPOTHESIS OF POINT-PREVALENCE.” – A hypothesis in which a researcher stipulates that the extent of the relationship or prevalence of a phenomenon in different population groups (twice as many female as male smokers) is called “hypothesis of association.” 70
  • 71.
    Types of Hypothesis 71 Figure2.9 Types of Hypothesis
  • 72.
    Types of Hypothesis •Statistical, or null, hypotheses are usually used because they suit statistical techniques that determine whether an observed relationship is probably a change relationship or probably a true relationship. The disadvantage of null hypotheses is that they rarely express the researcher’s true expectations based on insight and logic regarding the results of a study. One solution is to state two hypotheses, a declarative research hypothesis that communicated your true expectation and a statistical null hypothesis that permits precise statistical testing. 72
  • 73.
    Types of Hypothesis •Another solution is to state a research hypothesis, analyze your data assuming a null hypothesis, and then make inferences concerning your research hypothesis based on your testing of a null hypothesis. Given that few studies are really designed to verify the non-existence of a relationship, it seems logical that most studies should be based on a non-null research hypothesis. 73
  • 74.
    Testing the Hypothesis •Hypothesis testing is really what scientific research is all about, In order to test a hypothesis, the researcher determines the sample, measuring instruments, design, and procedure that will enable her or him to collect the necessary data. Collected data are then analyzed in a manner that permits the researcher to determine the validity of the hypothesis. 74
  • 75.
    Testing the Hypothesis •Hypothesis testing is really what scientific research is all about, In order to test a hypothesis, the researcher determines the sample, measuring instruments, design, and procedure that will enable her or him to collect the necessary data. Collected data are then analyzed in a manner that permits the researcher to determine the validity of the hypothesis. 75
  • 76.