![E
e
ta
x
n
r
lk
a
A
d
o
y
mir
c
s
f
T
uw
h
t
R
F
n
g
o
Dg
a
r
R
d
e
c
u
i
t
on
RamMohanRao Pamoti Raval Chetan
Deputy Manager -CAE. Senior Manager -CAE
Mahindra Navistar Automotives Ltd Mahindra Navistar Automotives Ltd.
Pune - 411019, India Pune - 411019, India
Abstract
The aerodynamic characteristics of heavy commercial vehicles have received substantial interest recently, because of its
immediate impact on fuel efficiency at high speed cruising. In this study, a numerical simulation has been carried out for three-
dimensional turbulent flows around a MNAL truck carrying a container body. Particularly, the effect of a roof fairing attached on the
roof of the truck cabin was investigated. Spalart-allmaras turbulence model available in CFD solver ACUSOLVE was used for
evaluating aerodynamic forces, velocity and pressure distribution. The result shows the complex wake formation in the top front
edge of container and high pressure built up at exposed front face of the container. Roof fairing reduces the wake formation and
decreases aerodynamic drag, which in turn help reduce the fuel consumption of the truck.
Based on simulation, the height of roof fairing was further fine tuned, according to container height to get the best aero
dynamic drag reduction of 23%. Also, the pressure data on roof fairing was used for structural durability prediction under wind load
conditions using RADIOSS.
Keywords: Aerodynamics, truck, roof fairing, drag force.
Introduction:
Many studies of Heavy Commercial Vehicles (HCV) for long distant high way applications have shown
that significant proportion of fuel losses were due to aerodynamic drag [1]. Cost down tests have shown
that at speed above 60 mph, the aerodynamic drag account for 60% and rolling resistance causes 40% of
total drag. Therefore external aerodynamics study and simulation of HCV to reduce the aerodynamic drag
assumes importance in this era of high fuel costs.
Heavy commercial vehicles such as trucks and buses generally are large bluff bodies without overall
aerodynamic shape which causes strong wakes and trailing vortexes resulting in serious aerodynamic
drag at high speed cruising. Shinsuke, Jongsoo and Shuya etc.[2] investigated 3-dimentional turbulence
flow around bluff body, the effect of underbody slant and rear flaps on bluff body aerodynamics. Kim [3]
investigated the effect of rear spoiler on commercial bus body and reduced aerodynamic forces. Many
international OEMs have taken sustained measures to reduce air drag using aerodynamic front end, roof
fairings, cab extender, side skirts etc. The Department of Energy, USA, has launched Super Truck
program and set ambitious targets for HCV fuel economy improvements which include aerodynamic
improvements among other measures.
This paper presents interesting case of aerodynamic drag reduction of Mahindra Navistar’s 25T truck as
used in Indian scenario. MN25 straight truck is used with container load carriers which are of different
heights and built independently by road side body work. Therefore, an appropriate sized roof fairing with
Simulation Driven Innovation 8](https://image.slidesharecdn.com/cfd01externalaerodynamicsmahindranavistar-120831041721-phpapp02/85/Cfd01-external-aerodynamics_mahindra_navistar-1-320.jpg)
![E
e
ta
x
n
r
lk
a
A
d
o
y
mir
c
s
f
T
uw
h
t
R
F
n
g
o
Dg
a
r
R
d
e
c
u
i
t
on
RamMohanRao Pamoti Raval Chetan
Deputy Manager -CAE. Senior Manager -CAE
Mahindra Navistar Automotives Ltd Mahindra Navistar Automotives Ltd.
Pune - 411019, India Pune - 411019, India
Abstract
The aerodynamic characteristics of heavy commercial vehicles have received substantial interest recently, because of its
immediate impact on fuel efficiency at high speed cruising. In this study, a numerical simulation has been carried out for three-
dimensional turbulent flows around a MNAL truck carrying a container body. Particularly, the effect of a roof fairing attached on the
roof of the truck cabin was investigated. Spalart-allmaras turbulence model available in CFD solver ACUSOLVE was used for
evaluating aerodynamic forces, velocity and pressure distribution. The result shows the complex wake formation in the top front
edge of container and high pressure built up at exposed front face of the container. Roof fairing reduces the wake formation and
decreases aerodynamic drag, which in turn help reduce the fuel consumption of the truck.
Based on simulation, the height of roof fairing was further fine tuned, according to container height to get the best aero
dynamic drag reduction of 23%. Also, the pressure data on roof fairing was used for structural durability prediction under wind load
conditions using RADIOSS.
Keywords: Aerodynamics, truck, roof fairing, drag force.
Introduction:
Many studies of Heavy Commercial Vehicles (HCV) for long distant high way applications have shown
that significant proportion of fuel losses were due to aerodynamic drag [1]. Cost down tests have shown
that at speed above 60 mph, the aerodynamic drag account for 60% and rolling resistance causes 40% of
total drag. Therefore external aerodynamics study and simulation of HCV to reduce the aerodynamic drag
assumes importance in this era of high fuel costs.
Heavy commercial vehicles such as trucks and buses generally are large bluff bodies without overall
aerodynamic shape which causes strong wakes and trailing vortexes resulting in serious aerodynamic
drag at high speed cruising. Shinsuke, Jongsoo and Shuya etc.[2] investigated 3-dimentional turbulence
flow around bluff body, the effect of underbody slant and rear flaps on bluff body aerodynamics. Kim [3]
investigated the effect of rear spoiler on commercial bus body and reduced aerodynamic forces. Many
international OEMs have taken sustained measures to reduce air drag using aerodynamic front end, roof
fairings, cab extender, side skirts etc. The Department of Energy, USA, has launched Super Truck
program and set ambitious targets for HCV fuel economy improvements which include aerodynamic
improvements among other measures.
This paper presents interesting case of aerodynamic drag reduction of Mahindra Navistar’s 25T truck as
used in Indian scenario. MN25 straight truck is used with container load carriers which are of different
heights and built independently by road side body work. Therefore, an appropriate sized roof fairing with
Simulation Driven Innovation 8](https://image.slidesharecdn.com/cfd01externalaerodynamicsmahindranavistar-120831041721-phpapp02/75/Cfd01-external-aerodynamics_mahindra_navistar-1-2048.jpg)
![solver yields robustness and rapid convergence on large unstructured meshes even when high aspect
ratio and badly distorted elements are present.
The following form of the Navier-Stokes equations were solved by AcuSolve to simulate the flow around
the Truck:
∂ρ
+ ∇ • ρu = 0
∂t (1)
∂u
ρ + ρu • ∇u + ∇P = ∇τ + ρb
∂t (2)
where ρ=density, u=velocity vector, P=pressure, τ=viscous stress tensor, b=momentum source vector.
Due to low mach number involved in these simulation, the flow was assumed to be incompressible, and
the density time derivative in Eq. (1) was set to zero. the three dimensional steady flow is simulated using
RANS single equation Spalart-Allmaras turbulence model. The turbulence equation is solved using GLS
formulation. The model equation is as follows:
{ }
~
∂v ~ 2 1
v
+ u • ∇v = C b1 S v − C w1 f w + ∇ • [(v + v )∇v ] + C b2 (∇v )
~ ~~ ~ ~ ~2
∂t d σ (3)
~ ~
v χ χ3 ~
v
S=S + fv f v2 = 1 − f v1 = χ= S = 2 2S ij S ij
k 2d 2 2 1 + χf v
1
χ 3 + Cv 3
1
v
1/ 6
1 + Cw 6 1 ∂ui ∂u j ~
v
fw = g 6 3
g = r + C w2 (r 6 − r ) S ij = + r= ~ 2 2
g + Cw3
6
2 ∂x j ∂xi
Sk d
~
where v is Spalart-Allmaras auxiliary variable, d=length scale , C b1 =0.1355, σ =2/3 , k=0.41, Cw3=2 ,
Cv1=7.1, Cb2 =0.622, Cw1 =(Cb1/k2)+((1+Cb2)/σ)
The eddy viscosity is then defined by ~
v1 = v f w1
For the steady state solutions presented in this work, a first order time integration approach with infinite
time step size was used to iterate the solution to convergence. Steady state convergence was typically
reached within 100 time steps.
Results & Discussions:
Base line vehicle:
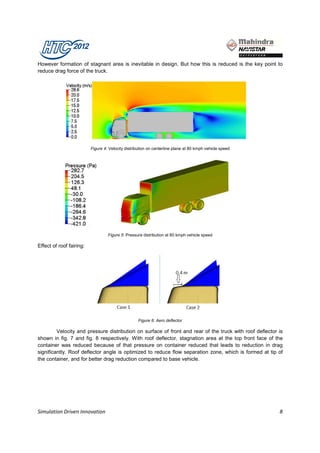
Velocity and Pressure distribution on surface of front and rear of the truck is presented in fig. 4.
and fig.5 respectively. Flow comes from the upstream end forms a stagnation area at middle of the front
fascia and container top surface which are directly exposed to air. The divergent of flow has increased
with increase in pressure value as a result of stagnation phenomenon and then at each curvature flow is
radically faster. The stagnation area at the front body is the main cause of drag force with high pressure.
Simulation Driven Innovation 8](https://image.slidesharecdn.com/cfd01externalaerodynamicsmahindranavistar-120831041721-phpapp02/85/Cfd01-external-aerodynamics_mahindra_navistar-4-320.jpg)
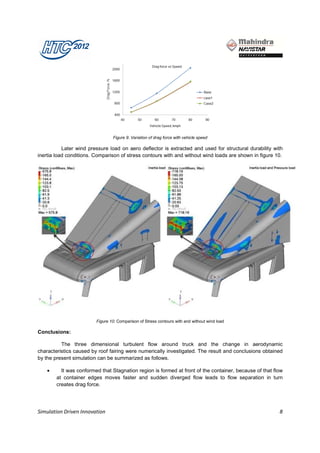

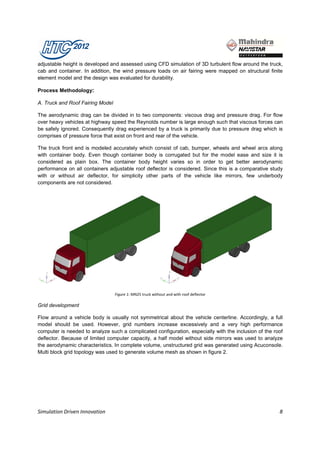
The numerical simulation analyzed the aerodynamic characteristics of a truck carrying a container body with and without a roof fairing. The roof fairing reduced the wake formation and pressure buildup at the front of the container, decreasing aerodynamic drag by up to 23%. The height of the roof fairing was optimized to maximize drag reduction for different container heights. Wind pressure data from the roof fairing was also used for structural analysis of durability under wind loads.


