More Related Content Similar to Daily livestock report dec 5 2012 Similar to Daily livestock report dec 5 2012 (20) More from joseleorcasita (20) 1. Vol. 10, No. 235 December 5, 2012
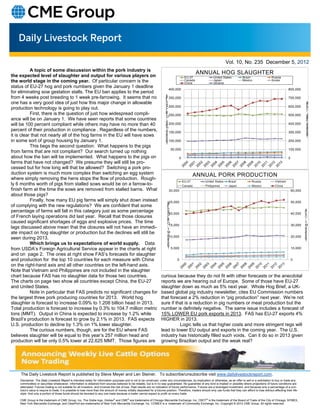
A topic of some discussion within the pork industry is
the expected level of slaughter and output for various players on
ANNUAL HOG SLAUGHTER
EU-27 United States Brazil Russia
the world stage in the coming year. Of particular concern is the Canada
China
Japan
Ukraine
Mexico Korea
status of EU-27 hog and pork numbers given the January 1 deadline
400,000 800,000
for eliminating sow gestation stalls. The EU ban applies to the period
s
from 4 weeks post breeding to 1 week pre-farrowing. It seems that no e 350,000
i
r
t
700,000
one has a very good idea of just how this major change in allowable n a
u n
i
o 300,000 600,000 h
production technology is going to play out. C
r C
e -
-
First, there is the question of just how widespread compli- h
t 250,000 500,000 d
O a
ance will be on January 1. We have seen reports that some countries -
- e
H
d
will be 100 percent compliant while others may have no more than 40 a 200,000 400,000 d
e n
H a
percent of their production in compliance . Regardless of the numbers, d s
n 150,000 300,000 u
a o
it is clear that not nearly all of the hog farms in the EU will have sows s h
u T
in some sort of group housing by January 1. o 100,000 200,000
h
T
This begs the second question: What happens to the pigs
50,000 100,000
from farms that are not compliant? Our search turned up nothing
about how the ban will be implemented. What happens to the pigs on 0 0
farms that have not changed? We presume they will still be pro-
cessed but for how long will that be allowed? Switching a pork pro-
duction system is much more complex than switching an egg system ANNUAL PORK PRODUCTION
where simply removing the hens stops the flow of production. Rough-
EU-27 United States Brazil Russia Vietnam
ly 6 months worth of pigs from stalled sows would be on a farrow-to- Canada Philippines Japan Mexico China
finish farm at the time the sows are removed from stalled barns. What 30,000 60,000
about those pigs?
Finally, how many EU pig farms will simply shut down instead s25,000 50,000
e
i
of complying with the new regulations? We are confident that some r
t
n a
percentage of farms will fall in this category just as some percentage u
o20,000 40,000
n
i
C h
of French laying operations did last year. Recall that those closures r
e
C
-
h -
caused significant shortages of eggs and explosive prices. The time t T
O M
lags discussed above mean that the closures will not have an immedi- - 15,000
- 30,000
d
T n
a
ate impact on hog slaughter or production but the declines will still be M
d
s
u
n10,000 20,000 o
seen during 2013. a
s
h
T
u
Which brings us to expectations of world supply. Data o
h
T 5,000 10,000
from USDA’s Foreign Agricultural Service appear in the charts at right
and on page 2. The ones at right show FAS’s forecasts for slaughter
and production for the top 10 countries for each measure with China 0 0
on the right-hand axis and all other countries on the left-hand axis.
Note that Vietnam and Philippines are not included in the slaughter
chart because FAS has no slaughter data for those two countries. curious because they do not fit with other forecasts or the anecdotal
The charts on page two show all countries except China, the EU-27 reports we are hearing out of Europe. Some of those have EU-27
and United States. slaughter down as much as 5% next year. Whole Hog Brief, a UK-
Note in particular that FAS predicts no significant changes for based global pig industry newsletter, cites EU Commission numbers
the largest three pork producing countries for 2013. World hog that forecast a 2% reduction in “pig production” next year. We’re not
slaughter is forecast to increase 0.09% to 1.208 billion head in 2013. sure if that is a reduction in pig numbers or meat production but the
Total production is forecast to increase by 0.3% to 104.7 million metric number is definitely negative. The same issue includes a forecast of
tons (MMT). Output in China is expected to increase by 1.2% while 15% LOWER EU pork exports in 2013. FAS has EU-27 exports 4%
Brazil’s production is forecast to grow by 2.1% in 2013. FAS expects HIGHER in 2013.
U.S. production to decline by 1.3% on 1% lower slaughter. Logic tells us that higher costs and more stringent regs will
The curious numbers, though, are for the EU where FAS lead to lower EU output and exports in the coming year. The U.S.
believes slaughter will be equal to this year’s 257 million head and industry has historically filled such voids. Can it do so in 2013 given
production will be only 0.5% lower at 22.625 MMT. Those figures are growing Brazilian output and the weak real?
The Daily Livestock Report is published by Steve Meyer and Len Steiner. To subscribe/unsubscribe visit www.dailylivestockreport.com.
Disclaimer: The Daily Livestock Report is intended solely for information purposes and is not to be construed, under any circumstances, by implication or otherwise, as an offer to sell or a solicitation to buy or trade any
commodities or securities whatsoever. Information is obtained from sources believed to be reliable, but is in no way guaranteed. No guarantee of any kind is implied or possible where projections of future conditions are
attempted. Futures trading is not suitable for all investors, and involves the risk of loss. Past results are no indication of future performance. Futures are a leveraged investment, and because only a percentage of a con-
tract’s value is require to trade, it is possible to lose more than the amount of money initially deposited for a futures position. Therefore, traders should only use funds that they can afford to lose without affecting their life-
style. And only a portion of those funds should be devoted to any one trade because a trader cannot expect to profit on every trade.
CME Group is the trademark of CME Group, Inc. The Globe logo, Globex® and CME® are trademarks of Chicago Mercantile Exchange, Inc. CBOT® is the trademark of the Board of Trade of the City of Chicago. NYMEX,
New York Mercantile Exchange, and ClearPort are trademarks of New York Mercantile Exchange. Inc. COMEX is a trademark of Commodity Exchange, Inc. Copyright © 2012 CME Group. All rights reserved.
2. Vol. 10, No. 235 December 5, 2012
ANN. HOG SLAUGHTER - SELECTED
Brazil Russia Canada Japan Mexico Korea Ukraine
40,000
35,000
30,000
d25,000
a
e
H
d
n20,000
a
s
u
o
h15,000
T
10,000
5,000
0
2000 2001 2002 2003 2004 2005 2006 2007 2008 2009 2010 2011 2012 2013
ANN. PORK PRODUCTION - SELECTED
Brazil Russia Vietnam Canada Philippines Japan Mexico
3,500
3,000
2,500
T
M2,000
d
n
a
s
u
o1,500
h
T
1,000
500
0
2000 2001 2002 2003 2004 2005 2006 2007 2008 2009 2010 2011 2012 2013